Abstract
No studies have tested the hypothesis that the onset of a disease can be predicted by gene expression profiling. The AKR/J mouse strain, which spontaneously develops acute T cell lymphatic leukemia, was used to implement a novel strategy to generate global gene expression profiles of WBCs at different time points. The experimental approach was bias free because it was unknown as to which individuals in the mouse population would eventually develop the disease. Our results suggest that profiling WBC gene expression may be an effective means for the very early diagnosis of disease in humans.
Keywords: lymphatic leukemia, genomics, AKR/J mice, white blood cells, immune response, disease prediction
Introduction
High-throughput genomics using microarrays allows the simultaneous assessment of relative RNA accumulation levels of thousands of genes from a given cell type or tissue. Microarrays have provided an explosion of information on the etiology and cellular mechanisms of disease [1], the diagnosis and classification of disease [2], and the drug response and treatment of disease [3]. However, no studies have explored the notion that gene expression profiles may be a powerful tool to predict the future development of a disease. Gene expression profiles are a potentially potent disease detection method because they reflect gene-environment interactions and because the expression of approximately 25,000 data points (genes) allows a potentially exquisitely sensitive measure of subtly different disease states, each state with a specific gene expression profile or signature.
The immune system of mammals responds in multiple ways when homeostasis is disturbed [4]. The innate and adaptive immune responses involve the commitment of the white blood cells (WBCs) or leukocytes, which include granulocytes (the polymorphmononuclear cells), monocytes and macrophages, and lymphocytes (B and T cells). Numerous studies have shown that tissue or organ damage via disease, ischemia, trauma, exposure to toxicants, etc., elicits a distinct WBC transcriptional response [5-9]. Thus, our hypothesis was that gene expression profiles of WBCs can provide an early and accurate indicator of a disease before the disease develops to the level of clinical detection.
To test the hypothesis that gene expression profiles may provide a method to identify an impending disease, we chose as a test system a mouse model that spontaneously develops lymphoma [10-13]. The AKR/J inbred mouse strain displays a high incidence of spontaneous acute T cell lymphatic leukemia that arises predominantly in the thymus of 6- to 12-month-old mice. The AKR/J mouse strain has a lymphatic leukemia incidence of 57% in males, 65% in females, and 4% in virgin females [14, 15].
Leukemogenesis in the AKR/J mouse is induced in the thymus by the recombination of a germline proviral AKV retrovirus and a murine leukemia virus (MuLV) to produce the recombined mink cell focus virus (MCFV) [10, 11]. The MCFV replicates in T cell lymphocytes and integrates into preferred sites of the T cell genome to disrupt key genes, e.g., c-myc [16]. The T cells form the major population of cells in the thymus. In the lymphoma and circulating T cells, copies of the MCFV are found integrated in the T cell genome to cause leukemia.
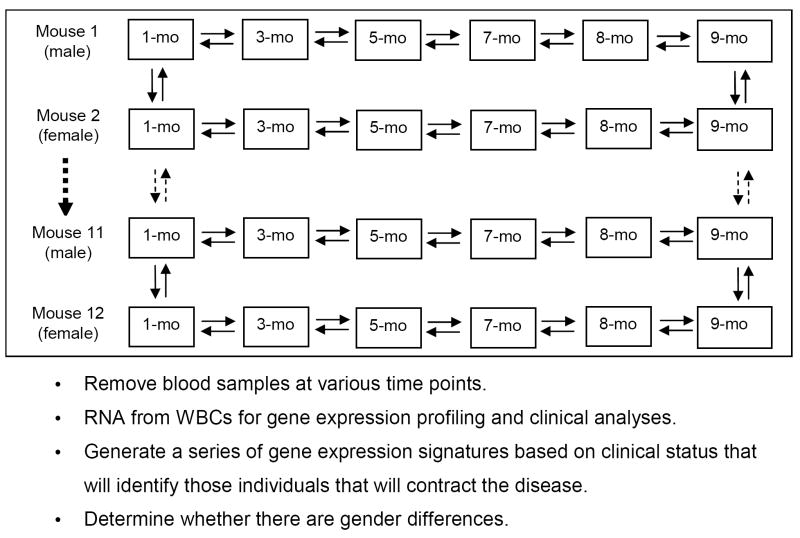
Our goals were to generate gene expression profiles of blood from a population of AKR/J mice at different time points from 30 d to 9 mo of age (Fig. 1) in which a certain proportion (60-70%) were expected to contract lymphatic leukemia within the 9-month time span [15], and use the profiles to construct predictor gene sets in order to identify those mice in the population that would contract lymphoma prior to its clinical manifestation. The experimental approach was bias free because it was unknown which individuals in the mouse population would eventually develop the disease. We show that gene expression profiles of WBCs may be a potent means to predict disease, which could lead to more effective preventative and therapeutic approaches.
Fig. 1.
Microarray experimental design to predict disease. Each box represents a time point for a given AKR/J mouse. The arrows between the boxes denote duplicate microarrays with a dye flip. The larger dashed arrow represents mice 3 through 10, and the smaller dashed arrows represent the microarray comparisons carried out at months (mo) 1 and 9 (the beginning and end of the study) between mice 1 and 2, mice 2 and 3, etc., to mice 11 and 12. The odd numbered mice were male and the even-numbered mice were female.
Methods and materials
Animals and blood collection
All uses of the animals were approved by the University of Cincinnati Institutional Animal Care and Use Committee. AKR/J mice (The Jackson Laboratory, Bar Harbor, Me) were 28-d old on arrival. Twelve mice (6 males and 6 females), beginning 2 d after arrival, were used for blood collection at 2-mo intervals until 9 mo of age. The mice were housed in static micro-isolator cages. Housing conditions were controlled for temperature (72°F), relative humidity (42%) and light/dark hours (12 h cycles, with the light cycle beginning at 6:00 AM). Food (Harlan Teklad LM485, Indianapolis, IN) and tap water were provided ad libitum. While the animal was warmed on the pad of a water temperature management system (Gaymar, Orchard Park, NY), up to 100 μl of blood was collected from the lateral tail vein using a microvette (Sarstedt, Newton, NC). The blood was stored in RNAlater (Ambion, Austin, TX). Mice that did not die of lymphoma were euthanized by asphyxiation with carbon dioxide at the end of the 9-mo study.
Clinical Analyses
Peripheral blood smears were made at each collection time, and at sacrifice, bone marrow was collected for microscopic examination [12]. The clinical blood tests included red blood cell and leukocyte hematocrits, leukocyte differentials to ascertain the number and relative proportion of each leukocyte cell type. At sacrifice, thymus, liver, and spleen histological preparations and bone marrow differentials were made for microscopic examination.
Microarray studies
Total RNA was isolated using RiboPure Blood Kit (Ambion, Austin, TX). Amplification of 0.5-2 μg RNA was carried out using the Amino Allyl MessageAmp aRNA Kit from Ambion. The in vitro transcription reaction was carried out for 6 hr. A mouse (Mus musculus) 70-mer oligonucleotide library (Operon Biotechnologies, Inc., Huntsville, AL), representing 24,878 annotated genes and 32,829 transcripts (version 3.0) was used and printed on slides. The microarray pre-hybridization, hybridization, washes, imaging, and data collection were carried out as described [17].
Data normalization and analysis
The data representing raw spot intensities generated by GenePix® Pro version 5.0 were analyzed to identify genes with informative patterns of expression. Data normalization was performed in three steps for each microarray separately [18-21]. Channel specific local background intensities were subtracted from the median intensity of each channel (Cy3 and Cy5). Second, background adjusted intensities were log-transformed and the differences (R) and averages (A) of log-transformed values were calculated as R = log2(X1) − log2(X2) and A = [log2(X1) + log2(X2)]/2, where X1 and X2 denote the Cy5 and Cy3 intensities after subtracting local backgrounds, respectively. Third, data centering was performed by fitting the array-specific local regression model of R as a function of A. The difference between the observed log-ratio and the corresponding fitted value represented the normalized log-transformed gene expression ratio. Normalized log-intensities for the two channels were then calculated by adding half of the normalized ratio to A for the Cy5 channel and subtracting half of the normalized ratio from A for the Cy3 channel. The average log-intensities (A) and normalized log-ratios were averaged for each comparison. Genes whose maximum average log-intensities were among the top 25% of all genes were selected for cluster analysis.
Cluster analysis
Clustering was performed using context-specific Bayesian infinite mixture (BIM) model based clustering using normalized expression values for each comparison. BIM model based clustering allowed for the fitting of the statistical mixture model without knowing the number of clusters in the data [22]. The statistical model was fitted using the Gibbs sampler, and hierarchical clustering was produced by treating pair-wise posterior probabilities as the similarity measure and applying the traditional complete-linkage principle. The clustering results were displayed using the TreeView program (http://www.treeview.net/).
Results and Discussion
An experimental strategy to predict disease
Our hypothesis was that disease onset can be predicted very early by WBC gene expression profiling. A complication that would normally arise from testing such a hypothesis is that in the study of most diseases, a large population would have to be analyzed in order to eventually capture those few individuals that would have contracted the disease in question. In lieu of that potential complication, the AKR/J mouse was selected as the test model system by virtue of its satisfying the following criteria. First, it is a model system with an adequate tissue (blood) supply that can be taken repeatedly over time without harming the animal. Second, the AKR/J mouse develops a disease of the blood, and thus, as a proof-of-principle, provided a greater likelihood that a straightforward prediction of disease states could be completed. Lastly and most importantly, the AKR/J mouse model randomly develops a disease at a proportion that allows adequate numbers for control (disease-free) and experimental (diseased) animals to be taken from a population. Thus, the novel experimental design employed here allowed an unbiased and elegant means to collect blood samples for the microarray experiments from “diseased” individuals before any individual actually developed the disease.
The microarray experiments were designed to maximize the ability to observe changes over time for control (non-diseased) and experimental (diseased) animals between males and females (Fig. 1). For each mouse, two dye-flipped microarrays were carried out at each time point. Approximately 150 profiles were generated from the experimental scheme shown in Fig. 1 (some mice died during the study precluding the attainment of the total possible 168 profiles).
Clinical analyses to determine lymphatic leukemia onset
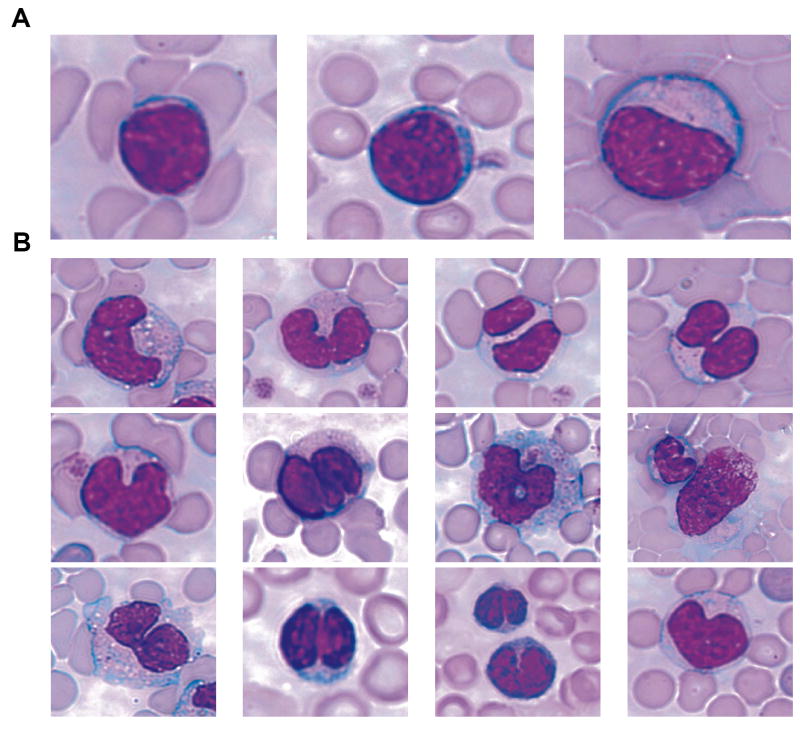
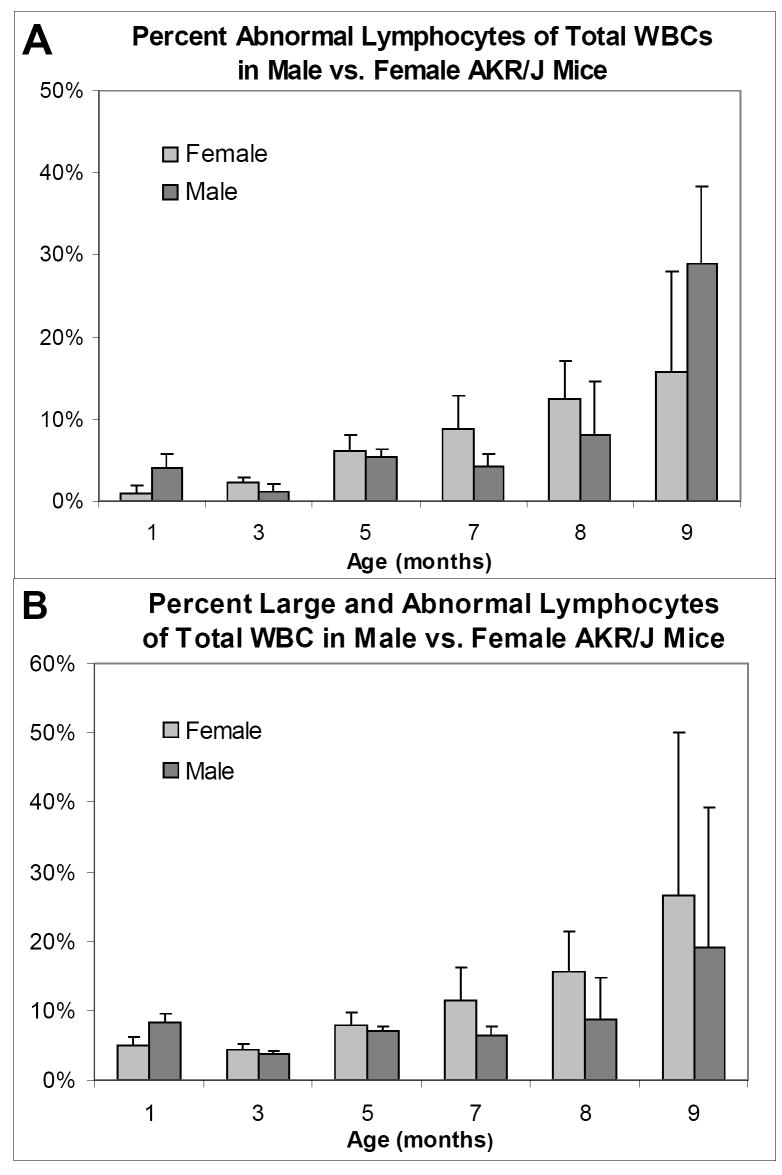
The major intent of the periodic clinical blood assays and tissue observations was to determine when each mouse developed lymphatic leukemia. Normal (Fig. 2A) and abnormal (Fig. 2B) lymphocytes could be clearly differentiated cytologically, thus, the onset of lymphatic leukemia in the AKR/J mouse was easily assessed. Normal lymphocytes had single well-rounded nuclei, while abnormal lymphocytes contained multi-lobed nuclei and/or multiple nuclei. Leukemogenesis in the AKR/J mouse thymus is initiated by the recombination of the germline proviral AKV retrovirus and a non-ecotropic MuLV. MCFV (mink cell focus virus) result from the recombination of the two germline viruses. The MCFV replicate in T cell lymphocytes and integrate into the T cell genome to disrupt key genes to induce leukemogenesis, and the T cells form the major population of cells in the thymus [11]. In the lymphoma and circulating T cells, numerous copies of the MCFV are found integrated in the T cell genome. We observed that the relative increase in abnormal lymphocyte numbers began at approximately 8 mo in the males and 5 to 7 months in the females (Fig. 3A, B). Once the abnormal lymphocytes began to appear in a given mouse, the mouse died in 2-3 wk.
Fig. 2.
Lymphocyte morphology. (A) Normal small (left panel), medium (middle panel), and large (right panel) lymphocytes with single well-rounded nuclei. (B) Examples of abnormal lymphocytes with multi-lobed and/or multiple nuclei.
Fig. 3.
Female AKR/J mice generally display leukemic symptoms earlier than do male AKR/J mice. Male and female AKR/J strain mice were compared to determine (A) percent of abnormal lymphocytes of total WBCs and (B) percent of abnormal and large lymphocytes of total WBCs.
The AKR/J mouse normally exhibits a short life span: 326 days for males and 276 days for females. We observed a similar phenomenon, in that the female mouse lived on average 7.5 months, whereas, the male lived an average of 8+ months (Table 1). As the number of abnormal lymphocytes began to increase, the mice exhibited lethargy and weight loss, high relative count of abnormal lymphocytes to WBCs (Fig. 3A), high relative count of abnormal plus large lymphocytes to WBCs (Fig. 3B), and at acute phase, a high ratio of lymphocytes to myeloid cells and to total WBCs (data not shown). The mice also exhibited a high total WBC count at acute phase, thymic lymphomas, high relative thymus weight, and high relative spleen weight. At termination in those mice that developed lymphatic leukemia, the spleen was approximately 5 times and the thymus approximately 10 times normal weight and size.
Table 1.
Lifespan of Male vs. Female AKR/J Mice
| Mouse | # Age of Death / Termination (mo) |
|---|---|
| Male 1 | 9* |
| Male 2 | 9* |
| Male 3 | 7 |
| Male 4 | 9* |
| Male 5 | 6.25 |
| Male 6 | 9* |
| Female 1 | 8.25 |
| Female 2 | 8.5 |
| Female 3 | 8 |
| Female 4 | 7.5 |
| Female 5 | 6.75 |
| Female 6 | 8 |
Male mice (n=6) survived an average 8+ mo; female mice (n=6) survived an average 7.8 mo.
Terminated at the end of the study.
Lymphatic leukemia predictor gene sets
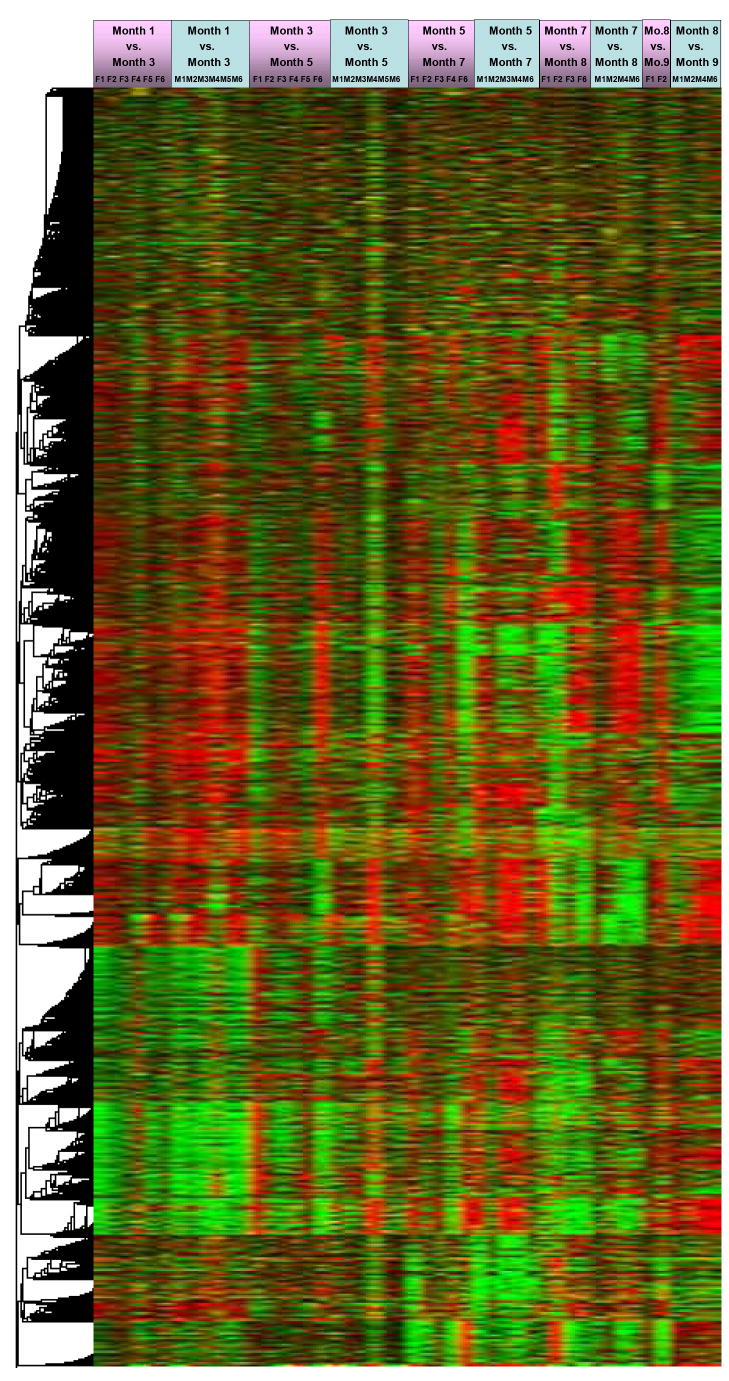
Demonstrating the predictive power of gene expression patterns for a disease process is the ultimate goal of most genomics research. The process of constructing gene-expression based predictor gene sets incorporates identifying groups of genes with expression patterns that are relevant for discriminating those mice that will develop the disease in question. Classifiers were constructed by using the data from all time points (Fig. 4). Such an analysis allowed us to generate gene sets that correlated mRNA levels to the development of lymphatic leukemia.
Fig. 4.
Heat map and hierarchal tree of > 8,000 significantly (p-value ≤ 0.05) changed genes in WBCs in response to lymphatic leukemia.
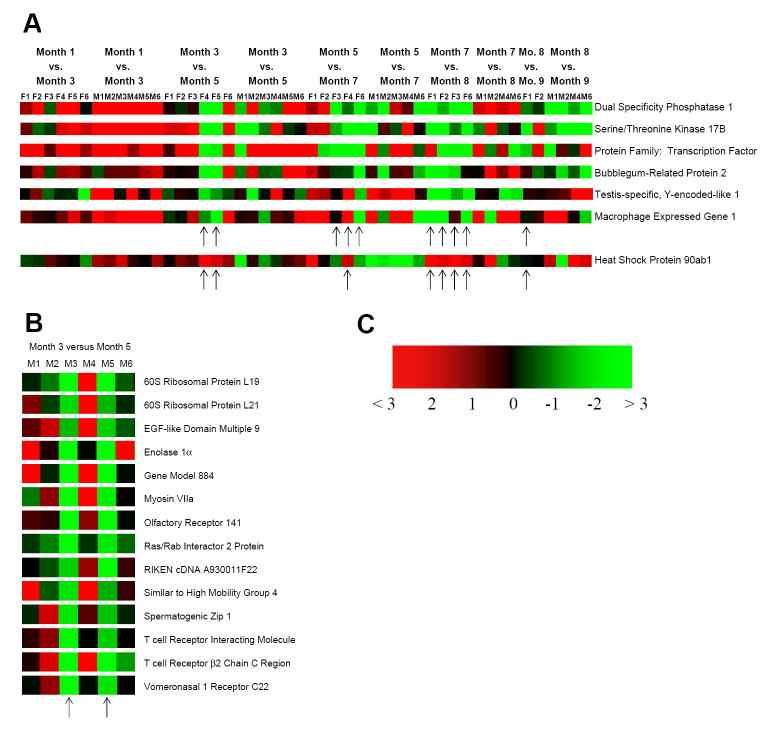
We made several observations from the results shown in Fig. 5, which show the classifier set of candidate disease predictor genes. First, differential gene expression clustered according to gender, which is not surprising given that gene expression profiles are quite dissimilar in all examined tissues of male and female mice [23]. There was relatively less overall difference in gene expression between the sexes at the early months followed by an increasing divergence over time. The increased divergence may be due to the random onset of leukemia from viral insertions in the later months of life in the AKR/J strain.
Fig. 5.
Gender-specific predictor gene sets for lymphatic leukemia in the AKR/J mouse. WBCs were collected from mice at 1, 3, 5, 7, 8, and 9 months of age. Heat maps (p-value ≤ 0.05) of those genes predicting the onset of lymphatic leukemia are shown for the female (F) AKR/J mice (A) and the male (M) AKR/J mice (B). The upward-pointing arrows denote the predictor genes displayed at the different ages for each mouse. The color gradient in (C) is an indicator of the relative mRNA levels in the heat map, in which green and red indicate lower and higher fold differences, respectively.
Second, the female AKR/J mice displayed an overall greater variability in gene expression over the time period examined than did the male mice. However, no hormonal association was found. The increased variability was probably due to the earlier onset of lymphatic leukemia in the female mouse relative to the male mouse. A total of seven predictor genes were identified that correlated to the different times of death for the female mice, of which six were predominately expressed at relatively lower levels over time, and one gene (Heat Shock Protein ab1) was expressed at primarily higher levels over time (Fig. 5A,C and Table 2). The female predictor genes were aberrantly expressed approximately 1 to 2 mo prior to the clinical detection of leukemia and death and are involved in regulating protein phosphorylation, the immune response, and inexplicably, spermatogenesis. For example, dysregulation of Notch signaling, a well-characterized cause of leukemia, regulates transcription of the MKP-1 (Dual specificity Phosphatase I) gene. Overexpression of Serine/Threonine Kinase 17B (Drak 2) leads to apoptosis of T cells and dysregulation of memory T cell development, whereas, Macrophage expressed gene 1 and Heat Shock Protein 90ab1 are involved in T cell maturation. Thus, not surprisingly, several of the predictor genes are involved in the immune response.
Table 2.
Potential predictor genes for lymphatic leukemia in the AKR/J mouse.
| Gender | Gene name | Gene ID |
|---|---|---|
| Females | Dual Specificity Phosphatase 1 (MKP-1) | 19252 |
| Serine/Threonine Phosphatase γ, Catalytic Subunit | 19047 | |
| Serine/Threonine Kinase 17B (Drak 2) | 98267 | |
| Testes Specific, Y-Encoded Protein-Like 1 | 22110 | |
| Protein Family: Transcription Factor | No ID | |
| Bubblegum-Related Protein 2 | 328845 | |
| Macrophage Expressed Gene 1 | 17476 | |
| Heat Shock Protein 90ab1 | 15516 | |
| Males | 60S Ribosomal Protein L19 | 381999 |
| 60S Ribosomal Protein L21 | 677463 | |
| EGF-like Domain Multiple 9 | 230316 | |
| Enolase 1α | 13806 | |
| Gene Model 884 | 380730 | |
| Myosin VIIa | 17921 | |
| Olfactory Receptor 141 | 257913 | |
| Ras/Rab Interactor 2 Protein | 74030 | |
| RIKEN cDNA A930011F22 | A930011F22 | |
| Similar to High Mobility Group 4 | 631505 | |
| Spermatogenic Zip 1 | 79401 | |
| T cell Receptor Interacting Molecule | 77647 | |
| T cell Receptor β2 Chain C Region | 665506 | |
| Vomeronasal 1 Receptor C22 | 171195 |
Third, in regard to the male mice, only two male mice had died of leukemia before the end of the 9-mo study (M5 at 6.25 mo and M3 at 7.0 mo), and it was this time period, the 3 vs. 5 mo comparison, that generated the 14 predictor genes shown in Fig. 5B,C and Table 2. Again, the predictor genes were aberrantly expressed approximately 1 to 2 mo prior to any clinical signs of leukemia and/or death. The remaining four male mice showed no outward signs of the disease, and one mouse, M2, showed little sign at the histological level at the time of sacrifice. All 14 predictor genes displayed a drop in relative levels over the 3 to 5-mo time period (arrows). Almost all of the 14 genes shared the common theme of being involved in G protein-related signaling and/or tumorigenesis. For example, ribosomal proteins L19 and L21 are diagnostic markers for prostate and breast cancer, respectively; and the transcription factor Spermatogenic Zip 1 is involved in mitogen-regulated cell proliferation, transformation, and tumorigenesis.
The study reported here had the shortcomings of a too small sample size and the potentially confounding result that the insertion of the MCFV in the mouse genome are at different selected sites in different T cell lineages within a given mouse and among the different mice [16]. Thus, for future studies, we intend to test our hypothesis on a non-blood disease using a larger sample size in order to determine whether different or canonical cellular pathways are affected. Nevertheless, we confirmed that AKR/J mice sporadically develop lymphatic leukemia at high incidence and that females are more susceptible to the disease than males. We showed that many genes are significantly differentially expressed over time in a gender-specific manner, and we generated gender-specific gene sets as predictors of leukemia that were expressed 1 to 2 mo prior to the clinical manifestations of leukemia and ultimately death. Thus, the AKR/J mouse is an efficacious model system for testing the predictive power of gene signatures for leukemia. Lastly, WBC signatures may be an effective method for early disease detection and is worthy of further study. WBC profiling requires only mildly invasive procedures and may be useful for identifying future disease victims such that preventative and therapeutic measures can be instituted.
Acknowledgments
The authors declare that there were no conflicts of interest. Funding was provided by NIH grant NIEHS P30 ES06096 as a pilot grant to C.R.T. and M.M. C.R.T. and M.M. designed the study, M.L.M. and K.L. collected the biological samples and clinical data, D.H. carried out the microarrays, M.M. and M.A.S. carried out the statistical analyses, and C.R.T. wrote the manuscript. The authors thank Saikumar Karyala and Rahul Mehrotra for their technical assistance.
Footnotes
Publisher's Disclaimer: This is a PDF file of an unedited manuscript that has been accepted for publication. As a service to our customers we are providing this early version of the manuscript. The manuscript will undergo copyediting, typesetting, and review of the resulting proof before it is published in its final citable form. Please note that during the production process errors may be discovered which could affect the content, and all legal disclaimers that apply to the journal pertain.
References
- 1.Sotiriou C, Wirapati P, Loi S, Harris A, Fox S, Smeds J, Nordgren H, Farmer P, Praz V, Haibe-Kains B, Desmedt C, Larsimont D, Cardoso F, Peterse H, Nuyten D, Buyse M, Van de Vijver MJ, Bergh J, Piccart M, Delorenzi M. Gene expression profiling in breast cancer: understanding the molecular basis of histologic grade to improve prognosis. J Natl Cancer Inst. 2006;98:262–272. doi: 10.1093/jnci/djj052. [DOI] [PubMed] [Google Scholar]
- 2.Golub TR, Slonim DK, Tamayo P, Huard C, Gaasenbeek M, Mesirov JP, Coller H, Loh ML, Downing JR, Caligiuri MA, Bloomfield CD, Lander ES. Molecular classification of cancer: class discovery and class prediction by gene expression monitoring. Science. 1999;286:531–537. doi: 10.1126/science.286.5439.531. [DOI] [PubMed] [Google Scholar]
- 3.Spentzos D, Levine DA, Kolia S, Otu H, Boyd J, Libermann TA, Cannistra SA. Unique gene expression profile based on pathologic response in epithelial ovarian cancer. J Clin Oncol. 2005;23:7911–7918. doi: 10.1200/JCO.2005.02.9363. [DOI] [PubMed] [Google Scholar]
- 4.de Visser KE, Eichten A, Coussens LM. Paradoxical roles of the immune system during cancer development. Nat Rev Cancer. 2006;6:24–37. doi: 10.1038/nrc1782. [DOI] [PubMed] [Google Scholar]
- 5.Burczynski ME, Dorner AJ. Transcriptional profiling of peripheral blood cells in clinical pharmacogenomic studies. Pharmacogenomics. 2006;7:187–202. doi: 10.2217/14622416.7.2.187. [DOI] [PubMed] [Google Scholar]
- 6.Mannick JA, Rodrick ML, Lederer JA. The immunologic response to injury. J Am Coll Surg. 2001;193:237–244. doi: 10.1016/s1072-7515(01)01011-0. [DOI] [PubMed] [Google Scholar]
- 7.Nussler AK, Wittel UA, Nussler NC, Beger HG. Leukocytes, the Janus cells in inflammatory disease. Langenbecks Arch Surg. 1999;384:222–232. doi: 10.1007/s004230050196. [DOI] [PubMed] [Google Scholar]
- 8.Coronella-Wood JA, Hersh EM. Naturally occurring B-cell responses to breast cancer. Cancer Immunol Immunother. 2003;52:715–738. doi: 10.1007/s00262-003-0409-4. [DOI] [PMC free article] [PubMed] [Google Scholar]
- 9.Disis ML, Pupa SM, Gralow JR, Dittadi R, Menard S, Cheever MA. High-titer HER-2/neu protein-specific antibody can be detected in patients with early-stage breast cancer. J Clin Oncol. 1997;15:3363–3367. doi: 10.1200/JCO.1997.15.11.3363. [DOI] [PubMed] [Google Scholar]
- 10.Herr W, Perlmutter AP, Gilbert W. Monoclonal AKR/J thymic leukemias contain multiple JH immunoglobulin gene rearrangements. Proc Natl Acad Sci U S A. 1983;80:7433–7436. doi: 10.1073/pnas.80.24.7433. [DOI] [PMC free article] [PubMed] [Google Scholar]
- 11.Herr W, Gilbert W. Free and integrated recombinant murine leukemia virus DNAs appear in preleukemic thymuses of AKR/J mice. J Virol. 1984;50:155–162. doi: 10.1128/jvi.50.1.155-162.1984. [DOI] [PMC free article] [PubMed] [Google Scholar]
- 12.Karpova GV, Fomina TI, Abramova EV, Bel’skaya NV, Trofimova ES, Perel’muter VM. Hemopoietic and lymphoid organs in AKR/JY mice with thymic lymphoma. Bull Exp Biol Med. 2002;134:69–72. doi: 10.1023/a:1020669007938. [DOI] [PubMed] [Google Scholar]
- 13.Reicin A, Yang JQ, Marcu KB, Fleissner E, Koehne CF, O’Donnell PV. Deregulation of the c-myc oncogene in virus-induced thymic lymphomas of AKR/J mice. Mol Cell Biol. 1986;6:4088–4092. doi: 10.1128/mcb.6.11.4088. [DOI] [PMC free article] [PubMed] [Google Scholar]
- 14.Hoag WG. Spontaneous Cancer in Mice. Ann N Y Acad Sci. 1963;108:805–831. doi: 10.1111/j.1749-6632.1963.tb13421.x. [DOI] [PubMed] [Google Scholar]
- 15.Festing MF, Blackmore DK. Life span of specified-pathogen-free (MRC category 4) mice and rats. Lab Anim. 1971;5:179–192. doi: 10.1258/002367771781006564. [DOI] [PubMed] [Google Scholar]
- 16.Morse HC, 3rd, Qi CF, Chattopadhyay SK, Hori M, Taddesse-Heath L, Ozato K, Hartley JW, Taylor BA, Ward JM, Jenkins NA, Copeland NG, Fredrickson TN. Combined histologic and molecular features reveal previously unappreciated subsets of lymphoma in AKXD recombinant inbred mice. Leuk Res. 2001;25:719–733. doi: 10.1016/s0145-2126(01)00022-4. [DOI] [PubMed] [Google Scholar]
- 17.Tomlinson CR, Karyala S, Halbleib D, Medvedovic M, Puga A. Toxicogenomics of Dioxin. In: Schena M, editor. DNA Microarrays: Methods Express. Scion Publishing, Ltd; Bloxham Mill, UK: 2007. [Google Scholar]
- 18.Guo J, Sartor M, Karyala S, Medvedovic M, Kann S, Puga A, Ryan P, Tomlinson CR. Expression of genes in the TGF-beta signaling pathway is significantly deregulated in smooth muscle cells from aorta of aryl hydrocarbon receptor knockout mice. Toxicol Appl Pharmacol. 2004;194:79–89. doi: 10.1016/j.taap.2003.09.002. [DOI] [PubMed] [Google Scholar]
- 19.Karyala S, Guo J, Sartor M, Medvedovic M, Kann S, Puga A, Ryan P, Tomlinson CR. Different global gene expression profiles in benzo[a]pyrene- and dioxin-treated vascular smooth muscle cells of AHR-knockout and wild-type mice. Cardiovasc Toxicol. 2004;4:47–73. doi: 10.1385/ct:4:1:47. [DOI] [PubMed] [Google Scholar]
- 20.Sartor M, Schwanekamp J, Halbleib D, Mohamed I, Karyala S, Medvedovic M, Tomlinson CR. Microarray results improve significantly as hybridization approaches equilibrium. Biotechniques. 2004;36:790–796. doi: 10.2144/04365ST02. [DOI] [PubMed] [Google Scholar]
- 21.Schwanekamp JA, Sartor MA, Karyala S, Halbleib D, Medvedovic M, Tomlinson CR. Genome-wide analyses show that nuclear and cytoplasmic RNA levels are differentially affected by dioxin. Biochim Biophys Acta. 2006;1759:388–402. doi: 10.1016/j.bbaexp.2006.07.005. [DOI] [PubMed] [Google Scholar]
- 22.Medvedovic M, Yeung KY, Bumgarner RE. Bayesian mixture model based clustering of replicated microarray data. Bioinformatics. 2004;20:1222–1232. doi: 10.1093/bioinformatics/bth068. [DOI] [PubMed] [Google Scholar]
- 23.Yang X, Schadt EE, Wang S, Wang H, Arnold AP, Ingram-Drake L, Drake TA, Lusis AJ. Tissue-specific expression and regulation of sexually dimorphic genes in mice. Genome Res. 2006;16:995–1004. doi: 10.1101/gr.5217506. [DOI] [PMC free article] [PubMed] [Google Scholar]


