

SUMMARY
Human immunodeficiency virus (HIV-1) can rapidly evolve due to selection pressures exerted by HIV-specific immune responses, antiviral agents, and to allow the virus to establish infection in different compartments in the body. Statistical models applied to HIV-1 sequence data can help to elucidate the nature of these selection pressures through comparisons of non-synonymous (or amino acid changing) and synonymous (or amino acid preserving) substitution rates. These models also need to take into account the non-independence of sequences due to their shared evolutionary history. We review how we have developed these methods and have applied them to characterize the evolution of HIV-1 in vivo.To illustrate our methods, we present an analysis of compartment-specific evolution of HIV-1 env in blood and cerebrospinal fluid and of site-to-site variation in the gag gene of subtype C HIV-1.
1. INTRODUCTION
Understanding the selective pressures that have shaped present day genetic variation is a primary goal in the study of evolutionary biology. As non-synonymous mutations can directly affect protein function, they are more likely to influence the fitness of an organism than mutations that leave the amino acid sequence unchanged (i.e. synonymous substitutions). Under negative or purifying selection, less ‘fit’ non-synonymous substitutions accumulate more slowly than synonymous substitutions, and under diversifying or positive selection, the converse is true. Hence, the comparison between relative rates of non-synonymous (often denoted as β) and synonymous (denoted as α) substitutions can provide information on the type of selection that has acted on a given set of protein-coding sequences. The ratio ω=β/α (also referred to as dN/dS or KA/KS) has become a standard measure of selective pressure [1]; ω≈1 signifies neutral evolution, ω<1 signifies negative selection, and ω>1 signifies positive selection.
Most often, we are interested in positive selection; this term encompasses several different evolutionary processes. Directional selection operating at a given position in a gene is manifested by concerted substitution towards a particular residue, which, given enough time, will result in a selective sweep. For example, when wild-type human immunodeficiency virus (HIV-1) infects a number of different patients receiving the same antiretroviral drug, there will be strong selective pressure on the virus to independently acquire those mutations that confer drug resistance. If one were to draw a sample from a drug-adapted viral population, the vast majority of circulating viruses would have fixed the resistance mutation, and there would be little or no remaining evidence of any selection having taken place. Of course, viral dynamics are rarely this simple [2]—for example, HIV-1 has the ability to ‘archive’ strains [3], and a wild-type virus could rapidly re-emerge if the treatment were discontinued. Diversifying selection, on the other hand, results from a selective regime whereby amino acid diversity at a given site is maintained. In HIV-1, this might occur at those codon positions that are the targets of host immune response. As immune systems in different hosts generally vary in their ability to recognize and target specific viral antigens, viruses in some hosts may be under selective pressure to evolve immune escape, while others may maintain wild-type residues.
The use of codon models of molecular evolution within a phylogenetic maximum likelihood framework allows us to answer the following questions using multiple sequence alignments of protein-coding sequences, while accounting for the non-independence of sequences that results from their shared evolutionary history:
Is there evidence of selection operating on a gene?
Is there variation in selection pressure across sites or regions in a gene?
At what point in the evolutionary past did selection occur?
What types of substitutions were selected for or against?
Are selective pressures different between genes/samples?
Development of these methods has often employed HIV-1 sequence data, due to the extremely large number of sequences that have been deposited in GenBank, and the high level of genetic variation in HIV-1, fueled by the combination of a high mutation rate [4], a short generation time [5–8], and a large number of productively infected cells within infected individuals [9, 10]. We give a brief overview of codon substitution models and how we have developed them in order to characterize the evolution of HIV-1 in vivo.
2. PHYLOGENETIC MODELS
The first tractable models for protein-coding sequences (codon models) were proposed independently by Goldman and Yang [11] (the GY94 model) and Muse and Gaut [12] (the MG94 model). The process of substituting a non-stop codon x, represented by a triplet of nucleotides x1x2x3, with another non-stop codon y = y1y2y3 over a time interval t≥0 is described by a continuous time, homogeneous, stationary, and time-reversible Markov process described by the transition matrix T(t), whose (i, j) entry contains the probability of replacing codon i with codon j over time interval t≥0. Stop codons are disallowed as evolutionary states since their random introduction in an active gene is overwhelmingly likely to destroy the function of the translated protein by truncating it. The (x, y) element for the infinitesimal generator of the most general MG94 (QMG94) model defines the instantaneous rate of replacing codon x with codon y (x ≠ y) along branch b (superscript) at site s (subscript):
Here, denotes the frequency of nucleotide n ∈{A,C, G, T } in codon position p = 1, 2, 3. For example, the synonymous ACG → ACT substitution involves the change G → T in the third codon position, and its corresponding rate is . Although these frequencies can be estimated by maximum likelihood, in most practical situations the observed frequencies are used, as this approximation (which is usually very good) saves computational time. θmn corrects for the nucleotide substitution bias, and because of time reversibility θmn = θnm. Time reversibility can be relaxed in cases when it is unlikely to hold, for example, serially sampled data under strong directional selection [13]. The vast majority of published studies assume time reversibility. In the simplest case, all θmn = 1, reducing to the original MG94 model, and in the most general, six rates can be specified. However, because the likelihood function depends only on products of rates and evolutionary times qxyt, only five of those can be estimated; hence, we arbitrarily set one of the rates (we choose θAG) to one, and all other nucleotide rates are estimated relative to the θAG rate. Diagonal entries of the rate matrix are defined by , ensuring that each row of the transition matrix T(t) forms a valid probability distribution.
The model assumes that point mutations alter one nucleotide at a time; hence, most of the instantaneous rates ( or 84.2 per cent in the case of the universal genetic code with 61 non-stop codons) are 0. This restriction does not imply that the model disallows substitutions that involve multiple nucleotides (e.g. ACT → AGG), rather that such substitutions must be realized via several consecutive single nucleotide steps (cf. [14]).
Stationary codon frequencies for the MG94 model parameterized as above are given by
and include nine estimable parameters. In the original paper that described the MG94 model [12], nucleotide frequencies were pooled from all three codon positions, i.e. for all four nucleotides, yielding three frequency parameters. A variant of Felsenstein's pruning algorithm [15] is used to efficiently evaluate the likelihood function for a given vector of model parameters. Independent parameters are adjusted using a numerical multidimensional optimization algorithm to obtain maximum likelihood estimates. Standard statistical techniques such as profile likelihood and the empirical variance—covariance matrix can be used to evaluate sampling errors in parameter estimates.
In general, synonymous (α) and non-synonymous (β) rates will depend on both the alignment site (s) and the branch of the tree (b), as denoted by the subscript/superscript. We describe how such models can be used to infer when selection occurred in the evolutionary history of a sample of sequences and the strength of selection pressures on individual regions or sites. Although there is no biological reason to assume that the selective pressures are the same for any two branches or any two sites, the need to estimate these quantities from finite data demands that we consider simplified models.
3. VARIATION IN SELECTION PRESSURES ACROSS THE PHYLOGENY
As selection pressures almost certainly fluctuate over time, it may be unreasonable to use models that assume a constant selective pressure for all branches in the phylogenetic tree. The most general model allows a separate ω in every branch of the tree (the local model or free-ratio model). Other possibilities are the (global single-ratio) model, which posits the same ω for all branches and a large array of intermediate complexity models, where some branches are assigned to one of several classes, with all branches within a single class sharing one ω value. Formally, this model can be described as
where I(b) is the assignment of branch b to an ω class. For the global model I(b) = 1, and for the local model I(b) = b.
A naïve approach to= test for branch-to-branch rate variation is to fit the global model as H0,the local model as HA, and declare that there is evidence of branch-by-branch rate heterogeneity if H0 can be rejected. Because the models are nested, one can use a likelihood ratio test with B — 1 (B is the total number of branches in the tree) degrees of freedom. This procedure, however, may lack power if only a few branches in a large tree are under strong selective pressure and may also lack specificity, in that the real question a biologist may wish to ask is ‘Where in the tree did selection occur?’ and not ‘Did selection occur somewhere in the tree?’.
The first likelihood-based procedure for identifying different selective regimes on tree branches [16] relied on a priori specification of some branches of interest. For example, if a branch separates taxa from different evolutionary environments (e.g. virus in different hosts), one may be interested in studying the strength of selection on that branch. The a priori branch model separates all B branches into a few (F << B) of interest (foreground), for which the ω parameter is estimated individually, and all other branches (background), which share a common ωb. To test for significance, one conducts a likelihood ratio test with F degrees of freedom. This analysis boosts the detection power, because the number of model parameters is significantly reduced, and focuses on specific branches. The main drawback of such a test is that it assumes that the rest of the branches have a uniform selective pressure. This assumption is less likely to hold as the number of taxa (and tree branches) is increased, and the model can be easily misled into claiming selection on a ‘foreground’ branch if the background is strongly non-uniform. A test that is more robust to a non-uniform background may be as follows: to decide whether a given branch b0 is under positive selection (i.e. has ωb0 > 1), one fits H0 : ωb0 ≤ 1and HA : ωb0 is unconstrained, allowing all other branches to have their own ω and conducts an LRT. This is a one-sided test, and the appropriate distribution of the LR test statistic to check against is a 50−50 mixture of and a point mass at 0 [17].
In many instances, there may exist no a priori evidence to suspect selection at a specific branch in the tree. As the model of rate variation is a nuisance parameter in this case, we advocate the idea of searching the space of many possible models, selecting those that fit well, and averaging over models to achieve robust inference. For full details of the methods, we refer the reader to [18], but the basic idea is intuitive. Let us consider models with up to C different ω assigned to branches. A model like this is completely specified by assigning each branch in a phylogenetic tree to one of the C classes, with the total number of models on B branches given by the Stirling numbers of the second kind, the number of unique ways to assign B objects to C bins:
The number of models grows combinatorially fast with B, even if C is small. The models considered during the search will not necessarily be nested; hence, a new model comparison technique is called for. We chose a small sample or corrected Akaike information criterion (AICc) score [19] of each model, which is defined as
where L is the maximum log-likelihood score of the model, p is the number of model parameters, and s is the number of independent samples available for inference (conservatively—the number of sites in an alignment). AICc rewards a model for a good likelihood score and penalizes it for the number of parameters, progressively more so as the number of parameters approaches the number of independent samples. AICc estimates the expected Kullback—Liebler divergence between model M and the true model that generated the data; hence, minimizing this score improves the goodness of fit, and there exist fundamental results supporting its use.
We have used a genetic algorithm (GA) to search the space of possible models, measuring the fitness of each by its AICc score. GAs are a powerful family of optimization techniques and have proven to be very adept at rapidly finding good solutions in complex, poorly understood optimization problems (see [20] for a review). A typical GA encodes a number of possible solutions to the problem at hand (population) as binary strings (genomes) and mimics naturally evolving populations, by generating new possible solutions from existing ones using random mutation and recombination to combine bit vectors of two parents, chosen in proportion to their relative fitness, to form offspring. As an added benefit, the availability of AICc scores allows one to compute Akaike weights for each model, defined as pM = exp[(minM AICc(M) – AICc(M))/2], normalized to sum to one. pM can be interpreted as the probability that model M is the best (in the Kullback—Liebler divergence sense) of all those considered, given the data. Now, instead of basing inference solely on the best fitting model, one can compute the model averaged probability of finding βb>αb for every branch in the tree.
3.1. Selection and compartmentalization of HIV-1
Figure 1 shows a phylogeny of full-length envelope sequences isolated from blood plasma and from cerebrospinal fluid from a chronically HIV-infected individual, which shows clustering of sequences by compartment. To test whether positive selection was associated with the divergence between plasma and CSF virus, we estimated the ratio of non-synonymous and synonymous substitution rates (ωb), for each branch b in the phylogeny under the local model. Next, by placing constraints on the parameters, we estimated ω within plasma sequences (denoted as ωP), within CSF sequences (denoted as ωC), and between CSF and plasma sequences (denoted ωB) (Table I). While this ‘within/between’ model was not significantly worse than the local model (LRT p = 0.13), it fitted significantly better (p = 0.0002) than the global model that assumed a uniform ωb throughout the tree. Consequently, selective pressures have varied throughout the tree, but there is insufficient data/variability in ω to warrant the estimation of individual ωb for every branch. A GA model selection procedure identified the best fitting model with five rates (Table I). For the branch separating plasma and CSF sequences, ωB = 1.7 and the Akaike weight support of 0.995 for ωB > 1 were estimated by model averaging. These results not only strongly support positive selection between compartments but also suggest that variable selective pressures continue to operate within each compartment.
Figure 1.
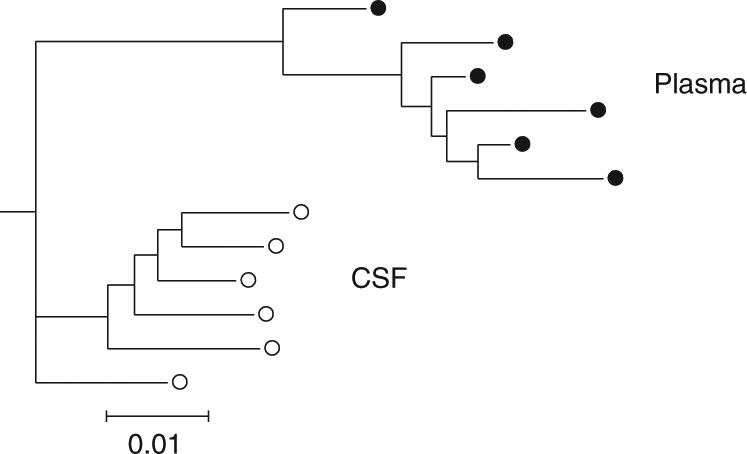
A neighbor joining [21] phylogeny of full-length envelope sequences isolated from plasma (filled circles) and CSF (open circles). Branch lengths, expressed in expected substitutions per nucleotide site, were estimated with the MG94×HKY85 model and beta—gamma rates [22].
Table I.
Estimates of non-synonymous to synonymous substitution rates for plasma sequences, ωP, CSF sequences, ωC, and between plasma and CSF sequences, ωB, under different evolutionary models.
| Model | log L | Parameters | AICC | ωP | ωC | ωB |
|---|---|---|---|---|---|---|
| Local | −6044.3 | 53 | 12194.6 | n/a | n/a | 1.9630 |
| GA | −6045.2 | 37 | 12164.4 | n/a | n/a | 1.7 |
| Within/between | −6057.3 | 34 | 12183.4 | 0.52 | 0.43 | 2.12 |
| Global | −6065.6 | 33 | 12197.2 | 0.55 | 0.55 | 0.55 |
For the GA model where a GA determines the optimal number of rate classes and allocates rate classes to branches, the model averaged ωB is given.
4. VARIATION IN SELECTION PRESSURES ACROSS SITES
Sites in an alignment often evolve at different rates due to many biological factors that include site-specific mutation rates, functional constraints on amino acid substitutions, and positive selection for rapid change in amino acids. Early work in this area focused on nucleotide models [23], but as computational power has become more widely available, rate variation is now often considered in the context of codon models.
Previously [24], we reviewed existing approaches to model site-specific variation in codon substitution rates and developed several extensions and new methods. Single likelihood ancestor counting (SLAC) can rapidly estimate the number of non-synonymous and synonymous substitutions that occurred at each codon in an alignment, by reconstructing the most likely ancestral sequences and counting substitutions using a weighting scheme. Suzuki and Gojobori [25] proposed a similar approach; however, their implementation suffered from a number of avoidable shortcomings, including the use of nucleotide-level parsimony to reconstruct unobserved ancestral states and the reliance on overly simplistic models to estimate branch lengths in a phylogeny [24, 26]. Weighted ancestor counting is an extension of SLAC, which takes into account the uncertainty in ancestral reconstruction by weighting the contribution of each possible ancestral state in accordance with its relative likelihood under the fitted substitution model. Fixed effects likelihood involves fitting a model in which the non-synonymous and synonymous substitution rates are estimated on a site-by-site basis. Massingham and Goldman [27] proposed a similar method but assumed a constant synonymous substitution rate across all sites, an assumption that is violated in many cases [26].
The third approach—random effects likelihood—is based on allowing some of the model parameters to be random quantities [1, 28]. Formally, the parameter space is partitioned into a deterministic (estimable) component ΘD (e.g. branch lengths and hyperparameters defining the distribution of substitution rates across sites) and a random (integrated) component ΘR (e.g. the substitution rates at each site), and the likelihood function becomes L(Θ) = EΘR L(ΘD|ΘR). Commonly, the random component is modeled by discrete-valued variables or by discretized continuous distributions (e.g. the gamma distribution), and the expectation can be computed efficiently as the sum of a small number of conditional probabilities [23]. Huelsenbeck and Dyer [29] used a hierarchical Bayes approach, taking into account uncertainty in model parameters, branch lengths, and tree topologies. Our implementation allows both non-synonymous and synonymous substitution rates to vary across sites; there is strong evidence for variation in synonymous substitution rates in many organisms, including HIV-1 [24, 26]. Random effects models are attractive, as they pool information across sites, gaining power to estimate rates, but they also often ‘smooth’ rates towards the mean and require a pre-specified distribution of rates across sites. Nielsen and his colleagues [1, 30] proposed a large number of ad hoc parametric models, although in practice many researchers have adopted the ‘M7’ (ω is distributed according to a beta distribution) and ‘M8’ (the mixture of a beta distribution and a point mass) models. However, as there is little or no justification for a specific parametric form for the distribution of rates, we advocate the fitting of a simple, yet flexible ‘beta—gamma’ distribution (encoded by only three parameters) in the frequentist context [22] or the use of a Dirichlet process prior [31] in the Bayesian context.
4.1. Estimating variation in selection pressure in the presence of recombination
Methods for quantifying selection pressure on codon alignments may suffer from high rates of false positives when the sequences being analyzed have undergone recombination [32–34]. This is intuitively clear, since the evolution of homologous recombinant sequences must be modeled by several phylogenies, one for each non-recombinant fragment in the alignment. HIV-1 can recombine at a rate that exceeds the point mutation rate [35]; hence, it is important to screen for and quantify evidence of recombination in HIV-1 sequences. To allow estimation of substitution rate variation in the presence of recombination, we have developed a framework that uses a GA (GARD [34]) to rapidly search the space of models that encode all possible locations of N breakpoints in a multiple sequence alignment for those which have low AICc scores. Additionally, GARD quantifies the level of support for having a breakpoint at a given position in the sequence and helps to identify sequences or clades involved in putative recombination events. Once this procedure has been performed, the methods described above can be applied to each non-recombinant fragment identified, perhaps constraining some parameters (e.g. nucleotide substitution rates) to be the same across all fragments, a simplification easily tested through likelihood ratio tests [36].
We demonstrate the procedure on an alignment of 40 subtype C HIV-1 sequences encoding the structural polyprotein (gag) sampled from drug naïve subjects in Botswana [37]. Even in this relatively short region of the HIV-1 genome, there was strong statistical support for two recombination breakpoints; AICc was 23 631.6, 23 255.1, and 23 213.5 for 0 (i.e. no recombination), 1, and 2 breakpoints, respectively. While site-specific estimates of dN—dS obtained using SLAC were very similar with and without the assumption of multiple trees, a minority of sites had very different estimates (Figure 2); for example, SLAC identified five positively selected sites (p≤0.05) under each model, but only three of them were in common. Given the tendency for many studies to give detailed biological interpretations for each and every site identified as being under positive selection, the need to accommodate recombination in analyses of selection pressure is clear.
Figure 2.
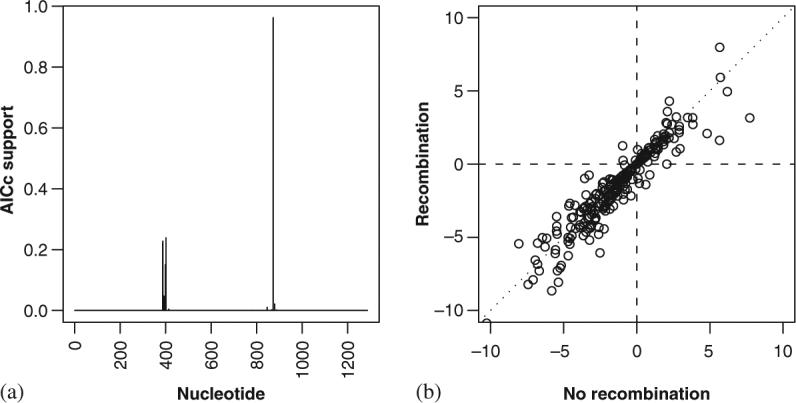
Recombination and its effect on estimates of site-specific selection pressures in a sample of 40 subtype C gag genes: (a) model-averaged support (based on AICc-derived Akaike weights) for two recombination breakpoints and (b) dN—dS under a model assuming three trees per alignment (i.e. recombination) against a model assuming a single tree (i.e. no recombination).
5. CONCLUSIONS
While the codon models discussed represent the current state of the art, it is important to remember that they still make many simplifying assumptions. Perhaps the most important one is that sites evolve independently from one another. While ‘covarion’ models of codon substitution have been formulated and applied to HIV-1 [38], strictly speaking, these models simply allow the substitution rate to vary over time stochastically. Recently, models have been proposed that explicitly consider interactions between sites [39, 40], and the development and application of these types of models to HIV-1 is an area of active research. We have developed similar models to explore the dependency of evolutionary rates at different potential N-linked glycosylation sites in HIV-1 envelope [41].
Despite several attempts to modify codon models to allow for varying rates of non-synonymous substitution depending on the residues involved, the models commonly used in practice 11, 12 assume that all non-synonymous substitutions occur at the same rate. Yet we cannot feasibly examine all codon models with 1 < C < 75 classes of amino acid replacements (non-synonymous codon pairs which differ in a single nucleotide encode possible amino acid pairs), as there are an extremely large number of such models. To alleviate this problem, previous studies have classified amino acids based on similar physicochemical properties and then have estimated transition rates within and between a small number of amino acid classes [42, 43]. Although such models may fit better than those assuming a single rate between all amino acids, the a priori classification of amino acid substitutions into groups may be inappropriate for the data set at hand. GAs or other model selection procedures may prove to be useful in this context, as they have for the evolutionary models of paired RNA sequences [44].
Although we have focussed on approaches that estimate the rates of substitutions along a phylogeny (or in the case of recombination, multiple phylogenies), they are not ideally suited to study certain kinds of positive selection. As such models do not explicitly incorporate allele frequency information, they may perform poorly in detecting frequency- dependent (the strength and nature of selection will depend on the distribution of allelic variants in the population) or directional (homogenizing the entire population towards a novel, more fit variant) selection. Mayer-Hamblett and Self [45] proposed a method in which parameters are defined for describing genetic variation within and between viral populations by generalizing Simpson's index of diversity, regression models are specified for these variation parameters, and a generalized estimating equation framework is used for estimating both the regression parameters and their corresponding variances. An alternative to regression-type approaches is offered by models that explicitly consider (often simple) population genetics models. For example, Williamson 46 adapted an estimator originally used by Smith and Eyre-Walker [47] to approximate the number of adaptive changes in partial sequences of the HIV-1 env [gene] in infected individuals over time, by contrasting patterns of non-synonymous and synonymous divergence and polymorphism.
In conclusion, we have presented a number of techniques to assist in the analysis and interpretation of evolutionary pressures on HIV-1 sequences, which allow for variable selection pressures over time and across the sequence, while controlling for the potentially confounding effects of recombination and variable synonymous substitution rates across the sequence. Despite being developed with HIV-1 data sets in mind, our methods are applicable to any coding sequence in any organism. We have also striven to make these methods widely available and have implemented them as part of a free standalone software package, HyPhy, and a web application, Datamonkey [48].
ACKNOWLEDGEMENTS
We would like to thank the National Institutes of Health and the San Diego Veterans Affairs Healthcare System for funding this research and two anonymous reviewers for helpful comments.
Contract/grant sponsor: National Institutes of Health; contract/grant numbers: AI27670, AI29164, AI36214, AI43638, AI47745, AI55276, AI57167, MH58076, MH62512, NS51132, U01AI38858
Contract/grant sponsor: San Diego Veterans Affairs Healthcare System
REFERENCES
- 1.Nielsen R, Yang ZH. Likelihood models for detecting positively selected amino acid sites and applications to the HIV-1 envelope gene. Genetics. 1998;148:929–936. doi: 10.1093/genetics/148.3.929. [DOI] [PMC free article] [PubMed] [Google Scholar]
- 2.Richman DD, Little SJ, Smith DM, Wrin T, Petropoulos C, Wong JK. HIV evolution and escape. Transactions of the American Clinical and Climatological Association. 2004;115:289–303. [PMC free article] [PubMed] [Google Scholar]
- 3.Bailey JR, Sedaghat AR, Kieffer T, Brennan T, Lee PK, Wind-Rotolo M, Haggerty CM, Kamireddi AR, Liu Y, Lee J, Persaud D, Gallant JE, Cofrancesco JJ, Quinn TC, Wilke CO, Ray SC, Siliciano JD, Nettles RE, Siliciano RF. Residual human immunodeficiency virus type 1 viremia in some patients on antiretroviral therapy is dominated by a small number of invariant clones rarely found in circulating CD4+T cells. Journal of Virology. 2006;80:6441–6457. doi: 10.1128/JVI.00591-06. [DOI] [PMC free article] [PubMed] [Google Scholar]
- 4.Mansky LM, Temin HM. Lower in-vivo mutation-rate of human-immunodeficiency-virus type-1 than that predicted from the fidelity of purified reverse-transcriptase. Journal of Virology. 1995;69:5087–5094. doi: 10.1128/jvi.69.8.5087-5094.1995. [DOI] [PMC free article] [PubMed] [Google Scholar]
- 5.Ho DD, Neumann AU, Perelson AS, Chen W, Leonard JM, Markowitz M. Rapid turnover of plasma virions and CD4 lymphocytes in HIV-1 infection. Nature. 1995;373:123–126. doi: 10.1038/373123a0. [DOI] [PubMed] [Google Scholar]
- 6.Wei X, Ghosh SK, Taylor ME, Johnson VA, Emini EA, Deutsch P, Lifson JD, Bonhoeffer S, Nowak MA, Hahn BH, Saag MS, Shaw GM. Viral dynamics in human immunodeficiency virus type 1 infection. Nature. 1995;373:117–122. doi: 10.1038/373117a0. [DOI] [PubMed] [Google Scholar]
- 7.Perelson AS, Neumann AU, Markowitz M, Leonard JM, Ho DD. HIV-1 dynamics in vivo: virion clearance rate, infected cell life-span, and viral generation time. Science. 1996;271:1582–1586. doi: 10.1126/science.271.5255.1582. [DOI] [PubMed] [Google Scholar]
- 8.Perelson AS, Essunger P, Cao Y, Vesanen M, Hurley A, Saksela K, Markowitz M, Ho DD. Decay characteristics of HIV-1-infected compartments during combination therapy. Nature. 1997;387:188–191. doi: 10.1038/387188a0. [DOI] [PubMed] [Google Scholar]
- 9.Pantaleo G, Graziosi C, Demarest JF, Butini L, Montroni M, Fox CH, Orenstein JM, Kotler DP, Fauci AS. HIV infection is active and progressive in lymphoid tissue during the clinically latent stage of disease. Nature. 1993;362:355–358. doi: 10.1038/362355a0. [DOI] [PubMed] [Google Scholar]
- 10.Embretson J, Zupancic M, Ribas JL, Burke A, Racz P, Tenner-Racz K, Haase AT. Massive covert infection of helper T lymphocytes and macrophages by HIV during the incubation period of aids. Nature. 1993;362:359–362. doi: 10.1038/362359a0. [DOI] [PubMed] [Google Scholar]
- 11.Goldman N, Yang Z. A codon-based model of nucleotide substitution for protein-coding DNA sequences. Molecular Biology and Evolution. 1994;11:725–736. doi: 10.1093/oxfordjournals.molbev.a040153. [DOI] [PubMed] [Google Scholar]
- 12.Muse SV, Gaut BS. A likelihood approach for comparing synonymous and nonsynonymous nucleotide substitution rates, with application to the chloroplast genome. Molecular Biology and Evolution. 1994;11:715–724. doi: 10.1093/oxfordjournals.molbev.a040152. [DOI] [PubMed] [Google Scholar]
- 13.Seoighe C, Ketwaroo F, Pillay V, Scheffler K, Wood N, Duffet R, Zvelebil M, Martinson N, McIntyre J, Morris L, Hide W. A model of directional selection applied to the evolution of drug resistance in HIV-1. Molecular Biology and Evolution. 2007;24:1025–1031. doi: 10.1093/molbev/msm021. [DOI] [PubMed] [Google Scholar]
- 14.Whelan S, Goldman N. Estimating the frequency of events that cause multiple-nucleotide changes. Genetics. 2004;167:2027–2043. doi: 10.1534/genetics.103.023226. [DOI] [PMC free article] [PubMed] [Google Scholar]
- 15.Felsenstein J. Evolutionary trees from DNA-sequences—a maximum-likelihood approach. Journal of Molecular Evolution. 1981;17:368–376. doi: 10.1007/BF01734359. [DOI] [PubMed] [Google Scholar]
- 16.Yang Z. Likelihood ratio tests for detecting positive selection and application to primate lysozyme evolution. Molecular Biology and Evolution. 1998;15:568–573. doi: 10.1093/oxfordjournals.molbev.a025957. [DOI] [PubMed] [Google Scholar]
- 17.Self S, Liang K-Y. Asymptotic properties of maximum likelihood estimators and likelihood ratio tests under nonstandard conditions. Journal of the American Statistical Association. 1987;82:605–610. [Google Scholar]
- 18.Kosakovsky Pond SL, Frost SDW. A genetic algorithm approach to detecting lineage-specific variation in selection pressure. Molecular Biology and Evolution. 2005;22:478–485. doi: 10.1093/molbev/msi031. [DOI] [PubMed] [Google Scholar]
- 19.Sugiura N. Further analysis of the data by Akaike's information criterion and the finite corrections. Communications in Statistics—Theory and Methods. 1978;A7:13–26. [Google Scholar]
- 20.Whitley D. An overview of evolutionary algorithms: practical issues and common pitfalls. Information and Software Technology. 2001;43:817–831. [Google Scholar]
- 21.Saitou N, Nei M. The neighbor-joining method—a new method for reconstructing phylogenetic trees. Molecular Biology and Evolution. 1987;4:406–425. doi: 10.1093/oxfordjournals.molbev.a040454. [DOI] [PubMed] [Google Scholar]
- 22.Kosakovsky Pond SL, Frost S. A simple hierarchical approach to modeling distributions of substitution rates. Molecular Biology and Evolution. 2005;22:223–234. doi: 10.1093/molbev/msi009. [DOI] [PubMed] [Google Scholar]
- 23.Yang ZH. Among-site rate variation and its impact on phylogenetic analyses. Trends in Ecology and Evolution. 1996;11:367–372. doi: 10.1016/0169-5347(96)10041-0. [DOI] [PubMed] [Google Scholar]
- 24.Kosakovsky Pond SL, Frost S. Not so different after all: a comparison of methods for detecting amino-acid sites under selection. Molecular Biology and Evolution. 2005;22:1208–1222. doi: 10.1093/molbev/msi105. [DOI] [PubMed] [Google Scholar]
- 25.Suzuki Y, Gojobori T. A method for detecting positive selection at single amino acid sites. Molecular Biology and Evolution. 1999;16:1315–1328. doi: 10.1093/oxfordjournals.molbev.a026042. [DOI] [PubMed] [Google Scholar]
- 26.Kosakovsky Pond SL, Muse SV. Site-to-site variation of synonymous substitution rates. Molecular Biology and Evolution. 2005;22:2375–2385. doi: 10.1093/molbev/msi232. [DOI] [PubMed] [Google Scholar]
- 27.Massingham T, Goldman N. Detecting amino acid sites under positive selection and purifying selection. Genetics. 2005;169:1753–1762. doi: 10.1534/genetics.104.032144. [DOI] [PMC free article] [PubMed] [Google Scholar]
- 28.Yang Z. Maximum-likelihood estimation of phylogeny from DNA sequences when substitution rates differ over sites. Molecular Biology and Evolution. 1993;10:1396–1401. doi: 10.1093/oxfordjournals.molbev.a040082. [DOI] [PubMed] [Google Scholar]
- 29.Huelsenbeck JP, Dyer KA. Bayesian estimation of positively selected sites. Journal of Molecular Evolution. 2004;58:661–672. doi: 10.1007/s00239-004-2588-9. [DOI] [PubMed] [Google Scholar]
- 30.Yang Z, Nielsen R, Goldman N, Pedersen AM. Codon-substitution models for heterogeneous selection pressure at amino acid sites. Genetics. 2000;155:431–449. doi: 10.1093/genetics/155.1.431. [DOI] [PMC free article] [PubMed] [Google Scholar]
- 31.Huelsenbeck JP, Jain S, Frost SWD, Kosakovsky Pond SL. A Dirichlet process model for detecting positive selection in protein-coding DNA sequences. Proceedings of the National Academy of Sciences of USA. 2006;103:6263–6268. doi: 10.1073/pnas.0508279103. [DOI] [PMC free article] [PubMed] [Google Scholar]
- 32.Shriner D, Nickle DC, Jensen MA, Mullins JI. Potential impact of recombination on sitewise approaches for detecting positive natural selection. Genetical Research. 2003;81:115–121. doi: 10.1017/s0016672303006128. [DOI] [PubMed] [Google Scholar]
- 33.Anisimova M, Nielsen R, Yang ZH. Effect of recombination on the accuracy of the likelihood method for detecting positive selection at amino acid sites. Genetics. 2003;164:1229–1236. doi: 10.1093/genetics/164.3.1229. [DOI] [PMC free article] [PubMed] [Google Scholar]
- 34.Kosakovsky Pond SL, Posada D, Gravenor MB, Woelk CH, Frost SD. Automated phylogenetic detection of recombination using a genetic algorithm. Molecular Biology and Evolution. 2006;23:1891–1901. doi: 10.1093/molbev/msl051. [DOI] [PubMed] [Google Scholar]
- 35.Zhuang J, Jetzt AE, Sun G, Yu H, Klarmann G, Ron Y, Preston BD, Dougherty JP. Human immunodeficiency virus type 1 recombination: rate, fidelity, and putative hot spots. Journal of Virology. 2002;76:11 273–11 282. doi: 10.1128/JVI.76.22.11273-11282.2002. [DOI] [PMC free article] [PubMed] [Google Scholar]
- 36.Scheffler K, Martin DP, Seoighe C. Robust inference of positive selection from recombining coding sequences. Bioinformatics. 2006;22:2493–2499. doi: 10.1093/bioinformatics/btl427. [DOI] [PubMed] [Google Scholar]
- 37.Novitsky V, Smith UR, Gilbert P, McLane MF, Chigwedere P, Williamson C, Ndung'u T, Klein I, Chang SY, Peter T, Thior I, Foley BT, Gaolekwe S, Rybak N, Gaseitsiwe S, Vannberg F, Marlink R, Lee TH, Essex M. Human immunodeficiency virus type 1 subtype C molecular phylogeny: consensus sequence for an AIDS vaccine design? Journal of Virology. 2002;76:5435–5451. doi: 10.1128/JVI.76.11.5435-5451.2002. [DOI] [PMC free article] [PubMed] [Google Scholar]
- 38.Guindon S, Rodrigo AG, Dyer KA, Huelsenbeck JP. Modeling the site-specific variation of selection patterns along lineages. Proceedings of the National Academy of Sciences of USA. 2004;101:12 957–12 962. doi: 10.1073/pnas.0402177101. [DOI] [PMC free article] [PubMed] [Google Scholar]
- 39.Robinson DM, Jones DT, Kishino H, Goldman N, Thorne JL. Protein evolution with dependence among codons due to tertiary structure. Molecular Biology and Evolution. 2003;20:1692–1704. doi: 10.1093/molbev/msg184. [DOI] [PubMed] [Google Scholar]
- 40.Rodrigue N, Lartillot N, Bryant D, Philippe H. Site interdependence attributed to tertiary structure in amino acid sequence evolution. Gene. 2005;347:207–217. doi: 10.1016/j.gene.2004.12.011. [DOI] [PubMed] [Google Scholar]
- 41.Poon AFY, Lewis FI, Kosakovsky Pond SL, Frost SDW. Detection of N-linked glycan interactions by phylogenetic and Bayesian network analysis of HIV-1 envelope sequences. PLoS Computational Biology. 2007;3:e11. [Google Scholar]
- 42.Yang Z, Nielsen R, Hasegawa M. Models of amino acid substitution and applications to mitochondrial protein evolution. Molecular Biology and Evolution. 1998;15:1600–1611. doi: 10.1093/oxfordjournals.molbev.a025888. [DOI] [PubMed] [Google Scholar]
- 43.Schadt E, Lange K. Codon and rate variation models in molecular phylogeny. Molecular Biology and Evolution. 2002;19:1534–1549. doi: 10.1093/oxfordjournals.molbev.a004216. [DOI] [PubMed] [Google Scholar]
- 44.Kosakovsky Pond SL, Mannino FV, Gravenor MB, Muse SV, Frost SDW. Evolutionary model selection with a genetic algorithm: a case study using stem RNA. Molecular Biology and Evolution. 2007;24:159–170. doi: 10.1093/molbev/msl144. [DOI] [PubMed] [Google Scholar]
- 45.Mayer-Hamblett N, Self S. A regression modeling approach for describing patterns of HIV genetic variation. Biometrics. 2001;57:449–460. doi: 10.1111/j.0006-341x.2001.00449.x. [DOI] [PubMed] [Google Scholar]
- 46.Williamson S. Adaptation in the env gene of HIV-1 and evolutionary theories of disease progression. Molecular Biology and Evolution. 2003;20:1318–1325. doi: 10.1093/molbev/msg144. [DOI] [PubMed] [Google Scholar]
- 47.Smith NGC, Eyre-Walker A. Adaptive protein evolution in drosophila. Nature. 2002;415:1022–1024. doi: 10.1038/4151022a. [DOI] [PubMed] [Google Scholar]
- 48.Kosakovsky Pond SL, Frost SDW. Datamonkey: rapid detection of selective pressure on individual sites of codon alignments. Bioinformatics. 2005;21:2531–2533. doi: 10.1093/bioinformatics/bti320. [DOI] [PubMed] [Google Scholar]