

Abstract
Purpose
The objective of this study was to assess changes in the water apparent diffusion coefficient (ADC) and in pharmacokinetic parameters obtained from the fast-exchange regime (FXR) modeling of dynamic contrast-enhanced magnetic resonance imaging (DCE-MRI) during neoadjuvant chemotherapy in breast cancer.
Materials and Methods
Eleven patients with locally advanced breast cancer underwent MRI examination prior to and after chemotherapy but prior to surgery. A 1.5-T scanner was used to obtain T1, ADC and DCE-MRI data. DCE-MRI data were analyzed by the FXR model returning estimates of Ktrans (volume transfer constant), νe (extravascular extracellular volume fraction) and τsi (average intracellular water lifetime). Histogram and correlation analyses assessed parameter changes post-treatment.
Results
Significant ( P <.05) changes or trends towards significance ( P <.10) were seen in all parameters except τi, although there was qualitative reduction in τi values post-treatment. In particular, there was reduction ( P <.035) in voxels with Ktrans values in the range 0.2–0.5 min-1 and a decrease ( P <.05) in voxels with ADC values in the range 0.99×10⁻³ to 1.35×10⁻³ mm2/s. ADC and νe were negatively correlated (r = -.60, P <.02). Parameters sensitive to water distribution and geometry (T1, νe,τsi and ADC) correlated with a multivariable linear regression model.
Conclusion
The analysis presented here is sensitive to longitudinal changes in breast tumor status; Ktrans and ADC are most sensitive to these changes. Relationships between parameters provide information on water distribution and geometry in the tumor environment.
Keywords: DCE-MRI, ADC, Neoadjuvant chemotherapy, Fast-exchange regime
1. Introduction
Neoadjuvant chemotherapy is currently the standard of care for women with locally advanced breast cancer [1-4]. Neoadjuvant therapy reduces tumor burden, allowing a less extensive surgical procedure and early initiation of systemic therapy in patients at high risk for distant and local failure. Various metrics of therapeutic response to chemotherapy are actively being investigated, but these methods generally require invasive procedures such as repeat biopsy [5-8]. The development of noninvasive methods of tissue characterization that could be applied early in the course of treatment to assess response and to modify subsequent treatment would allow clinicians to tailor therapy on an individual basis based on each patient’s response to a particular agent or to a combination of agents. Although X-ray mammography and ultrasound imaging play critical roles in the detection and the diagnosis of breast cancer, there are currently no adequate radiological methods for assessing tumor response to treatments. Conventional magnetic resonance imaging (MRI) of the breast has proven less successful than expected [9], but more specialized methods, including dynamic contrast-enhanced magnetic resonance imaging (DCE-MRI) and diffusion-weighted magnetic resonance imaging (DW-MRI), have advanced to the point where they provide quantitative measurements of tissue properties that are highly relevant for assessing tumor progression and/or responses [10].
1.1. DCE-MRI
DCE-MRI involves the serial acquisition of MR images of a tissue of interest (e.g., a tumor locus) before, during and after an intravenous injection of a contrast agent (CA). As the CA enters into the tissue under investigation, the T1 and T2 values of tissue water decrease to an extent determined mostly by the concentration of the agent. By considering a set of images acquired before, during and after CA infusion, a region of interest (ROI) or individual voxels will display a characteristic signal intensity time course that can be related to CA concentration. By fitting DCE-MRI data to an appropriate pharmacokinetic model, physiological parameters that relate to, for example, tissue perfusion, microvascular vessel wall permeability and extracellular volume fraction, can be extracted [11]. In DCE-MRI, lesions often display characteristic enhancement patterns that have been shown to change reliably following treatments and are related to the extent and the integrity of the tumor vasculature [12,13]. Thus, there is considerable and continuing interest in developing new and improved methods to obtain these parameter values accurately and precisely.
In the analysis of DCE-MRI data, linear dependence between the longitudinal relaxation rate constant R1 (=1/T1) and the concentration of CA in the tissue Ct is typically assumed [11,14]. While true for a homogeneous solution, the use of a linear relationship for tissue assumes that transcytolemmal water exchange is effectively infinitely fast — what is commonly referred to as the fast-exchange limit (FXL) of the nuclear magnetic resonance time scale. Analyses of DCE-MRI data reported in the literature almost exclusively assume that water exchange is fast. However, several recent contributions have demonstrated that when CA concentration is high, this assumption may be violated [14,15]. By incorporating the pharmaco-kinetic theory of Kety [16] into a two-site exchange model, “fast-exchange regime” (FXR) formalism is obtained[14,15]. Initial applications of the FXR method on human DCE-MRI data suggest that assuming the FXL can underestimate the volume transfer constant (Ktrans) and extravascular—extracellular volume fractions (νe) by values up to 300% [15,17].
1.2. DW-MRI
The microscopic thermally induced random motion of water molecules is referred to as self-diffusion or Brownian motion. The rate of water diffusion is described by the apparent diffusion coefficient (ADC); in a system of small compartments (cells) separated by semipermeable barriers (cell membranes), the ADC may largely depend on the separation of barriers. In particular, the ADC has been shown to correlate with tissue cellularity; in addition, it has been shown that the exposure of tumors to both chemotherapy and radiotherapy leads to measurable increases in water diffusion in cases of favorable treatment response [18]. Preliminary studies in humans have shown that ADCs in both normal tissues and benign lesions have ADCs significantly higher than those found in malignant breast lesions [19,20]. Furthermore, recent results in rodents have shown a twofold increase in ADC values in tumors following treatment [21].
1.3. Study goals
This pilot study was designed with three goals in mind. The first goal is to determine changes that can be measured with the application of FXR DCE-MRI analysis to longitudinal studies of breast cancer patients receiving neoadjuvant chemotherapy. The second goal is to extend available data on the ADC mapping of breast cancer response to treatment. This is the first effort to combine both techniques to study the in vivo response of human breast cancer to treatment. The third goal is to perform an exploratory analysis on the relationships between measured parameters and pathologic response at the time of definitive surgery.
2. Materials and methods
2.1. Patient recruitment
Eleven women aged ≥18 years with biopsy-proven infiltrating breast cancer (Stages IIA to IIIC; Eastern Cooperative Oncology Group Performance Status 0 to 1) were enrolled in the study. Patients signed a protocol-specific consent that was approved by the ethics committee of the participating centers of our cancer center. Tumor measurements were obtained by physical exam, mammogram and/or ultrasound and clinical MRI prior to chemotherapy. The decision regarding the specific neoadjuvant regimen to be used was made by the treating medical oncologist and included Taxotere or adriamycin/Cytoxan for four cycles. The quantitative MRI exam described below was obtained before and 3–6 weeks following the completion of all preoperative cycles of chemotherapy. Patients went on to definitive surgery (consisting of lumpectomy or mastectomy) 3–4 weeks following the completion of chemotherapy. Four to 6 weeks following surgery, patients completed postoperative adjuvant chemotherapy. Following the completion of all chemotherapy, adjuvant radiation therapy was used for patients who underwent breast conservation or for those with high-risk disease following mastectomy (tumors ≥5 cm and/or ≥4 positive lymph nodes). Hormonal therapy (tamoxifen or Arimidex) was given to women who were estrogen receptor positive and/or progesterone receptor positive, and adjuvant herceptin was given to patients who were HER2+. Pathologic response was defined as follows: (a) patients with no residual viable tumor or with specimen containing only noninvasive disease, as determined on histological analysis, were classified as complete responders; and (b) patients with any viable tumor in the breast or lymph nodes were classified as nonresponders.
2.2. Data acquisition
A 1.5-T GE Signa LX scanner (GE Healthcare, Milwaukee, WI) with a body radiofrequency transmit coil and a four-channel phased-array breast receive coil was used for imaging. Patients were imaged in the prone position, with the chest wall flushed against the breast coil. Data were obtained for routine clinical diagnosis (e.g., abnormal, linear or focal enhancement skin thickening; nipple retraction; etc.), as well as for quantitative T1 mapping and DCE-MRI analysis. Conventional clinical imaging included T2-weighted fast spin-echo and high-resolution 3D T1-weighted images before and after contrast administration. For the T10 map (i.e., T1 before contrast administration), a gradient-echo multiflip-angle approach used these parameters: TR/TE=200/1.8 ms and flip angle=10°, 20°, 25°, 35° and 50°. Compared to spin-echo or inversion recovery methods, this method of T1 measurement drastically decreases the total measurement time (for large volumes of interest) while still maintaining the high signal-to-noise ratio (SNR) of those methods [22]. The imaging matrix was 256×128×(number of slices) over a 20-cm2 field of view, with a slice thickness of 5 mm and with two acquisitions. The imaging matrix was zero-filled to 2562, yielding a nominal voxel size of 0.0031 cm3. The number of slices was 22–27, depending on the patient’s breast size. Dynamic scans used parameters identical to those of the T10 map, but with the flip angle fixed at 30°. Each 22–27 slice set was collected in 52 s and was repeated 12 times. A catheter placed within the antecubital vein delivered 0.1 mmol/kg Magnevist (at a rate of 0.5 ml/s) after the second acquisition, followed by a saline flush. T1 maps were obtained for 10 of 11 pretreatment studies and for 7 of 8 post-treatment studies.
A single-shot echo planar imaging (EPI) sequence was employed for full breast ADC mapping in a short amount of time (i.e., 20 s). With TR/TE=5000/82 ms, b values of 0 and 300 s/mm2 in each of three orthogonal directions (applied sequentially) and an imaging matrix of 642 (zero-filled to 2562 to match the resolution of T1 maps), images were acquired over the same FOV as the T1 map. To increase the low SNR of EPI (particularly in the breast), 16 images were acquired and the raw data averaged. ADC maps of acceptable quality (i.e., those that allowed for ROI analysis) were obtained in 9 of 11 pretreatment patients and in 8 of 11 post-treatment scans.
2.3. Data analysis
T10 values were computed from multi-flip angle data by fitting to Eq. (1):
| (1) |
where α is the flip angle and S0 is a constant describing scanner gain and proton density; we have assumed that TE<T2*. Voxels for which Eq. (1) could not fit the data were set to 0.0 s and were not included in the analysis.
The T1 time courses for each voxel were analyzed by FXR formalism, yielding estimates of Ktrans (volume transfer constant), νe (extravascular extracellular volume fraction) and τi (average intracellular water lifetime). Details on FXR formalism are presented elsewhere [15]. The usual transformation for CA concentration in the tissue Ct to the longitudinal relaxation rate constant R1 (≡1/T1) assumes a linear relationship between the two quantities:
| (2) |
where R10 is the native R1 value of the tissue before CA administration. Eq. (2) is an “FXL” relationship, which is equivalent to assuming that the extravascular space is a single well-mixed component and that the application of Eq. (2) to biological tissue assumes that the interstitium behaves as a homogeneous solution. However, tissue parenchyma is not a single homogeneous solution but is highly compartmentalized on the scale of MRI voxel [23]. The use of a linear equation such as Eq. (2) for the entire extravascular 1H2O signal from a voxel requires that water exchange from the extravascular intracellular space to the extravascular extracellular space be sufficiently fast so that this transcytolemmal water exchange system is in “fast exchange.” In practice, this is often not the case, and Bloch equations should incorporate the effects of this exchange [14,15,17,23]. The main result of this modification is given as Eq. (3):
| (3) |
where R1i is the intracellular R1, r1 is the longitudinal relaxivity of the CA, τi is the average intracellular water lifetime of a water molecule, νe is the extravascular extracellular volume fraction and fw is the fraction of water that is accessible to a mobile CA. In actual experiments, the Ct time course cannot usually be directly measured and, thus, Eq. (3) needs to be expressed solely in terms of quantities that are actually measured in an MRI experiment — the relaxation rate constants. Towards this end, the Kety pharmacokinetic rate law is frequently employed [16]:
| (4) |
where Ktrans is the CA extravasation rate constant and Cp(t) is the concentration of CA in blood plasma, the so-called arterial input function (AIF). Substituting Eq. (4) into Eq. (3) yields an operational equation:
| (5) |
Data from each DCE-MRI study were fitted with Eq. (5) on a voxel-by-voxel basis to yield estimates of Ktrans, νe and τi for each voxel. The fitting routine employs a standard-gradient-expansion, nonlinear, least squares, curve-fitting algorithm written in the Interactive Data Language (IDL; RSI, Boulder, CO). Implicit in this analysis is the requirement for measuring or estimating the AIF. AIF measurement was not available in this study, so we employed the population-averaged AIF previously reported by Port et al. [24], which used an injection protocol similar to ours. In these fits, we have also assumed that R10=R1i, and we assigned the value of 0.8 to fw [14,23].
Ktrans, νe and τi parametric maps were thus generated on a voxel-by-voxel basis to display the extent of the lesion within a breast tissue. Voxels for which the fitting algorithm did not converge or for which the fitting algorithm converged to unphysical values (e.g., Ktrans>5.0 min-1, νe>0.1, τi>3.0 s or any parameter below 0.0) were set equal to zero. A conservative smoothing routine, which replaced each zeroed voxel with the average value of the nearest eight (nonzero) voxels, was then applied. This was performed for each slice, and the results were then rendered as 3D volume to see the extent of the tumor in space.
ADC values were computed for each voxel via Eq. (6):
| (6) |
where S(0) denotes signal intensity in the absence of diffusion gradients, b reflects the strength and the duration of a diffusion-sensitizing gradient and S(b) is the signal intensity at nonzero b value. Voxels for which the fitting algorithm did not converge or for which the fitting algorithm converged to unphysical values (e.g., ADC> 3.0×10⁻³ mm2/s or below 0.0) were set equal to zero; the highest currently reported ADC value of the breast is 2.37 (±0.27)×10-3 mm2/s [20].
Tumor volumes were estimated from both the quantitative T1 map and the DCE parameter maps. (The spatial resolution and the SNR of the ADC maps were considered insufficient to obtain accurate volume estimates.) The nominal T1 value at 1.5 T for a healthy-appearing breast tissue is approximately 250 ms; thus, voxels were considered pathologic if the T1 value exceeded 300 ms. The number of voxels across all slices that exceeded 300 ms were totaled and then multiplied by the voxel size (0.0031 cm3) to obtain a tumor volume estimate; we note that this volume estimate includes both actual tumor and edema. A similar procedure was employed to estimate tumor burden with DCE-MRI. Since the healthy-appearing breast tissue does not enhance to an appreciable extent, any voxel that exhibited enhancement enough to be fitted by Eq. (5) was considered pathologic (i.e., any voxel for which a nonzero value of Ktrans was returned was considered part of the tumor). The number of such voxels was totaled across all slices and multiplied by the voxel size. To compare tumor size, as estimated by the methods described above, with the clinically reported “longest dimension” measurement, 3D volumes were rendered to determine the longest dimension, which was then measured and tabulated.
Histograms were constructed for each data set so that changes in the distribution of each measured parameter could be tracked longitudinally. T1 values were binned between 100 and 1200 ms in increments of 80 ms; Ktrans values were binned between 0.0 and 1.12 min-1 in increments of 0.03 min-1; νe values were binned between 0.0 and 1.0 in increments of 0.07; τi values were binned between 0.0 and 3.5 s in increments of 0.15 s; and ADC values were binned between 0.0×10⁻³ and 3.0×10⁻³ mm2/s in increments of 0.1×10⁻³ mm2/s. This was performed for both pretreatment and post-treatment data sets.
Changes in ADC values were calculated by averaging the ADC values from all voxels that were judged to be from a pathologic tissue. This was performed by using the T1 map to segment the tissue that did not contain lesions (i.e., all voxels with a T1 value of >300 ms were considered pathologic, and ADC values from these voxels were used to compute mean ADC values). This was performed for each patient for both pretreatment and post-treatment data. In one patient, a T1 map was not available, so the Ktrans map was used instead, with any voxel displaying a nonzero Ktrans value considered pathologic.
Univariate and multivariate exploratory statistical correlations were performed on the functional parameters measured in the study. For each parameter, values returned from voxel-based analysis were averaged over all slices to obtain one value for the entire lesion area for both pretreatment and post-treatment time points. These values were then tabulated and used to calculate standard linear regressions and correlation coefficients for univariate analysis, while multiple linear regression was performed when multiple independent variables were considered as predictors of a single dependent variable. In both cases, P<.05 was considered significant. The goal of such analyses is to provide a more comprehensive portrait of the tumor microenvironment by analyzing interrelationships among parameters.
The T1 and ADC maps were constructed using Matlab (Mathworks, Natick, MA). All DCE-MRI fitting routines and postprocessing were performed using routines written in-house in IDL (Research Systems, Inc., Boulder, CO). Statistical analysis was performed in Microsoft Excel (Microsoft, Redmond, WA).
3. Results
The results from a representative patient who was diagnosed with an invasive ductal carcinoma are displayed in Fig. 1. Panel A represents a 3.5-min postcontrast T1-weighted sagittal image. While the lesion is somewhat difficult to see on the postcontrast image, it is very easy to delineate it from the surrounding healthy tissue on the corresponding T1 map (Panel B). Panel C depicts typical enhancement curves from two ROI labeled on Panel B. The utility of using slow injection speed (2 ml/s) is seen, as multiple points can be obtained on the uptake portion of the curve. The leftmost white circle in Panel B corresponds to the filled circles in Panel C, while the rightmost white circle corresponds to the open circles in Panel B. Eq. (5) fits of the data are depicted as solid lines in Panel C, and the AIF used to perform those fits is shown in the inset. ROI 2 has a more rapid enhancement, and this is seen in the parameters’ output from Eq. (5) fits: ROI 1, Ktrans=0.063 min-1, νe=0.23, τi=0.91 s; ROI 2, Ktrans=0.12 min-1, νe=0.33, τi=0.40 s. Performing this type of analysis for every voxel allows for the construction of the pharmacokinetic parameter maps of Fig. 2. It is a central goal of this study to track these changes from pretreatment to post-treatment.
Fig. 1.
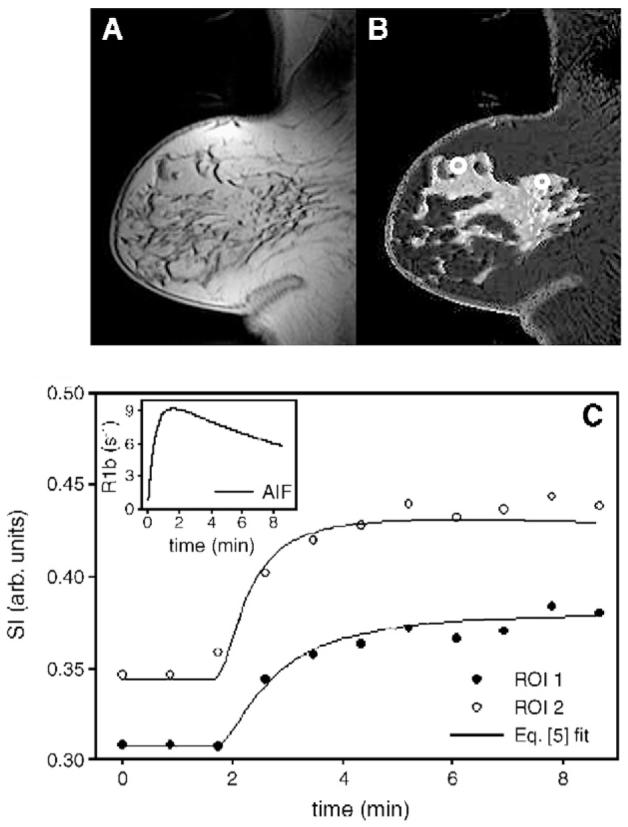
(A) A 3.5-min postcontrast T1-weighted sagittal image. The T1 map (B) readily delineates the pathologic tissue from the healthy-appearing breast tissue. (C) Two enhancement curves and the corresponding Eq. (5) fit, taken from the two ROI labeled on (B). The leftmost white circle in (B) corresponds to the filled circles in (C), which were still enhancing at the end of the 8.5-min study, whereas the open circles have reached their maximum enhancement by the ∼5 min-mark. The fits were obtained by employing a population-based AIF depicted in the upper right inset. The pharmacokinetic parameters returned from Eq. (5) analysis were: ROI 1, Ktrans = 0.063 min-1, νe = 0.23, τi =0.91; ROI 2, Ktrans =0.12 min-1, νe = 0.33, τi = 0.40.
Fig. 2.

Pretreatment and post-treatment parametric mappings of the central slice of the tumor from a representative patient are presented. The top row displays the pretreatment T1, Ktrans, νe, τi and ADC parametric maps, respectively, while the bottom row shows the corresponding post-treatment maps. In addition to the reduction in tumor size seen in all mappings, relative changes in the distribution of each parameter are visible. Most noticeable is the large drop in the fraction of red pixels on the Ktrans map, indicating a decrease in tumor vessel perfusion and/or permeability; the increase in the ADC map indicates a more geometrically favorable water diffusion environment.
The top-row images in Fig. 2 display the pretreatment parameter maps of the central slices of a second patient (from left to right: T1, Ktrans, νe, τi and ADC map). Within the tumor T1, values range from 300 to 1200 ms — a factor two to four times higher than those of the surrounding healthy-appearing adipose and glandular tissues. While most voxels are within the range 500–800 ms (yellow voxels), a central region presents voxels with T1 values approaching 1200 ms. The central portion with these high T1 values corresponds to a region of low perfusion—permeability on the adjacent Ktrans map. The Ktrans map also presents elevated values along almost the entire periphery of the tumor, which would indicate a region of active proliferation — a pattern that has been reported for many tumor types [25,26]. These Ktrans values range from 0.25 to 0.50 min-1. The next panel depicts the νe parameter map, which has values between 0.20 and 0.40, with pockets of elevated values approaching 0.50. For comparison, a healthy adipose tissue has a νe of approximately 0.09 [27]. In regions of increased νe, there seems to be a corresponding region of decreased τi (from 0.25 to 0.40 s). This is reasonable since νe and τi are, in theory, inversely correlated [24]. Areas of increased τi values (from 0.80 to 1.2 s) correspond to regions with higher Ktrans values along the periphery — a pattern that has been noticed in both animal and human data when the FXR method is utilized [17,28]. In general, the size and the shape of the tumor seen in the T1 map are mirrored in DCE-MRI parameter maps.
The pretreatment ADC map in Fig. 2 is more difficult to study (structurally), although the tumor is clearly evident. Of note is that it is very difficult to obtain reliable ADC values of the healthy-appearing breast tissue, and this is manifested by the presence of many black voxels outside the lesion area. This pattern has been reported elsewhere[20,21]. It should also be noted that this approach no longer represents the state of the art in diffusion imaging. We return to this problem in the Discussion section. The ADC values throughout the region are between 1.25×10⁻³ and 1.75×10⁻³ mm2/s, and there is a region along the tumor periphery with even lower (1.0×10⁻³ to 1.2×10⁻³ mm2/s) ADC values; this section of the tissue corresponds to the section of increased Ktrans, and it would, therefore, be reasonable to expect an area of rapid proliferation and increased cell density to present a decreased ADC.
The bottom-row images in Fig. 2 display the corresponding post-treatment maps of the same patient. In general, the total volume of the tumor decreased in all parametric maps, although the general localization that existed in the pretreatment scans changed in the post-treatment scan. The Ktrans map indicates a paucity of highly perfused and/or permeable vessels, as indicated by the small number of yellow and red voxels (Ktrans∼0.05–0.10 min-1). The pockets of high νe voxels that were present on the pretreatment νe map disappeared on the post-treatment map, as values have been reduced to ∼0.15. Interestingly, there is a central region of the main tumor that indicates high τi values that spatially correlate with lower Ktrans values; this has not been reported before, and its interpretation is unclear. The section of the tumor that is apparent on the ADC map indicates an overall increase in ADC values from pretreatment values (up to 2.0×10⁻³ mm2/s). This is expected because as cellular proliferation decreases (due to chemotherapy), there should be fewer barriers for water molecules, thereby resulting in an increased ADC.
Since all data are multislice and acquired to cover the whole breast, 3D volume representations can be constructed, as presented in Fig. 3. The top row displays pre-treatment volume renderings for Patient 2 in the same order as in Fig. 2, and the bottom row displays post-treatment volume renderings; cutaways are displayed to give an indication of where the tumor is spatially located within the breast. All volumes are rendered at 50% of their maximum value (i.e., only those voxels that are greater that 50% of the maximum value are displayed). Post-treatment scans use the pretreatment cutoff value to allow for comparison. Of particular interest is that post-treatment DCE-MRI renderings do not show any significant tumor activity, but the T1 and ADC maps do indicate some pathologic areas that could be residual tumor, necrosis or edema.
Fig. 3.

Pretreatment (top row) and post-treatment (bottom row) 3D volume renderings of each parameter’s assessment of the tumor extent of a representative patient (different from that displayed in Fig. 2) are presented. Each volume is rendered at 50% of each respective parameter’s maximum value obtained from the pretreatment study (i.e., only those voxels with values >50% of the maximum pretreatment value are displayed). Comparing the top row to the bottom row, the T1, Ktrans and νe maps indicated a tremendous drop in the extent of disease, while the τi map presents some residual areas of elevated τi. It is important to note that the T1, Ktrans and νe maps still have voxel values that are elevated above healthy values, but they are no longer above 50% of the maximum value obtained from the pretreatment study. Post-treatment ADC rendering shows an increase in overall ADC when compared to pretreatment rendering.
While the volume renderings of Fig. 3 give a visualization of the overall extent of the tumor, quantification of these lies in histogram distributions of nonzero values, which are seen in Fig. 4. Fig. 4 displays how Ttrans, νe and τi parameter distributions changed from the pretreatment study to the post-treatment study; these histograms represent average values, with error bars indicating standard deviations (S.D.). Asterisks indicate whether the change in each bin is significant, and parameter means (±S.D.) are also included in each plot. Panel A depicts the distribution of T1 values. While only the range 760–920 ms shows a borderline statistically significant change from pretreatment to post-treatment days, there is an overall decrease in T1 values; considering only those voxels with T1>250 ms, the group means changed from 0.69±0.11 to 0.60±0.05 ( P =.077). In particular, all bins below 300 ms show an increase in the percentage of voxels, while all bins above 300 ms show a decrease in the number of voxels. This is consistent with a decreased percentage of voxels displaying pathologic signs of disease and with what would be expected in response to effective treatment. Panel B shows the distribution of Ktrans values, where nearly all bins present a statistically significant change in voxel numbers; the group means changed from 0.28±0.13 to 0.12±0.10 ( P =.013). In particular, only the first bins centered at 0.05 min-1 show an increase in the number of voxels; all other bins show a significant decrease in the number of voxels. This is consistent with an overall decrease in the number of tissue voxels that are well-perfused or highly permeable and would be also expected in response to effective treatment. All bins above the 0.5 min-1 range (not depicted for presentation purposes) did not show a statistically significant change. The distribution of νe is depicted in Panel C, and only one bin shows statistically significant changes (another shows a trend towards significance) although, again, there is an overall decrease in high νe bins; all bins >0.37 show a decrease in the number of voxels, while nearly all bins below this threshold exhibit an increase (the one exception is the bin centered at 0.05). The group means changed from 0.32±0.07 to 0.24±0.08 ( P =.067). This is again consistent with less pathologic voxels as the tissue begins to have more voxels closer to the value of the healthy tissue (0.10). The τi distributions in Panel D present a story similar to those of others; namely, a general decrease in the highest values and an increase in the lowest values, although none of these changes was statistically significant. The group means changed from 0.95±0.31 to 0.94±0.35 ( P =NS). The importance of these histograms resides in the hope that the regions showing the greatest change post-treatment could be predictors of treatment response. We explore this possibility below.
Fig. 4.

Parameter outputs from all patients were grouped as pretreatment or post-treatment and were then averaged to form the distributions displayed here; the error bars indicate 1 S.D. Parameter means (±S.D.) are also presented. (A) The T1 changes in the range between 750 and 1000 ms show a strong trend towards a significant change between pretreatment and post-treatment data; note the corresponding change in the range 170–210 ms. (B) Along with ADC measurements, Ktrans showed the greatest changes post-treatment, as evidenced by the large range of bins showing significant changes. (C) While there was only one bin that presents a significant change in νe, all bins above 0.25 have a decreased percentage of voxels when post-treatment distribution is compared to pretreatment distribution. (D) Although there was a qualitative decrease in the value of the τi parameter from pretreatment to post-treatment data sets, none of these changes approached significance.
Fig. 5 shows changes in pathologic volume as estimated by the T1 map (Panel A) and by DCE-MRI measurements (Panel B); we use the phrase “pathologic volume” as we do not currently know if these parametric maps underestimate or overestimate true tumor size, since only “longest dimension” measures were available on excised tumors. The T1 map yields an estimate of total tumor burden that is significantly larger than that of DCE-MRI measurements; note the vertical scale differences on the two panels. This is most likely because an increase in T1 can be caused by an increase in water content, which could be due to cellular proliferation (in surrounding noncancerous tissues) resulting from viable tumor and edema. Ten of 11 patients exhibited a decrease in tumor volume as determined by the T1 map, while all patients exhibited a decrease in tumor volume on DCE-MRI analysis. Interestingly, Patient 9 presented the smallest reduction (25%) in tumor volume as estimated by DCE-MRI, and this was the same patient who showed an increase in tumor volume on the T1 map. The volume change reduction, as estimated by the T1 map, was from-40% to +3%, while the reduction on DCE-MRI analysis was from -97% to -25%. The tumor volume estimates reported by T1 and DCE-MRI methods were significantly different for both pretreatment ( P <.02) and post-treatment ( P <.01) time points. An ongoing aim of this study is to compare these measurements quantitatively to histological sections obtained at the time of surgery to see which of these measures (or combinations thereof) leads to a more accurate prediction of tumor size; others have begun such important studies [29]. The importance of performing voxel-based analysis is underscored in histogram analyses, as histograms display regions of significant changes whereas global mean averages may not.
Fig. 5.
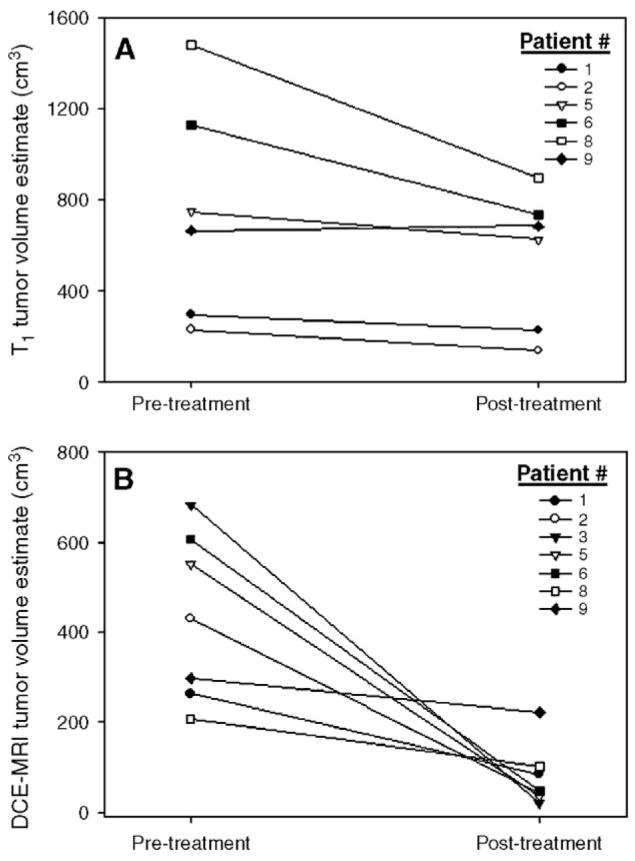
T1 and DCE-MRI tumor volume estimates. (A) All pixels that showed a T1 value above 300 ms were counted as pathologic and were included in the total volume estimate. All patients, except one (Patient 9), showed a decrease in tumor volume, as estimated by this method. (B) Any pixel that showed an enhancement pattern that could be fitted by Eq. (5) was included in the total DCE-MRI volume estimate. All patients showed a decrease in tumor volume estimate, and Patient 9 showed the smallest decrease (25%). Note the difference in vertical scales on the two panels; T1 estimates report a tumor significantly larger ( P = .0006) than that of DCEMRI estimates.
To compare these measurements to currently utilized measures of tumor response (clinical exam, ultrasound and X-ray mammography), we compared the longest dimension (as estimated by the T1 and DCE-MRI maps) to the single longest dimension (as estimated by clinical exam, ultra-sound and mammogram). There was no significant correlation between any of the measures. This is not surprising as these methods do not typically have a high rate of agreement (e.g., see Yeh et al. [30]) and underscore the necessity of developing new imaging biomarkers that can report on tumor characteristics.
To date, there have been few reports on the ADC mapping of the human breast. This is, no doubt, due to currently existing great difficulties with applying the most common DW-MRI method (EPI) to the breast. Indeed, the two major problems with EPI are present in breast imaging; namely, a large susceptibility interface between air and tissue (lung—breast), and motion (due to normal respiratory activity). Nonetheless, over the last several years, some groups have contributed initial estimates on ADC values in cancerous breast tissues [19,20,31-34]. We present our results in Fig. 6. Panel A displays the average ADC values obtained from nine patients before treatment compared to the average ADC values obtained from eight patients after treatment. The pretreatment ADC value was 1.46(±0.30)×10-3 mm2/s, while the post-treatment value increased by 36.7% to 2.00(±0.20)×10-3 mm2/s. Pretreatment values were well within the range of reported malignant breast tumor ADCs, which ranged from 0.97×10⁻³ mm2/s [34] to 1.60×10⁻³ mm2/s [20]. The bold line in each vertical bar plot indicates the mean value, while the other lines indicate the 5%, 50%, 75% and 95% percentiles, respectively. Panel B depicts the corresponding histogram and shows that significant changes occurred between pretreatment and post-treatment data sets. Significant ( P<.035) changes occurred between the values of 1.10×10⁻³ and 1.40×10⁻³ mm2/s, as well as between 2.15×10⁻³ and 2.45×10⁻³ mm2/s. Trending towards significant ( P<.10) changes was obtained in the range 0.80×10⁻³ to 0.95×10⁻³ mm2/s. This corresponds to an increase in ADC after treatment and indicates the range of changes that can be expected in the ADC monitoring of treatment in breast cancer.
Fig. 6.
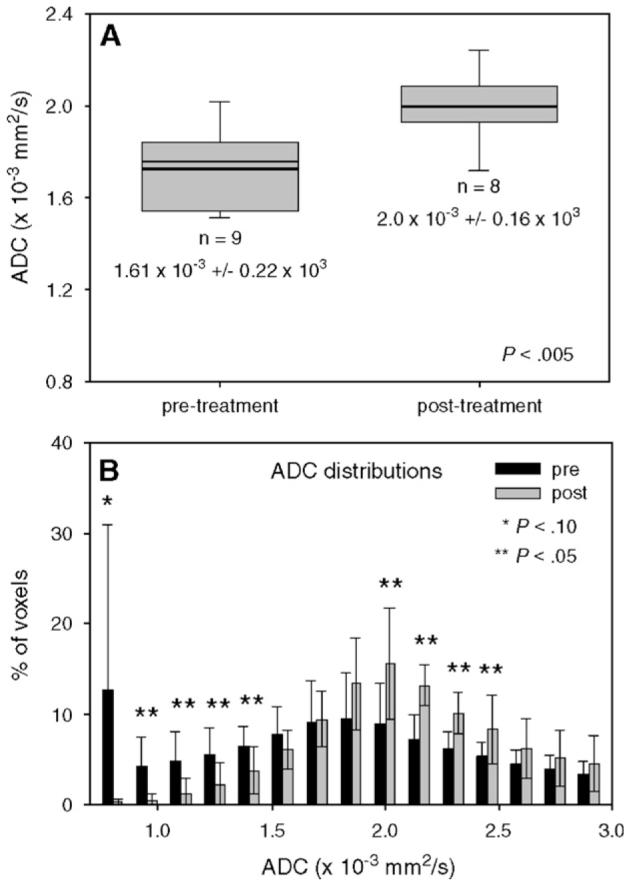
Changes in ADC measurements pretreatment and post-treatment. (A) The bold line in each vertical bar plot indicates the mean value, while the other lines indicate the 5%, 50%, 75% and 95% percentiles, respectively. (B) The ADC parameter distribution displays many bins showing significant changes from pretreatment to post-treatment results. There is a significant increase in ADC values post-treatment.
Univariate correlation analysis was performed among all five quantitative parameters measured in this study, namely, R1 (≡/T1), Ktrans, νe, τi and ADC. Only the regression of ADC on νe returned significant results, and this is displayed in Fig. 7 with the associated linear regression line and best-fit parameters. Of particular note is the negative slope on the ADC-versus-νe scatter plot, a point discussed below. All 25 (i.e., five parameters chosen two at a time, then three at a time, then all four) combinations of parameters (i.e., all combinations of two parameters regressed on a single parameter; all combinations of three parameters regressed on a single parameter; all four parameters regressed on a single parameter) were tested for multiple correlation, and six of these combinations were tested for significance at the P<.05 level and are presented in Table 1. The parameters that describe the amount and the arrangement of water (i.e., R1, ADC, νe and τi) figure heavily in all six of these relationships. The regression formulas show how each of the independent parameters is related to the dependent parameter.
Fig. 7.
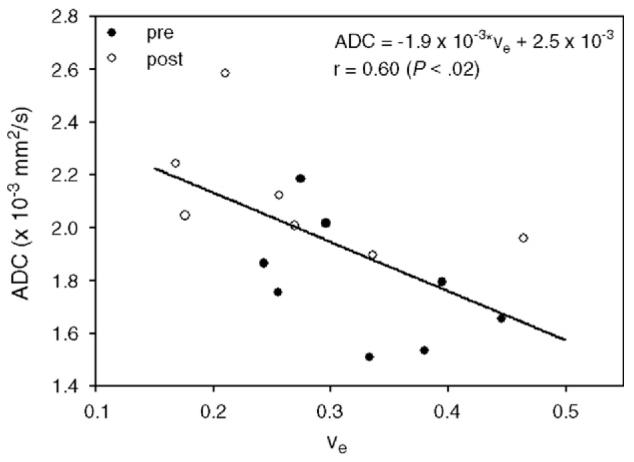
All parameters were tested for correlation, although only two tested for a significant relationship; there was a significant negative relationship between ADC and νe. Although other groups have reported increases in ADC and decreases in νe post-treatment in breast cancer, they have yet to be measured simultaneously, and the trend displayed here requires careful analysis. Filled circles represent pretreatment data, while open circles represent post-treatment data (see text for details).
Table 1.
All combinations of parameters were tested for correlation with multivariate linear regression analysis
| Parameters |
|||
|---|---|---|---|
| Independent | Dependent | r (P<.05) | Regression equation |
| R1, νe | ADC | .63 | ADC= −(2.6×10⁻⁴R1)−(2.0×10⁻³νe)+2.9×10⁻³ |
| R1, ADC | τi | .66 | τi = 0.79R1+517.6ADC+1.08 |
| R1, ADC | νe | .64 | νe = −0.1R1−200.1ADC+0.84 |
| Ktrans, ADC | νe | .64 | νe = -181.7Ktrans+0.57ADC+0.64 |
| νe,τi | ADC | .64 | ADC = −(2.0×10⁻⁴νe)−(1.5×10⁻³τi)+2.2×10⁻³ |
| R1, Ktrans, νe | τi | .75 | τi = −(2.23R1)+(0.19Ktrans)−0.88νe+2.85 |
The table summarizes the results of combinations of parameters for which there was a significant relationship. Parameters that are sensitive to water distribution and geometry (i.e., T1, νe, τi and ADC) dominate the list.
The small number of patients for which all imaging and pathology data were available did not allow us to make meaningful comments on correlations between clinical response and imaging metrics. Ongoing efforts to increase patient number are designed to address this issue.
4. Discussion
We have presented the first study that combines FXR analysis of DCE-MRI data with ADC mapping to monitor treatment response in human breast cancer. In general, the results show that the greatest changes occur with the Ktrans and ADC parameters. Significant changes for Ktrans were measured within the range 0.05–0.50 min-1, which corresponds to a decrease in the percentage of tissue voxels that are highly perfused and/or permeable. Significant changes were seen in the range 1.15×10⁻³ to 1.45×10⁻³ mm2/s and in the range 2.00×10⁻³ to 2.35×10⁻³ mm2/s, for ADC which corresponds to an overall decrease in cell density. Both these changes are consistent with effective therapy. The ADC changes are of particular interest due to the current paucity of data existing in the literature. The significant changes that occurred in ADC values post-treatment suggest that this parameter could be a useful surrogate biomarker for assessing response to therapy in breast tumors. As technical issues facing ADC mapping of the breast are eliminated, changes in ADC values post-treatment will become more robust and, potentially, the error bars in Fig. 7 will narrow.
The νe parameter showed a significant decrease ( P<.03) in the range 0.40–0.47 and a trend towards significant ( P<.10) change in the range 0.33–0.40. There was an overall decrease in the distribution of νe for all values >0.25. This corresponds to what other groups have shown[35,36]. Of note is the fact that the correlation between ADC and νe is negative. Although other investigators have shown a decrease in breast tumor ADC compared to that in healthy tissue [19,20,31-34] and a drop in νe after treatment [35,36], they have not been measured simultaneously in a longitudinal study. The present study design overcomes this limitation.
In healthy tissue, most water is intracellular; therefore, the measured water ADC is believed to be dominated by the fraction of intracellular water. Intracellular water diffusion is believed to more restricted than extracellular water due to cell organelles, the cytoskeleton, and so on; indeed, it has been estimated that extracellular water diffuses at a rate two to three times higher than that of intracellular water [37,38]. Therefore, a breast tumor with increased cell density and with an associated increase in intracellular water fraction would present a decrease in the measured water ADC relative to the healthy adipose tissue; this reduction in breast tumor ADC has been measured [19,20,31-34]. The conventional interpretation of the increase in ADC after successful treatment is that there is a reduction in cell density and in associated restricting barriers of cell membranes due to cell death and lysis. Additionally, the relative increase in extracellular space (post-treatment) leads to an increase in the measured ADC post-treatment.
Conversely, the νe measurements presented here and in other studies [35,36] indicate that the extracellular space shrinks in response to treatment, and this should correlate with an ADC decrease as the fraction of extracellular water has decreased. Since this is not what the data show, it is clear that the full picture is more complicated than either of these parameters alone would indicate. In light of the results presented here, an alternative explanation is that, while the extracellular space has become smaller post-treatment, its geometrical arrangement has become more favorable for diffusing water molecules. This may be related to changes in interstitial fluid pressure (IFP). It has been shown that IFP is initially high in tumors due to increased vascular permeability and due to the absence of a functional lymphatic system [39]. Additionally, it has been shown that taxanes (paclitaxel and Taxotere) decrease the IFP [40,41], helping to eliminate cell debris and resulting in an increase in ADC even though there may be an overall decrease in νe. This “reorganization” of the extravascular extracellular tumor space post-treatment could explain the changes seen here and elsewhere. Other measurements (MR-based or otherwise) need to be obtained to further elucidate the relationship between ADC and νe changes in the extracellular space post-therapy.
The τi parameter does not show a range for significant changes when histogram distributions are considered. It could be that this extra parameter does not offer any additional information on treatment response, although it has been shown to potentially assist with diagnosis [42]. The trend towards reduction in τi values is interesting, although (and it may be that) as ROI progresses from invasive cancer to healthy tissue, the exchange kinetics moves from the FXR to the FXL. As τi is a measure of cell size [τi= V/(PA), where V is the volume of the cell, P is the permeability of the cell membrane and A is the surface area of the cell] [23], it increases with increasing cell size and decreases with increasing cell permeability. Thus, a decrease in τi would correspond to an increase in ADC. Presumably, as tumor cells shrink or apoptose in response to effective therapy, the τi value would decrease. This can be seen in the present data set, although the changes did not reach the significance threshold. Alternatively, some types of chemotherapy are known to induce cell swelling [38], and this would manifest as an increase in τi. In short, the diagnostic utility of this parameter has yet to be fully understood or exploited.
It is well known that in regions of increased water content, there is an increased T1; this is one of the sources of the tremendous contrast seen in Fig. 1B between the lesion and the healthy-appearing breast tissue. It has been hypothesized that another source for the increase in T1 in tumor tissue is the change in the ratios of free and bound water due to an increase in the extravascular extracellular volume fraction [43]. As νe decreases, T1 should decrease as well, and both parameters did decrease after treatment, although a significant correlation was not seen in the present data set.
Multivariate correlations could present additional information on water content and on tumor space distribution, and their relationships should be further investigated. As discussed above, T1 (or R1), νe, τi and ADC are all affected by the distribution of water between the intracellular space and the extracellular space, and it is therefore not surprising that they are heavily correlated. As R1 decreases, there could be more free water, and this would result in an increased ADC value; balancing this regression equation is an increased extravascular space, which results in greater reduction in ADC, as given by regression coefficients. The negative correlation between τi and R1 has been discussed, and the appearance of Ktrans as a predictor of τi is also reasonable; a large Ktrans leads to a large concentration of CA in the extravascular space, thereby driving the exchange system out of the FXL and into the FXR, resulting in an appreciable τi value.
There are several limitations in the present study. First, the temporal resolution (52 s) in which DCE-MRI data were acquired is not optimal as it allows for the acquisition of only 12 data points. This limitation was somewhat overcome by the use of a slower injection speed (rather than a rapid bolus injection) of the CA, which allows for acquisition of data on the uptake portion of the curve. A second limitation of the study was that the AIF employed in the study was a population-based AIF [24] and, ideally, this should be obtained from each individual patient. Given the temporal resolution of our data acquisition (52 s), it was simply not possible to obtain a reasonable estimate of the AIF from image sets. This is a significant limitation because it has been shown that incorrect AIF characterization (as assessed by bolus arrival time, full width at half maximum) can lead to errors of >50% in returned pharmacokinetic parameters [15]. A third major problem is that echo planar techniques for obtaining diffusion-weighted images are far from ideal for application on the breast. Each of these problems has been addressed, as we have moved this study to a 3.0-T instrument with SENSE technology, which allows for many technical improvements. In particular, our temporal resolution has been improved to 17 s, the spatial resolution has been improved to 0.0031 mm3/voxel and we now employ single-shot diffusion-weighted fast spin echo for ADC mapping. By maintaining a slower injection rate, more points are acquired on the uptake portion of the curve, which allows for a more robust curve fitting. Additionally, preliminary results indicate that a reasonable estimate of the AIF can be obtained even at this low temporal resolution from the axillary artery, which is visible within the field of view; this has been reported previously [17,42]. The final shortcoming in the present study is the small number of patients studied. This preliminary study does give an indication of the type of changes one can expect when performing an FXR analysis of DCE-MRI data and ADC mapping in the assessment of treatment response in breast cancer. The fact that there was no correlation between the MR metrics and the more standard measures—or between the standard measures themselves—indicates that novel methods of assessing tumor response in vivo are required.
As the number of patients analyzed with this technique increases, it is expected that the significance of measured changes can be increased and that these changes can be used to guide the application of these techniques in future larger patient samples. These preliminary results will be used to study a larger population to provide sufficient power to correlate changes noted in DCE-MRI with treatment response. We conclude that FXR analysis of DCE-MRI data and ADC mapping can be used to measure response to neoadjuvant chemotherapy and that this may be potentially more reproducible than currently utilized methods, including clinical breast examination, mammogram and ultrasound. The results presented here indicate the range within which each parameter distribution is most sensitive to treatment response. The ADC and Ktrans parameters showed the greatest change post-treatment, and it is recommended that both these parameters be measured in future quantitative studies of breast cancer response to therapy. Thus, changes within these ranges have the potential to indicate treatment response on an individual basis. Furthermore, the interpara-meter relationships seen in this small patient set should encourage further investigation on employing multiparameter mapping to provide additional information on tumor milieu. In conclusion, the results presented here can be used as a guide to assess treatment response in a larger patient population and will ultimately be used as quantitative noninvasive metrics of treatment response in cancer.
Acknowledgments
We thank the National Institutes of Health for funding (NCI 1R25 CA92043, NCI 1P50 098131-01, NCI P30CA68485 and NIBIB 1K25 EB005936-01). We thank the superb MRI technologists at Vanderbilt University who assisted in this study: Ric Andal, Margaret Rogers, Wanda Smith and Pam Cohen. We thank Petrice Mostardi, Andrew Wald, Amelia Gillman and Robert Lee for many engaging and interesting discussions.
References
- [1].Fisher B, Bryant J, Wolmark N, et al. Effect of preoperative chemotherapy on the outcome of women with operable breast cancer. J Clin Oncol. 1998;16:2672–85. doi: 10.1200/JCO.1998.16.8.2672. [DOI] [PubMed] [Google Scholar]
- [2].Bear HD, Anderson S, Brown A, et al. The effect on tumor response of adding sequential preoperative docitaxel to preoperative doxorubicin and cyclophosphamide: preliminary results from National Surgical Adjuvant Breast and Bowel Project Protocol B-27. J Clin Oncol. 2003;21(22):4165–74. doi: 10.1200/JCO.2003.12.005. [DOI] [PubMed] [Google Scholar]
- [3].Gonzalez-Angulo AM, McGuire SE, Buchholz TA, Tucker SL, Kuerer HM, Rouzier R, et al. Factors predictive of distant metastases in patients with breast cancer who have a pathologic complete response after neoadjuvant chemotherapy. J Clin Onc. 2005;23:7098–104. doi: 10.1200/JCO.2005.11.124. [DOI] [PubMed] [Google Scholar]
- [4].Hanrahan EO, Hennessy BT, Valero V. Neoadjuvant systemic therapy for breast cancer: an overview and review of recent clinical trials. Expert Opin Pharmacother. 2005;6:1477–91. doi: 10.1517/14656566.6.9.1477. [DOI] [PubMed] [Google Scholar]
- [5].Mohsin SK, Weiss HL, Gutierrez MC, et al. Neoadjuvant trastuzumab induces apoptosis in primary breast cancers. J Clin Oncol. 2005;23:2460–8. doi: 10.1200/JCO.2005.00.661. [DOI] [PubMed] [Google Scholar]
- [6].Stearns V, Singh B, Tsangaris T, et al. A prospective randomized pilot study to evaluate predictors of response in serial core biopsies to single agent neoadjuvant doxorubicin or paclitaxel for patients with locally advanced breast cancer. Clin Cancer Res. 2003;9:124–33. [PubMed] [Google Scholar]
- [7].Buchholz TA, Davis DW, McConkey DJ, et al. Chemotherapy-induced apoptosis and Bcl-2 levels correlate with breast cancer response to chemotherapy. Cancer J. 2003;9(1):33–41. doi: 10.1097/00130404-200301000-00007. [DOI] [PubMed] [Google Scholar]
- [8].Chakravarthy AB, Kelley MC, McLaren B, Truica CI, Billheimer D, Mayer IA, et al. Neoadjuvant concurrent paclitaxel and radiation in stage II/III breast cancer. Clin Cancer Res. 2006;12:1570–6. doi: 10.1158/1078-0432.CCR-05-2304. [DOI] [PubMed] [Google Scholar]
- [9].Heywang-Koebrunner SH. Breasts. In: Bradley WG, Stark DD, editors. Magnetic resonance imaging. Mosby; St. Louis (Mo): 1999. pp. 1401–28. [Google Scholar]
- [10].Delille J-P, Slanetz PJ, Yeh ED, Halpern EF, Kopans DB, Garrido L. Invasive ductal breast carcinoma response to neoadjuvant chemotherapy: noninvasive monitoring with functional MR imaging — pilot study. Radiology. 2003;228:63–9. doi: 10.1148/radiol.2281011303. [DOI] [PubMed] [Google Scholar]
- [11].Tofts PS, Brix G, Buckley DL, Evelhoch JL, Henderson E, Knopp MV, et al. Estimating kinetic parameters from dynamic contrast-enhanced T1-weighted MRI of a diffusible tracer: standardized quantities and symbols. J Magn Reson Imaging. 1999;10:223–32. doi: 10.1002/(sici)1522-2586(199909)10:3<223::aid-jmri2>3.0.co;2-s. [DOI] [PubMed] [Google Scholar]
- [12].Padhani AR, Leach MO. Antivascular cancer treatments: functional assessments by dynamic contrast-enhanced magnetic resonance imaging. Abdom Imaging. 2005;30:324–42. doi: 10.1007/s00261-004-0265-5. [DOI] [PubMed] [Google Scholar]
- [13].Choyke PL, Dwyer JA, Knopp VM. Functional tumor imaging with dynamic contrast-enhanced magnetic resonance imaging. J Magn Reson Imaging. 2003;17:509–20. doi: 10.1002/jmri.10304. [DOI] [PubMed] [Google Scholar]
- [14].Landis CS, Li X, Telang FW, Coderre JA, Micca PL, Rooney WD, et al. Determination of the MRI contrast agent concentration time course in vivo following bolus injection: effect of equilibrium transcytolemmal water exchange. Magn Reson Med. 2000;44:563–74. doi: 10.1002/1522-2594(200010)44:4<563::aid-mrm10>3.0.co;2-#. [DOI] [PubMed] [Google Scholar]
- [15].Yankeelov TE, Rooney WD, Li X, Springer CS. Variation of the relaxographic “shutter-speed” for transcytolemmal water exchange affects CR bolus-tracking curve shape. Magn Reson Med. 2003;50:1151–69. doi: 10.1002/mrm.10624. [DOI] [PubMed] [Google Scholar]
- [16].Kety SS. Peripheral blood flow measurement. Pharmacol Rev. 1951;3:1–41. [PubMed] [Google Scholar]
- [17].Yankeelov TE, Rooney WD, Huang W, Dyke JP, Li X, Tudorica A, et al. Evidence for Shutter-speed variation in CR bolus-tracking studies of human pathology. NMR Biomed. 2005;18:173–85. doi: 10.1002/nbm.938. [DOI] [PubMed] [Google Scholar]
- [18].Kauppinen RA. Monitoring cytotoxic tumour treatment response by diffusion magnetic resonance imaging and proton spectroscopy. NMR Biomed. 2002;15:6–17. doi: 10.1002/nbm.742. [DOI] [PubMed] [Google Scholar]
- [19].Guo Y, Cai Y-Q, Cai Z-L, Gao Y-G, An N-Y, Ma L, et al. Differentiation of clinically benign and malignant breast lesions using diffusion-weighted imaging. J Magn Reson Imaging. 2002;16:172–8. doi: 10.1002/jmri.10140. [DOI] [PubMed] [Google Scholar]
- [20].Sinha S, Lucas-Quesada FA, Sinha U, De Bruhl N, Bassett LW. In vivo diffusion-weighted MRI of the breast: potential for lesion characterization. J Magn Reson Imaging. 2002;15:693–704. doi: 10.1002/jmri.10116. [DOI] [PubMed] [Google Scholar]
- [21].Galons J-P, Altbach MI, Paine-Murrieta G, Taylor CW, Gillies RJ. Early increases in breast tumor xenograft water mobility in response to paclitaxel therapy detected by non-invasive diffusion magnetic resonance imaging. Neoplasia. 1999;2:113–7. doi: 10.1038/sj.neo.7900009. [DOI] [PMC free article] [PubMed] [Google Scholar]
- [22].Haacke EM, Brown RW, Thompson MR, Venkatesan R. Magnetic resonance imaging: physical principles and sequence design. Wiley-Liss; New York: 1999. p. 654. [Google Scholar]
- [23].Landis CS, Li X, Telang FW, Molina PE, Pályka I, Vétek G, et al. Equilibrium transcytolemmal water-exchange kinetics in skeletal muscle in vivo. Magn Reson Med. 1999;42:467–78. doi: 10.1002/(sici)1522-2594(199909)42:3<467::aid-mrm9>3.0.co;2-0. [DOI] [PubMed] [Google Scholar]
- [24].Port RE, Knopp MV, Brix G. Dynamic contrast-enhanced MRI using Gd-DTPA: interindividual variability of the arterial input function and consequences for the assessment of kinetics in tumors. Magn Reson Med. 2001;45:1030–8. doi: 10.1002/mrm.1137. [DOI] [PubMed] [Google Scholar]
- [25].Hayes C, Padhani AR, Leach MO. Assessing changes in tumor vascular function using dynamic contrast-enhanced magnetic resonance imaging. NMR Biomed. 2002;15:154–63. doi: 10.1002/nbm.756. [DOI] [PubMed] [Google Scholar]
- [26].Checkley D, Tessier JJL, Wedge SR, Dukes M, Kendrew J, Curry B, et al. Dynamic contrast-enhanced MRI of vascular changes induced by the VEGF-signalling inhibitor ZD4190 in human tumour xenografts. Magn Reson Imaging. 2003;21:475–82. doi: 10.1016/s0730-725x(02)00644-6. [DOI] [PubMed] [Google Scholar]
- [27].Padhani AR, Hayes C, Landau S, Leach MO. Reproducibility of quantitative dynamic MRI of normal human tissues. NMR Biomed. 2002;15:143–53. doi: 10.1002/nbm.732. [DOI] [PubMed] [Google Scholar]
- [28].Zhou R, Pickup S, Yankeelov TE, Springer CS, Glickson JD. Simultaneous measurement of arterial input function and tumor pharmacokinetic in mice by dynamic contrast enhanced imaging: effects of equilibrium transcytolemmal water exchange. Magn Reson Med. 2004;52:248–57. doi: 10.1002/mrm.20143. [DOI] [PubMed] [Google Scholar]
- [29].Holland AE, Hendrick RE, Jin H, Russ PD, Barentsz JO, Holland R, et al. Correlation of high-resolution breast MR imaging with histopathology; validation of a technique. J Magn Reson Imaging. 2000;11:601–6. doi: 10.1002/1522-2586(200006)11:6<601::aid-jmri5>3.0.co;2-g. [DOI] [PubMed] [Google Scholar]
- [30].Yeh E, Slanetz P, Kopans DB, Rafferty E, Georgian-Smith D, Moy L, et al. Prospective comparison of mammography, sonography, and MRI in patients undergoing neoadjuvant chemotherapy for palpable breast cancer. AJR Am J Roentgenol. 2005;184:868–77. doi: 10.2214/ajr.184.3.01840868. [DOI] [PubMed] [Google Scholar]
- [31].Woodhams R, Matsunaga K, Iwabuchi K, Kan S, Hata H, Kuranami M, et al. Diffusion-weighted imaging of malignant breast tumors: the usefulness of apparent diffusion coefficient (ADC) value and ADC map for the detection of malignant breast tumors and evaluation of cancer extension. J Comput Assist Tomogr. 2005;29:644–9. doi: 10.1097/01.rct.0000171913.74086.1b. [DOI] [PubMed] [Google Scholar]
- [32].Woodhams R, Matsunaga K, Kan S, Hata H, Ozaki M, Iwabuchi K, et al. ADC mapping of benign and malignant breast tumors. Magn Reson Med Sci. 2005;4:35–42. doi: 10.2463/mrms.4.35. [DOI] [PubMed] [Google Scholar]
- [33].Kuroki Y, Nasu K, Kuroki S, Murakami K, Hayashi T, Sekiguchi R, et al. Diffusion-weighted imaging of breast cancer with the sensitivity encoding technique: analysis of the apparent diffusion coefficient value. Magn Reson Med Sci. 2004;15:79–85. doi: 10.2463/mrms.3.79. [DOI] [PubMed] [Google Scholar]
- [34].Kinoshita T, Yashiro N, Ihara N, Funatu H, Fukuma E, Narita M. Diffusion-weighted half-Fourier single-shot turbo spin echo imaging in breast tumors: differentiation of invasive ductal carcinoma from fibroadenoma. J Comput Assist Tomogr. 2002;26:1042–6. doi: 10.1097/00004728-200211000-00033. [DOI] [PubMed] [Google Scholar]
- [35].Wedam SB, Low JA, Yang SX, Chow CK, Choyke P, Danforth D, et al. Antiangiogenic and antitumor effects of bevacizumab in patients with inflammatory and locally advanced breast cancer. J Clin Oncol. 2006;24:769–77. doi: 10.1200/JCO.2005.03.4645. [DOI] [PubMed] [Google Scholar]
- [36].Pickles MD, Lowry M, Manton DJ, Gibbs P, Turnbull LW. Role of dynamic contrast enhanced MRI in monitoring early response of locally advanced breast cancer to neoadjuvant chemotherapy. Breast Cancer Res Treat. 2005;91:1–10. doi: 10.1007/s10549-004-5819-2. [DOI] [PubMed] [Google Scholar]
- [37].Goodman JA, Kroenke CD, Bretthorst GL, Ackerman JJH, Goodman JJN. Sodium ion apparent diffusion coefficient in living rat brain. Magn Reson Med. 2005;53:1040–5. doi: 10.1002/mrm.20444. [DOI] [PubMed] [Google Scholar]
- [38].Paran Y, Bendel P, Margalit R, Degani H. Water diffusion in the different microenvironments of breast cancer. NMR Biomed. 2004;17:170–80. doi: 10.1002/nbm.882. [DOI] [PubMed] [Google Scholar]
- [39].Ferretti S, Allegrini PR, O’Reilly T, Schnell C, Stumm M, Wartmann M, et al. Patupilone induced vascular disruption in orthotopic rodent tumor models detected by magnetic resonance imaging and interstitial fluid pressure. Clin Cancer Res. 2005;11:7773–84. doi: 10.1158/1078-0432.CCR-05-1165. [DOI] [PubMed] [Google Scholar]
- [40].Taghian AG, Abi-Raad R, Assaad SI, Casty A, Ancukiewicz M, Yeh E, et al. Paclitaxel decreases the interstitial fluid pressure and improves oxygenation in breast cancers in patients treated with neoadjuvant chemotherapy: clinical implications. J Clin Oncol. 2005;23:1951–61. doi: 10.1200/JCO.2005.08.119. [DOI] [PubMed] [Google Scholar]
- [41].Griffon-Etienne G, Boucher Y, Brekken C, Suit HD, Jain RK. Taxane-induced apoptosis decompresses blood vessels and lowers interstitial fluid pressure in solid tumors: clinical implications. Cancer Res. 1999;59:3776–82. [PubMed] [Google Scholar]
- [42].Li X, Huang W, Yankeelov TE, Tudorica A, Rooney WD, Springer CS. Shutter-speed analysis of CR bolus-tracking data facilitates discrimination of benign and malignant breast disease. Magn Reson Med. 2005;53:724–9. doi: 10.1002/mrm.20405. [DOI] [PubMed] [Google Scholar]
- [43].Jakobsen I, Lyng H, Kaalhus O, Rofstad EK. MRI of human tumor xenografts in vivo: proton relaxation times and extracellular tumor volume. Magn Reson Imaging. 1995;13:693–700. doi: 10.1016/0730-725x(95)00019-d. [DOI] [PubMed] [Google Scholar]