

Abstract
Objective
The aim of our study was to investigate the use of targeted contrast-enhanced high-frequency ultrasonography for molecular imaging of vascular endothelial growth factor receptor 2 (VEGFR2) expression on tumor vascular endothelium in murine models of breast cancer.
Methods
Highly invasive metastatic (4T1) and nonmetatstatic (67NR) breast cancer cells were implanted in athymic nude mice. Tumors were examined in vivo with targeted contrast-enhanced high-frequency ultrasonography using a scanner with a 40-MHz probe. Randomized boluses of ultrasound contrast agents (UCAs) conjugated with an anti-VEGFR2 monoclonal antibody or an isotype control antibody (immunoglobulin G) were injected into the animals. Sonograms were analyzed by calculation of the normalized video intensity amplitudes caused by backscatter of the bound UCA. After ultrasonography, the tumor samples were harvested for analysis of VEGFR2 expression by immunoblotting and immunocytochemistry.
Results
The mean video intensity amplitude caused by backscatter of the retained VEGFR2-targeted UCA was significantly higher than that of the control UCA (mean ± SD: 4T1 tumors, 15 ± 3.5 versus 7 ± 1.6 dB; P < .01; 67NR tumors, 50 ± 12.3 versus 12 ± 2.6 dB; P < .01). There was a significant difference in VEGFR2-targeted UCA retention between 4T1 and 67NR tumors (normalized video intensity amplitudes, 15 ± 3.5 and 50 ± 12.3 dB, respectively; P < .001), and this correlated well with relative VEGFR2 expression in the two tumor types.
Conclusions
Targeted contrast-enhanced high-frequency ultrasonography may enable in vivo molecular imaging of VEGFR2 expression on the tumor vascular endothelium and may be used for noninvasive longitudinal evaluation of tumor angiogenesis in preclinical studies.
Keywords: breast cancer, molecular ultrasonography, vascular endothelial growth factor receptor 2
Noninvasive molecular imaging attempts to map spatial distribution of molecular events or processes. When applied to cancer, molecular imaging may be used not only to identify and locate a tumor but also to visualize the expression and activity of specific molecules and interactions that control tumor progression and response to therapy.1 In the past, molecular imaging techniques have depended on the use of radiolabeled agents. With recent technological advances, ultrasonography is also a potential modality for molecular imaging. Ultrasonography offers several key advantages over other molecular imaging modalities: high spatial resolution (frequency dependant), real-time imaging, the ability to obtain both anatomic and molecular information in a single imaging session, and freedom from the use of ionizing radiation.
One potential application of molecular ultrasonography is the assessment of tumor angiogenesis. Angiogenesis is a critical process in tumor growth and invasion.2 Research investigating molecular pathways of tumor angiogenesis has led to the identification of a number of key molecules involved in the stimulation of new vessel growth from existing host vasculature. Many of these molecules, such as vascular endothelial growth factor and its main receptor vascular endothelial growth factor receptor 2 (VEGFR2 [Flk-1]), have become targets for antiangiogenic drugs.3 However, successful application of novel therapies that target tumor vasculature will require accurate selection of susceptible tumors and precise evaluation of early treatment response.
Traditional immunohistochemical analysis of target protein expression on biopsy specimens is suboptimal because of the invasive nature of this procedure and its susceptibility to sampling bias.4 Conventional methods of evaluating treatment response based on tumor size measurements with cross-sectional imaging also have some limitations. Because antiangiogenic therapy may not lead to substantial tumor mass or tumor volume reduction, particularly in the period immediately after therapy, conventional measurements of response may be insensitive or markedly delayed even when there may be a substantial therapeutic effect.5
Molecular ultrasonography can be an effective tool for studying angiogenesis because of its ability to couple information on molecular and cellular profiles of endothelial cells with information on perfusion and microvascular blood volume. There is growing interest in contrast-enhanced ultrasonography of angiogenesis. Weller et al6 showed the ability of ultrasonography to noninvasively detect tumor angiogenesis in vivo using an ultrasound contrast agent (UCA) targeted to tumor vasculature via conjugation with the tumor-binding peptide arginine-arginine-leucine. Leong-Poi et al7 and Ellegala et al8 showed that angiogenesis can be successfully characterized in vivo by using ultrasonography with microbubble contrast agents bearing antiintegrin antibodies adhered to fibroblast growth factor—stimulated vessels. This approach may be particularly advantageous in clinical oncology because these integrins have been implicated as markers of metastatic potential and poor prognosis in certain tumors.9 These pioneering studies were performed on clinical ultrasound scanners that provided images with relatively low resolution and were not fully suitable for accurate assessment of angiogenesis in murine tumor models.
Vascular endothelial growth factor receptor 2 is an appropriate target for molecular imaging and antiangiogenic treatment for several reasons. It is substantially upregulated on tumor vascular endothelium compared with surrounding normal vessels. In addition, it is primarily responsible for the proangiogenic effects of vascular endothelial growth factor via its downstream effector pathways.10 Thus, the aim of our study was to investigate the use of targeted contrast-enhanced high-frequency ultrasonography for molecular imaging of VEGFR2 expression on tumor vascular endothelium in murine models of breast cancer.
Materials and Methods
Animal Model
Adult nu/nu mice (18–20 g, 8–10 weeks of age) were purchased from Harlan Sprague Dawley, Inc (Indianapolis, IN), housed in pathogen-free facilities with a 12-hour light/dark cycle (6 AM–6 PM), and provided with rodent chow and tap water ad libitum. All animals received humane care in compliance with the institution’s guidelines. Animal procedures were approved by the Institutional Animal Care and Use Committee, which is certified by the American Association for Accreditation of Laboratory Animal Care.
Tumor Model
Murine breast cancer cells, 4T1 (American Type Culture Collection, Manassas, VA) and 67NR (generously provided by Fred Miller, PhD, Karmanos Cancer Institute, Detroit, MI; and Jin Chen, MD, PhD, Vanderbilt University), were cultured in RPMI 1640 medium and Dulbecco’s modified Eagle’s medium, respectively, supplemented with 10% fetal bovine serum and 1% penicillin/streptomycin. Cells were incubated at 37°C in a mixture of 5% carbon dioxide and 95% air. 4T1 and 67NR cells growing at 80% confluence were harvested, and a single cell suspension containing 5 × 10⁶ cells was resuspended in 100 μL of 1× phosphate-buffered saline and injected subcutaneously into 5 athymic nu/nu mice for each breast cancer cell type. To decrease image decorrelation due to respiration artifacts, tumors were placed on the hind limbs of the animals. Correct implantation was verified by the appearance of a wheal during injection. Animals were returned to their cages immediately after implantation. Tumors were allowed to grow until they reached 5 to 8 mm in maximal diameter, which typically occurred in 6 to 8 days.
Contrast Agent Preparation and Injection
The UCA MicroMarker (VisualSonics, Inc, Toronto, Ontario, Canada), specifically designed for high-frequency ultrasonography, was prepared and targeted according to manufacturer guidelines. The contrast agent preparation protocol was designed to achieve optimal saturation of the microbubble surface with a maximal amount of antibodies while minimizing the amount of free nonconjugated antibodies in the solution. The UCA was supplied as dry lyophilized streptavidin-coated phospholipid microbubbles filled with a mixture of nitrogen and perfluorobutane. The streptavidin was chemically attached to the phospholipid shell of the microbubbles via a polyethylene glycol spacer. The diameter of the microbubbles was 2 to 3 μm.
A vial of the dry UCA containing 9.2 × 10⁸ dry streptavidin-coated microbubbles was resuspended in 1.2 mL of sterile saline. Then, either 30 μg of biotinylated antimouse VEGFR2 antibodies (clone Avas12a1) or a biotinylated immunoglobulin G (IgG) isotype control (both purchased from eBioscience, Inc, San Diego, CA) was added per vial of contrast agent to produce either a VEGFR2-targeted or a control UCA.
Each mouse received boluses of both the VEGFR2-targeted UCA and the control UCA in random order with a 30-minute interval to minimize sequence bias. Each bolus contained 3.8 × 10⁷ microbubbles in 0.05 mL of saline and was followed by a 0.05-mL saline flush. To minimize UCA destruction during injection and maintain a consistent amount of microbubble delivery with each bolus, the UCA and saline were administered through a surgically implanted 26-gauge jugular vein catheter according to UCA manufacturer guidelines. During the injection, we visually monitored the opacity of the UCA to prevent microbubble destruction in the syringe or catheter. If microbubbles are destroyed, the suspension becomes transparent, and the contrast agent loses its effect. The targeted UCA used in this study showed no notable toxicity, and animals routinely recovered without difficulty after contrast-enhanced ultrasonography.
Image Acquisition and Quantification
During imaging, the mice were kept under anesthesia with 1.5% isoflurane in oxygen and restrained on a heated stage. All images were acquired with a Vevo770 high-frequency ultra-sound system (VisualSonics, Inc).
The scanner was equipped with a 40-MHz center frequency transducer with a mechanically scanned, single-element aperture. The dynamic range of the ultrasound scanner was 52 dB (radio frequency data). The system was set at 50% transmit power, resulting in a mechanical index of 0.14 (manufacturer specification). Images were acquired at a 20-Hz frame rate. The data were log compressed and digitized to 12 bits. Data were further compressed to 8 bits for screen display.
At a 6-mm focal distance, image resolution was 40 × 80 μm with a 9 × 9-mm field of view. The ultrasound probe was positioned 2 to 3 mm above the tumor so that the central portion of the tumor was contained within the focal zone of the ultrasound transducer. The probe position, gain settings, and midfield focus were initially optimized and maintained throughout each experiment. To decrease speckle variance, both the ultrasound probe and the animal were fixed and remained at the same position throughout the study.
The goal of the ultrasonographic image acquisition and analysis protocol (Figure 1) was to differentiate the backscattered acoustic signal due to microbubbles retained by the tumor from the background signal of the tumor itself and microbubbles still freely circulating in the bloodstream. Imaging was suspended for 4 minutes after injection. This time allowed binding and retention of targeted microbubbles while awaiting wash-out of the unbound contrast agent. After the 4-minute waiting period, approximately 200 ultrasonographic frames of the tumor were acquired at a temporal resolution of 10 seconds. Because UCA destruction by high-power ultrasound waves is required to detect an acoustic signal from microbubbles, a high-power ultrasound destruction sequence was then applied (20 cycles with a frequency of 10 MHz and a mechanical index of 0.59). After the destruction pulse, the system was reset with identical imaging parameters as before the destruction event, and another set of images (≈200 frames) was then acquired.
Figure 1.
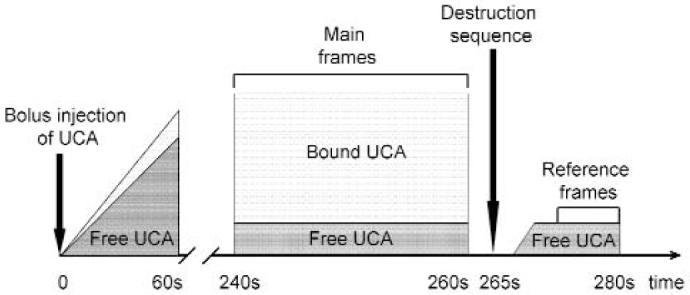
Ultrasonographic image acquisition and analysis protocol. The protocol allowed differentiation of the backscattered acoustic signal due to microbubbles specifically retained by tumor from the background signal. After UCA injection, we observed a rapid increase in ultrasound video intensity. After the 4-minute waiting period, approximately 200 ultrasonographic frames of the tumor were acquired at a temporal resolution of 10 seconds. A high-power ultrasound destruction sequence was then applied. After the destruction pulse, another set of images (≈200 frames) was then acquired. The difference in video intensity between predestruction and postdestruction ultrasonographic frames was calculated and expressed as video intensity amplitude. This value provided a relative measure of the amount of targeted microbubbles retained by the tumor.
Image processing and quantification were performed with the software implemented in the ultrasound scanner. Image processing used in the Vevo770 system relies on 2 sets of images: a predestruction set and a postdestruction (reference) data set. To prevent false readings, the positions of the ultrasound probe and animal were maintained as static as possible.
The average video intensity of predestruction and postdestruction (background) sonograms was measured in a region of interest encompassing the examined tumor. The difference in video intensity between predestruction and postdestruction ultrasonographic frames was calculated and expressed as video intensity amplitude (Figure 2). This value provided a relative measure of the amount of the UCA retained by the tumor.
Figure 2.

Predestruction and postdestruction video intensities for the control UCA (A) and the VEGFR2-targeted UCA (B) used to calculate video intensity amplitude. The average video intensity of predestruction and postdestruction (background) sonograms was measured and the difference in video intensity between the predestruction and postdestruction ultrasonographic frames was calculated and expressed as video intensity amplitude. This value provided a relative measure of the amount of targeted microbubbles retained by the tumor.
To conduct a comparison between predestruction and postdestruction frames, images from the predestruction set were paired to their partner images in the postdestruction set. Each pre-destruction frame was compared with each reference frame by an absolute-sum-of-differences technique. This allowed us to pair the two images that showed the smallest total difference (Equation 1):
| (1) |
Once the image pairs were calculated, the subtracted image was generated and displayed in shades of green on top of the B-mode image by a blending algorithm to provide a map of the spatial distribution of the UCA retained by the tissue (Figures 3 and 4).
Figure 3.

Molecular sonograms of a 4T1 tumor. A—C, Control UCA enhanced B-mode sonogram (A), color-coded background-subtracted image (B), and background-subtracted image imposed over a predestruction B-mode image (C). D—F, Vascular endothelial growth factor receptor 2—targeted UCA enhanced B-mode sonogram (D), color-coded background-subtracted image (E), and background-subtracted image imposed over a predestruction B-mode image (F). These images show a significant difference between retention of the control and VEGFR2-targeted UCAs in a small subcutaneous tumor (arrows). A difference in UCA retention between the tumor and surrounding muscle (M) was also noted.
Figure 4.

Molecular sonograms of a 67NR tumor. A—C, Control UCA enhanced B-mode sonogram (A), color-coded background-subtracted image (B), and background-subtracted image imposed over a predestruction B-mode image (C). D—F, Vascular endothelial growth factor receptor 2—targeted UCA enhanced B-mode sonogram (D), color-coded background-subtracted image (E), and background-subtracted image imposed over a predestruction B-mode image (F). These images show a significant difference between retention of the control and VEGFR2-targeted UCAs in a small subcutaneous tumor (arrows). A difference in UCA retention between the tumor and surrounding muscle (M) was also noted. In addition, the significantly higher retention of the VEGFR2-targeted UCA in the 67NR tumor compared with the 4T1 tumor was observed.
Tumor Tissue Evaluation
To assess the function of tumor vasculature, fluorescein isothiocyanate—conjugated tomato lectin (Lycopersicon esculentum, 1 mg/mL; Vector Laboratories, Inc, Burlingame, CA) was injected into the jugular vein (0.1 mL/mouse) 24 hours after ultrasonography.11 It was allowed to circulate for 5 minutes, after which the animals were killed. Tumors were dissected and preserved as previously described.11
Immunoblotting
Protein lysates from 4T1 and 67NR frozen tumors were prepared with the T-PER Tissue Protein Extraction Reagent (Pierce, Rockford, IL) supplemented with a phosphatase inhibitor mixture and a protease inhibitor mixture (Sigma-Aldrich Co, St Louis, MO) according to manufacturer specifications. Lysates were clarified by centrifugation (15,000g) for 15 minutes at 4°C. A sample buffer (200-mmol/L Tri-HCl, 6% sodium dodecyl sulfate, 2-mmol/L EDTA, 4% 2-mercaptoethanol, and 10% glycerol, pH 6.8) was added to the lysate. Sixty micrograms of each protein sample was then separated by sodium dodecyl sulfate-polyacrylamide gel electrophoresis (8% bis-acrylamide) for subsequent immunoblotting. Briefly, proteins were transferred to polyvinylidene difluoride membranes (Millipore Corporation, Billerica, MA) and blocked with 5% milk/1x Tris-buffered saline—Tween 20 (TBST) for 1 hour at room temperature. Membranes were incubated with primary antibodies overnight at 4°C. The primary antibodies used were a mouse monoclonal antibody for VEGFR2 (sc-6251, 1:200) and a monoclonal antiactin antibody (1:5000) from Santa Cruz Biotechnology, Inc (Santa Cruz, CA). Blots were washed 3 times for 10 minutes each with 1x TBST and probed with the appropriate horseradish peroxidase—conjugated secondary antibody (1:10,000; Sigma-Aldrich Co) for 1 hour followed by three 10-minute washes with 1x TBST. Enhanced chemiluminescence (Western Lightning Chemiluminescence Reagent Plus; PerkinElmer, Inc, Waltham, MA) was used to visualize immunoreactive proteins.
The VEGFR2 expression level was analyzed and densitometrically quantified with TotalLab software (Nonlinear Dynamics, Newcastle-Upon-Tyne, England). Western blots were scanned with a high-resolution flatbed scanner, and digital images of the immunoblotted membrane were generated. The mean gray intensity of VEGFR2 and corresponding actin bands, which served as internal controls, were measured for each tumor sample. The background intensity of the membrane was also measured and subtracted from each sample. The ratio of VEGFR2 to actin band density was calculated, expressed as a percentage, and used as a relative measure of VEGFR2 expression.
Histologic Evaluation
Dissected tumor samples ware cryopreserved, and immunohistochemical analysis on 10-μm cryosections was performed as previously described.11 The primary antibodies were rat anti-mouse VEGFR2 clone Avas12a1 (eBioscience, Inc) and rabbit anti-VEGFR2 IgG (a gift from Rolf Brekken, PhD, University of Texas Southwestern Medical Center, Dallas, TX). The antigens were visualized with appropriate secondary antibodies conjugated with Cy3 flourophore (Jackson ImmunoResearch Laboratories, Inc, West Grove, PA). Slides were mounted with Vectashield mounting medium containing 4′,6-diamidino-2-phenylindole (Vector Laboratories, Inc) to visualize cell nuclei. Digital images were acquired with a MicroFire digital camera (Optronics, Goleta, CA) connected to an Olympus BX-41 fluorescence microscope (Olympus Optical Co, Ltd, Tokyo, Japan).
Statistical Analysis
Results are expressed as mean ± SD. Video intensity amplitudes of contrast-enhanced sonograms were analyzed with the Mann-Whitney U test. Statistical significance was defined as P < .05.
Results
Subcutaneous tumors developed on all animals injected with 4T1 and 67NR tumor cells. Mean 4T1 and 67NR tumor sizes measured in the axial plane did not differ significantly. The 4T1 tumors measured 6.6 ± 0.7 mm (range, 5.8–7.6 mm), and the 67NR tumors measured 7.5 ± 0.5 mm (range, 6.8–8.2 mm).
Molecular Ultrasonography
4T1 Breast Cancer Model
Figure 3 shows representative B-mode, background-subtracted, and molecular sonograms of 4T1 breast cancer tumors imaged with the VEGFR2-targeted and control UCAs. There was a moderately intense signal from the VEGFR2-targeted UCA retained by the tumor. The corresponding images for the control UCA showed only a mild signal from retention of microbubbles in the tumor. Quantitative analysis of the contrast-enhanced sonograms showed that the video intensity amplitude for the control UCA was 7 ± 1.6 dB versus 15 ± 3.5 dB for the VEGFR2-targeted UCA (Figure 5A).
Figure 5.

Video intensity amplitudes for the control and VEGFR2-targeted UCAs in 4T1 (A) and 67NR (B) breast cancer tumors.
67NR Breast Cancer Model
Figure 4 shows representative B-mode and background-subtracted sonograms of 67NR breast cancer tumors imaged with the VEGFR2-targeted and control UCAs. Similar to 4T1 tumors, the control UCA showed very low retention in 67NR tumors. However, retention of the VEGFR2-targeted UCA in the vascular bed of 67NR tumors resulted in a great increase in the ultrasound signal intensity. The video intensity amplitude of the VEGFR2-targeted UCA in 67NR tumors was 50 ± 12.3 dB versus 12 ± 2.6 dB for the control UCA (Figure 5B).
When results of 4T1 and 67NR VEGFR2-targeted UCA imaging were compared, the mean video intensity amplitude in 67NR tumors (50 ± 12.3 dB) was significantly higher than that in 4T1 tumors (15 ± 3.5 dB; P < .01). Values of video intensity amplitude for the control UCA differed much less (12 ± 2.6 versus 7 ± 1.6 dB; P < .05).
Immunoblotting and Histologic Assessment of 4T1 and 67NR Tumors
To validate the results of ultrasonography using the VEGFR2-targeted UCA, 4T1 and 67NR tumors were harvested and subsequently analyzed for VEGFR2 expression by immunoblotting and immunocytochemistry.
Immunoblotting results in Figure 6 showed relatively lower VEGFR2 expression in the 4T1 tumor model (relative band density, mean ± SEM, 68% ± 7%) compared with 67NR tumors (107% ± 5%; P < .01).
Figure 6.
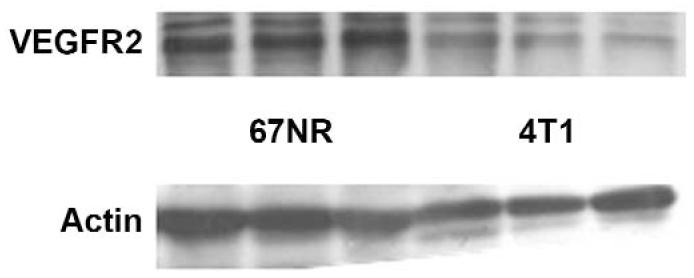
Immunoblots of VEGFR2 and an actin control in 3 representative 67NR and 3 representative 4T1 tumors. These results showed that 67NR tumors were characterized by relatively higher expression of VEGFR2 (relative band density, mean ± SEM, 107% ± 5%) of VEGFR2 than 4T1 tumors (68% ± 7%).
Immunofluorescent labeling for VEGFR2 showed consistently greater levels of VEGFR2 in the microvessels of tumors compared with capillaries of adjacent muscle tissue (Figure 7, A, B, E, and F). In addition, the number of VEGFR2-positive vascular structures was greatly increased in the 67NR tumors compared with the 4T1 tumors. Similar differences between the two tumor types were found when their vasculature was assessed by intravital labeling with endothelium-binding tomato lectin, which only detects functional blood vessels (Figure 7, C, D, G, and H). Taken together, the results of immunoblotting and histologic evaluation of 4T1 and 67NR tumors correlated with the ultrasound signal intensities obtained with the VEGFR2-targeted UCA.
Figure 7.

Histologic specimens of 4T1 and 67NR tumors. Tumor blood vessels were visualized by immunocytochemistry for VEGFR2 (A, B, E, and F) and by intravital labeling with fluorescein isothiocyanate—conjugated endothelium-binding tomato lectin (C, D, G, and H) (4′,6-diamidino-2-phenylindole [DAPI] nuclear counterstaining, original magnification x20).
Discussion
Angiogenesis plays an important role in many disease processes. For tumors, it appears to be a critical determinant of growth, invasion, and metastatic potential. Specific molecular markers of angiogenesis have been discovered on tumor endothelial cells. Identification and quantification of these markers in vivo can provide diagnostic and prognostic information and establish a basis for early antiangiogenic treatment response evaluation.
Current in vivo modalities for tumor angiogenesis imaging rely on the detection of abnormal perfusion, the microvascular blood volume, or vascular permeability. An alternate strategy is to detect the abnormal vascular endothelial cell phenotype with molecular imaging. The concept of molecular imaging is similar to that of immunohistochemistry, used by pathologists for microscopic examination and diagnosis of disease. Different imaging modalities, including dynamic contrast-enhanced magnetic resonance imaging and dynamic contrast-enhanced DCE computed tomography, have been evaluated as noninvasive techniques for assessing tumor vasculature.
Contrast-enhanced high-frequency ultrasonography has several important advantages over other molecular modalities for in vivo imaging of angiogenesis. It provides images with high spatial resolution (40 × 80 μm) and is comparatively portable and readily available. It uses contrast agents that remain exclusively intravascular, minimizing nonspecific signals from extravasated contrast material. In addition, ultrasonography is the only imaging modality capable of providing real-time imaging.
This study reports our initial experience with molecular high-resolution ultrasonography using a scanner specifically designed for small-animal imaging. We performed molecular imaging of VEGFR2 expression on tumor vascular endothelium in two different murine breast cancer models (4T1 and 67NR). After imaging, VEGFR2 expression in the tumors was analyzed by immunocytochemistry and immunoblotting to provide reference values of relative expression of VEGFR2. Although these data may not be directly comparable, our results indicate that the intensity of the molecular ultrasound signal from the bound VEGFR2-targeted UCA correlates with relative expression of VEGFR2 and the vascular phenotype of the tumor.
In our study, 67NR tumors showed increased density of VEGFR2-positive vascular structures by immunohistochemical analysis and high relative expression of VEGFR2 detected by immunoblotting. These findings correlated well with the higher intensity of the molecular ultra-sound signal from the bound VEGFR2-targeted UCA in this type of tumor. On the other hand, 4T1 tumors, which showed decreased density of VEGFR2-positive vascular structures and lower relative expression of VEGFR2, were characterized by significantly lower retention of the VEGFR2-targeted UCA.
In both examined tumor types, the control UCA labeled with an IgG isotype showed significantly lower retention compared with the VEGFR2-targeted UCA. We should note, however, that retention of the control UCA in 67NR tumors was slightly higher that in 4T1 tumors. This can be explained by some degree of non-specific binding of IgG isotype control antibodies to VEGFR2, more abundantly present in 67NR tumors.
Several limitations of this study should be addressed. The number of animals in this study was small but significant. Molecular imaging of VEGFR2 expression was performed in well-developed tumors (5–8 mm in diameter) during a rapid growth phase. At this point VEGFR2 expression is likely to be greatest. Thus, the usefulness and accuracy of VEGFR2-targeted UCA imaging at earlier and later stages of tumor development needs to be evaluated in the future.
The experimental design of this study was simplified by the assumption that VEGFR2-targeted and control microbubbles are identical in all respects except for the antibody. However, the configuration, size, and binging properties of VEGFR2-targeted and control UCAs may differ. This could be addressed by additional studies using competitive inhibition of a VEGFR2-targeted UCA binding with a free VEGFR2 antibody. Such studies will require information about affinity, binding dynamics of the VEGFR2 antibody, and the VEGFR2 turnover rate.
In this study, a 2-dimensional image acquisition method was used. Given the heterogeneity of tumor histologic characteristics, it is difficult to confirm that the region imaged on 2-dimensional ultrasonography was the same region assessed histologically. Therefore, future more standardized studies based on 3-dimensional contrast-enhanced ultrasonography are needed to determine the value of quantitative ultrasonographic assessment of VEGFR2 expression and to support the confidence in the outcome results within appropriate limits.
The intensity of the molecular ultrasound signal from the VEGFR2-targeted UCA reflects tumor vascularity and the level of the VEGFR2 protein produced by vascular endothelial cells. Both of these parameters should be taken into consideration for accurate evaluation of the molecular ultrasound signal from the VEGFR2-targeted UCA. In addition, the accuracy of VEGFR2 quantification using a targeted UCA may be limited by some degree of nonspecific binding, as shown in our study by the slight retention of the control UCA labeled with IgG. The method for molecular signal quantification used in this study assumes that the amount of the retained UCA is not influenced by tumor perfusion. However, tumor perfusion may be a factor that plays a role in modulating the intensity of the molecular signal from a targeted UCA.12 It is unclear at the moment whether there is a significant relationship between microvascular density and vascular architecture and targeted UCA binding. Relationships between blood flow velocity and targeted UCA affinity should also be investigated. Therefore, future studies combining VEGFR2-targeted ultrasonography with perfusion studies using a nontargeted UCA are required.
In conclusion, the results of our initial experience with targeted contrast-enhanced high-resolution ultrasonography have shown that it may enable in vivo molecular imaging of VEGFR2 expression on tumor vascular endothelium. This imaging modality may permit the molecular and functional assessment of tumor angiogenesis and could potentially be used in evaluating early tumor responses to antiangiogenic drugs.
Acknowledgments
We thank Fred Miller, PhD (Karmanos Cancer Institute, Detroit, MI), and Jin Chen, MD, PhD (Vanderbilt University), for supplying 67NR tumor lines used in this study and Alvin C. Powers, MD (Department of Medicine, Division of Diabetes, Endocrinology, and Metabolism, Vanderbilt University Medical Center), for assistance with histologic evaluation of tumor tissues. The study was partially supported by VisualSonics Inc (Toronto, Ontario, Canada).
Abbreviations
- IgG
immunoglobulin G
- TBST
Tris-buffered saline—Tween 20
- UCA
ultrasound contrast agent
- VEGFR2
vascular endothelial growth factor receptor 2
References
- 1.Floyd E, McShane TM. Development and use of biomarkers in oncology drug development. Toxicol Pathol. 2004;32:106–115. doi: 10.1080/01926230490425021. [DOI] [PubMed] [Google Scholar]
- 2.Folkman J. What is the evidence that tumors are angiogenesis dependent? J Natl Cancer Inst. 1990;82:4–6. doi: 10.1093/jnci/82.1.4. [DOI] [PubMed] [Google Scholar]
- 3.Boehm T, Folkman J, Browder T, O’Reilly MS. Antiangiogenic therapy of experimental cancer does not induce acquired drug resistance. Nature. 1997;390:404–407. doi: 10.1038/37126. [DOI] [PubMed] [Google Scholar]
- 4.Schor AM, Pendleton N, Pazouki S, et al. Assessment of vascularity in histological sections: effects of methodology and value as an index of angiogenesis in breast tumours. Histochem J. 1998;30:849–856. doi: 10.1023/a:1003437619956. [DOI] [PubMed] [Google Scholar]
- 5.Therasse P, Arbuck SG, Eisenhauer EA, et al. New guidelines to evaluate the response to treatment in solid tumors: European Organization for Research and Treatment of Cancer, National Cancer Institute of the United States, National Cancer Institute of Canada. J Natl Cancer Inst. 2000;92:205–216. doi: 10.1093/jnci/92.3.205. [DOI] [PubMed] [Google Scholar]
- 6.Weller GE, Wong MK, Modzelewski RA, et al. Ultrasonic imaging of tumor angiogenesis using contrast microbubbles targeted via the tumor-binding peptide arginine-arginine-leucine. Cancer Res. 2005;65:533–539. [PubMed] [Google Scholar]
- 7.Leong-Poi H, Christiansen J, Klibanov AL, Kaul S, Lindner JR. Noninvasive assessment of angiogenesis by ultrasound and microbubbles targeted to alpha (v)-integrins. Circulation. 2003;107:455–460. doi: 10.1161/01.cir.0000044916.05919.8b. [DOI] [PubMed] [Google Scholar]
- 8.Ellegala DB, Leong-Poi H, Carpenter JE, et al. Imaging tumor angiogenesis with contrast ultrasound and microbubbles targeted to alpha(v)beta3. Circulation. 2003;108:336–341. doi: 10.1161/01.CIR.0000080326.15367.0C. [DOI] [PubMed] [Google Scholar]
- 9.Gasparini G, Brooks PC, Biganzoli E, et al. Vascular integrin alpha(v)beta3: a new prognostic indicator in breast cancer. Clin Cancer Res. 1998;4:2625–2634. [PubMed] [Google Scholar]
- 10.Brekken RA, Overholser JP, Stastny VA, Waltenberger J, Minna JD, Thorpe PE. Selective inhibition of vascular endothelial growth factor (VEGF) receptor 2 (KDR/Flk-1) activity by a monoclonal anti-VEGF antibody blocks tumor growth in mice. Cancer Res. 2000;60:5117–5124. [PubMed] [Google Scholar]
- 11.Brissova M, Fowler M, Wiebe P, et al. Intraislet endothelial cells contribute to revascularization of transplanted pancreatic islets. Diabetes. 2004;53:1318–1325. doi: 10.2337/diabetes.53.5.1318. [DOI] [PubMed] [Google Scholar]
- 12.Lucidarme O, Kono Y, Corbeil J, et al. Angiogenesis: noninvasive quantitative assessment with contrast-enhanced functional US in murine model. Radiology. 2006;239:730–739. doi: 10.1148/radiol.2392040986. [DOI] [PubMed] [Google Scholar]