

Abstract
Purpose
Transport of the hepatobiliary scintigraphy agent Tc-99m mebrofenin (MEB) was characterized, and simulation studies were conducted to examine the effects of altered hepatic transport on MEB pharmacokinetics in humans.
Methods
MEB transport was investigated in Xenopus laevis oocytes expressing OATP1B1 or OATP1B3, and in membrane vesicles prepared from HEK293 cells transfected with MRP2 or MRP3. A pharmacokinetic model was developed based on blood, urine and bile concentration-time profiles obtained in healthy humans, and the effect of changes in hepatic uptake and/or excretion associated with disease states (hyperbilirubinemia and cholestasis) on MEB disposition was simulated.
Results
MEB (80 pM) transport by OATP1B1 and OATP1B3 was inhibited by rifampicin (50 µM) to 10% and 4% of control, respectively. MEB (0.4 nM) transport by MRP2 was inhibited to 12% of control by MK571 (50 µM); MRP3-mediated transport was inhibited to 5% of control by estradiol-17-beta-glucuronide (100 µM). A two-compartment model described MEB (2.5 mCi) systemic disposition in humans (systemic clearance=16.2±2.7 mL/min/kg); biliary excretion was the predominant route of hepatic elimination (efflux rate constants ratio canalicular/sinusoidal=3.4±0.8). Based on simulations, altered hepatic transport markedly influenced MEB systemic and hepatic exposure.
Conclusions
MEB may be a useful probe to assess how altered hepatic function at the transport level modulates hepatobiliary drug disposition.
Keywords: biliary excretion, Tc-99m mebrofenin, hepatic transport, pharmacokinetic modeling and simulation, OATPs, MRP2
INTRODUCTION
Technetium-99m (Tc-99m) mebrofenin (MEB) is an imino diacetic acid (HIDA) derivative commonly used in hepatobiliary scintigraphy (Fig 1). This class of agents was developed to couple selective liver uptake and rapid transit into bile with the gamma emitting properties of Tc-99m (1). MEB is used commonly in nuclear medicine to evaluate hepatobiliary dysfunction associated with the gallbladder, although broader uses, such as the evaluation of hepatocyte viability in vivo (2, 3) and the detection of genetic diseases that could affect excretion of compounds into bile (4, 5), have been proposed by several investigators. The kinetics of hepatic uptake, secretion into bile, and systemic disposition of MEB and analogs have been characterized in detail in preclinical species using invasive techniques (6, 7). In contrast, human kinetic studies have been limited to information derived from gamma images of patients undergoing a hepatobiliary scan for diagnostic purposes (1, 8). Thus, this information may not reflect the actual disposition of these compounds in healthy subjects. During the development of a clinical protocol to determine biliary excretion of drugs in humans, MEB was administered to healthy volunteers as a model compound that exhibited high biliary clearance (9); the blood, bile and urine data collected over time in this experiment provided unique information regarding MEB disposition that served as the basis for development of a pharmacokinetic model and subsequent simulation studies.
Fig 1. Structure of MEB.

This hepatobiliary imaging agent is an organic anion that consists of two molecules of mebrofenin chelating a central atom of Tc-99m.
Despite the extensive diagnostic use of MEB, the mechanisms responsible for the hepatobiliary disposition of this imaging agent in humans have not been investigated. The involvement of MRP2 (encoded by ABCC2)/Mrp2 (encoded by Abcc2) in the biliary excretion of MEB and analogs was suggested by the physico-chemical properties of MEB (MW=870 g/mol, one negative charge), case reports indicating lack of visualization of the hepatobiliary tree after MEB (or analog) injection in Dubin-Johnson patients (4, 5), and by reduced biliary excretion of a similar compound (Tc-99m HIDA) in Mrp2-deficient Wistar (TR−) rats (7). Dubin-Johnson syndrome is an autosomal recessive genetic disease caused by mutations in the MRP2 gene affecting expression, maturation and appropriate localization of the protein (10–15). In patients with Dubin-Johnson syndrome, MRP3 (encoded by ABCC3), a transport protein which is closely related to MRP2 and expressed on the basolateral membrane of hepatocytes, is present at higher levels than normal (16) to protect the liver from bilirubin conjugates and other organic anions that cannot be excreted into bile. The TR− rat strain has a hereditary mutation in the Abcc2 gene; like Dubin-Johnson patients, TR− rats exhibit impaired bilirubin excretion (due to the absence of canalicular Mrp2) and enhanced basolateral expression of Mrp3 (17, 18). Consistent with these alterations in TR− rats, deficient biliary excretion of N-acetyl-leukotriene E4, an Mrp2 substrate, was compensated by leukotriene urinary excretion; interestingly, mean liver transit time was increased more than 3-fold in TR− compared to normal Wistar rats (19).
Published in vitro studies have implicated a Na+-independent process in the uptake of a MEB analog into rat hepatocytes (20). Bilirubinemia enhances MEB urinary excretion in humans (21). OATP1B1 (encoded by SLCO1B1) and OATP1B3 (encoded by SLCO1B3), Na+-independent hepatic transport proteins, are responsible for the hepatic uptake of bilirubin and its glucuronide metabolites. Clinical reports suggest an interaction between bilirubin and MEB for hepatic uptake (22). These findings support the hypothesis that members of the OATP/SLCO family of transporters are responsible for hepatic uptake of MEB.
The purpose of the current study was to characterize the mechanisms of hepatic uptake and excretion of MEB using Xenopus laevis oocytes expressing OATP1B1 or OATP1B3, and membrane vesicles prepared from HEK293 cells transfected with MRP2 or MRP3, since these proteins have been implicated in MEB hepatobiliary transport as described above. Additionally, upon development of a pharmacokinetic model to describe the kinetics of MEB distribution and elimination in healthy subjects, simulations of hypothetical changes in MEB disposition associated with certain disease states that alter hepatic transport (hyperbilirubinemia, inflammation-induced cholestasis and obstructive cholestasis) were performed. Clinical studies to establish the impact that such changes would have in humans for MEB, and drugs with similar hepatic handling processes, are extremely difficult to perform. These simulations, on the other hand, examined the effect of such changes, and may facilitate recognition of similar disease state-drug interactions in the clinic if/when they occur.
METHODS
Chemicals
Tc-99m mebrofenin (Choletec®, Bracco Diagnostics, Princeton, NJ) was prepared at the Nuclear Medicine pharmacy, UNC Hospitals, and radiochemical purity was evaluated by thin layer chromatography (TLC) using instant TLC with polysilicic acid (ITLS-SA) as the stationary phase and 20% sodium chloride as the mobile phase (23). Solutions employed in the in vitro experiments had a radiochemical purity ≥ 90%. Estradiol-17-β-D-glucuronide (E217βG), rifampicin, AMP, ATP, pyruvic acid and gentamicin sulfate were purchased from Sigma Chemical Co (St. Louis, MO); creatine phosphate, creatine kinase and protease inhibitor cocktail tablets (Complete™) were purchased from Roche Diagnostics (Indianapolis, IN), and MK571 was purchased from Cayman Chemical Co (Ann Arbor, MI). [3H]E217βG (39.8 Ci/mmol, purity > 97%) was obtained from Perkin Elmer Life Sciences (Boston, MA, USA). All other chemicals were of reagent grade and were readily available from commercial sources.
Oocyte Uptake Studies
Xenopus laevis oocytes injected with human OATP1B1 and OATP1B3 cRNA were acquired from BD Bioscience (Transportocytes, BD Gentest™, Woburn, MA). In preliminary experiments, the suitability of uninjected oocytes versus water-injected oocytes as controls was established. Upon receipt, oocytes were inspected visually, and the viable cells were maintained for 24 hr at 18°C in oocyte Ringer's 2 buffer (OR-2: 82.5 mM NaCl, 2.5 mM KCl, 1 mM Na2HPO4, 3 mM NaOH, 1 mM CaCl2, 1 mM MgCl2, 1 mM pyruvic acid, and 5 mM HEPES, pH 7.6) supplemented with 0.05 mg/ml gentamicin sulfate, 1.5 mM sodium pyruvate and 5% heat-inactivated horse serum. Uptake was determined according to the method described by Bow et al. (24). In brief, oocytes were incubated at 18 to 22°C over 60 min in OR-2 containing MEB (10 µCi/ml or 80 pM). The effect of rifampicin (50 µM), a well-characterized inhibitor of OATP proteins, on MEB uptake at the 60-min time point was measured. Subsequently, the oocytes were rinsed three times in ice-cold OR-2 and placed into individual vials for immediate analysis of associated radioactivity by gamma scintillation counting using a TN-1750 Multichannel Analyzer (Tracor Northen, Middleton, WI). MEB uptake was calculated in picoCi per oocyte.
MRP2 and MRP3 Expression Vectors and Transfections in HEK293 Cells
The construction of vectors containing MRP2 [pcDNA3.1(−)MRP2] and MRP3 [pcDNA3.1(+)MRP3] has been described previously (25, 26). pcDNA3.1(−)MRP2 and pcDNA3.1(+)MRP3 were a kind gift from Dr. Susan P.C. Cole and Dr. Roger G. Deeley (Queen’s University, Kingston, ON, Canada) and were transfected into SV40 transformed human embryonic kidney cells (HEK293). HEK293 cells were seeded at 5.8×10⁶ cells per 162 cm2 flask and transfected 24 hr later with 16.8 µg of plasmid DNA using FuGENE 6 (Roche Diagnostics) according to the manufacturer’s instructions. After 72 hr, cells were harvested as described previously (27).
Membrane Vesicle Preparation
Plasma membrane vesicles from MRP2 and MRP3 transfected HEK293 cells were prepared as described, with modifications (27). Briefly, cells were homogenized in buffer containing 250 mM sucrose, 50 mM Tris pH 7.5, 0.25 mM CaCl2 and protease inhibitor cocktail tablets. Cells were disrupted by N2 cavitation (5 min equilibration at 200 psi) and then released to atmospheric pressure, and EDTA (1 mM) was added. The suspension was centrifuged at 800×g at 4°C for 10 min and the supernatant was layered onto a 10 ml cushion of 35% (w/w) sucrose, 50 mM Tris pH 7.4 . After centrifugation (100,000×g at 4°C for 1 h), the interface was removed and placed in a 25 mM sucrose, 50 mM Tris, pH 7.4 solution and centrifuged at 100,000×g at 4°C for 30 min. The membranes were washed with Tris sucrose buffer (250 mM sucrose, 50 mM Tris, pH 7.4) and then resuspended by vigorous syringing with a 27-gauge needle. Protein concentrations were determined using a BCA protein assay (Pierce Chemical, Rockford, IL) and aliquots of membrane vesicles were stored at −80°C.
[3H]E217βG and Tc-99m Mebrofenin Transport Studies
Transport assays were carried out by a rapid filtration method as described previously (27). Membrane vesicles (8 µg of protein per time point) were incubated at 37 °C in a final volume of 60 µl. The transport assay buffer used was Tris (50 mM, pH 7.5)/sucrose (250 mM), and contained ATP or AMP (4 mM), MgCl2 (10 mM), creatine phosphate (10 mM), creatine kinase (100 µg/ml), and E217βG (120 nCi, 400 nM) or MEB (50 µCi/mL or 0.4 nM). At the indicated time points, 19 µl (for time courses) or 60 µl (single time points) of transport reaction mixture was removed and placed in 800 µl of Tris sucrose buffer and filtered through glass fiber filters (type A/E; Pall Life Sciences, East Hills, NY), washed twice, and radioactivity was quantitated by liquid scintillation counting (Packard Tricarb, Packard Corp., Meriden, CT,) and by gamma scintillation counting using a TN-1750 Multichannel Analyzer. Transport in the presence of AMP was subtracted from transport in the presence of ATP and reported as ATP-dependent E217βG or MEB transport. The effects of potential modulators of MEB transport [MK571 (50 µM) and E217βG (100 µM)] were measured at a single time point of 3 min.
In Vitro Tc-99m Mebrofenin Protein Binding
Plasma samples containing a range of MEB concentrations (1–160 nCi/mL) were obtained from a healthy subject participating in the clinical study described below. Samples were centrifuged (1000×g) at room temperature using Centrifree® ultrafiltration devices equipped with YMT membranes (Millipore Corporation, Bedford, MA). Centrifugation in a fixed angle rotor varied from 3 to 5 min, depending on the time required to yield approximately 10% of the sample volume as ultrafiltrate. Initial studies were conducted to validate that MEB did not bind to the device or the membrane.
Clinical Study
The study design and results have been reported in detail previously (9). All procedures were approved by the Clinical Research Advisory Committee and the Committee on the Protection of the Rights of Human Subjects of the University of North Carolina at Chapel Hill School of Medicine. Subjects provided written informed consent prior to participation in the study. Subjects received a 2.5-mCi IV bolus dose of MEB (Squibb Diagnostics, Princeton, NJ) approximately equivalent to 20 pmoles and anterior gamma scintigraphic images of the abdomen were acquired for three hours. Biliary secretions were aspirated continuously through an oro-enteric catheter positioned in the duodenum; blood samples and biliary secretions were collected throughout the study, and urine was collected at the final timepoint (180 minutes post dose). Two hr after MEB administration, cholecystokinin-8 (CCK-8; sincalide; 0.02 µg/kg; Bracco Diagnostics, Princeton, NJ) was administered to facilitate contraction of the gallbladder; gallbladder ejection fraction (EF) was calculated from the abdominal images as detailed previously. Biliary and urinary recovery were calculated as the percentage of the administered dose that accumulated in bile and urine, respectively, at the end of the experiment. The biliary recovery of MEB was corrected by the EF to obtain the percentage of the excreted dose (XGB) as described previously (9).
Pharmacokinetic Modeling
A number of different models were developed using the concentration- and mass-time profiles from a representative subject (Subject 4) to describe MEB disposition. These models consisted of a central compartment, one or more peripheral compartments, a gallbladder compartment, and two terminal elimination compartments in order to account for the amount of radioactivity collected in bile and urine. All processes were assumed to be approximately linear in these experimental conditions (only trace amounts of MEB were administered) and were represented by first-order rate constants. MEB was administered as a single IV bolus in one arm with intense blood sampling at early time points from the contralateral arm. During the first few minutes of sampling, instantaneous distribution was not achieved, and for this reason initial blood concentrations up to Cmax were ignored in the development of the pharmacokinetic model. Differential equations describing the mass balance of the compound in the compartments were fit simultaneously to blood, urine and bile concentration-time profiles using nonlinear least-squares regression (WinNonlin Pro version 4.2; Pharsight, Mountain View, CA). Model selection was based on Akaike’s Information Criterion, the residual sum of squares, and visual inspection of the residual plots and of model fitting to the concentration- and mass-time profiles. A weighting scheme was developed to account for the relative contribution of each data set to the overall number of data points, due to the disparity in the number of observations among the data-supported functions. Each data point was assigned a weight of where n is the fraction of the total number of data points that support a particular function. The optimal model that best described the data is shown in Fig 2. This model included a central compartment that described the blood concentration-time profiles, where Vc and Cc represented the volume of distribution and concentration of MEB in the central compartment, respectively, and a peripheral compartment (liver) that represented the hepatocytes, from which unidirectional elimination into bile (collected in the duodenum) was characterized by k20. The amount of MEB in the liver, bile and urine compartments was expressed as Xliver, Xbile and Xurine, respectively. Urinary elimination was described by unidirectional elimination from the central compartment (k10). The egress of MEB from the liver compartment into the central compartment was described by k21. The following differential equations described MEB disposition in healthy volunteers:
Fig 2. Scheme of the pharmacokinetic model describing the disposition and elimination of MEB in humans.

X0 represents the IV bolus dose. Cc is the concentration of MEB in the central compartment (blood) and Vc is the central compartment volume. All other compartments were modeled as amounts [in urine (Xurine), in the hepatocytes (Xliver) and in the gallbladder (GB) estimated as duodenal bile corrected for EF (XGB)]. All rate constants were assumed to be first-order: k12 represents hepatic basolateral uptake, k21 represents hepatic basolateral excretion, k20 represents hepatic canalicular excretion, and k10 represents the rate constant for renal elimination.
Taking the Laplace transform of and solving the differential equations for s=0, after rearrangement the integrated form of Cc through infinite time (area under the curve or AUC0–∞) can be obtained:
A model dependent mean systemic clearance was calculated from the mean parameters in Table I as follows:
In addition, pharmacokinetic parameters such as AUC and systemic clearance (Cltotal) were calculated by standard noncompartmental analysis using the trapezoidal rule with extrapolation to infinity for AUC0–∞, and the administered dose divided by the AUC0–∞ for the calculation of Cltotal , as reported previously (9).
Pharmacokinetic Simulations
MEB may be an ideal probe to assess the ability of the liver to clear drugs excreted through similar pathways (e.g., hepatic uptake by OATP1B1/1B3 and hepatic excretion by MRP2/3). A major limitation to understanding the impact of disease states on MEB disposition is that actual clinical data illustrating these changes has not been published and is not readily obtainable. For these reasons, mathematical simulations were conducted to examine how modulation of basolateral and/or canalicular transport would impact MEB blood and liver concentrations under different conditions, and to investigate the utility of this probe to evaluate the impact of such alterations for drugs with similar hepatic handling. In these simulations, it was assumed that the rate constant k12 was associated with OATP-mediated hepatic uptake, k20 described MRP2-dependent canalicular excretion, k21 was associated with hepatic basolateral efflux of MEB and the rate constant for renal elimination was assumed to remain constant. Changes were made in the estimates of the first-order rate constants obtained from pharmacokinetic modeling of the healthy subjects’ data, as summarized below, to simulate the effect of various disease states on MEB distribution and elimination. Elevated plasma bilirubin concentrations are associated with higher MEB blood concentrations in patients with jaundice. Additionally, in patients with mean serum bilirubin levels of 9.8 mg/dL MEB urinary excretion reached up to 11.5% of the dose at 3 hours after administration (21); this clinical scenario was simulated by reducing k12 2.5- and 5-fold. In inflammation-induced cholestasis, the expression of organic anion transport proteins on the basolateral and canalicular membranes is reduced (28); this was simulated by decreasing k12 5-fold and decreasing k20 2-fold. Finally, in obstructive cholestasis, Mrp2 expression has been reported to be reduced, while Mrp3 expression is increased in bile-duct ligated rats (18, 28); obstructive cholestasis was simulated by decreasing k20 3-fold and increasing k21 5-fold.
RESULTS
Tc-99m mebrofenin transport by OATP1B1 and OATP1B3
An Na+-independent process was found to be responsible for the uptake of a MEB analog into rat hepatocytes (20), This observation also was confirmed for MEB based on data generated in our laboratory; MEB was not transported by NTCP in transfected HEK293 cells (results not shown).
MEB (10 µCi/mL or 80 pM) uptake by uninjected, OATP1B1- and OATP1B3-expressing oocytes was measured over 60 min (Fig 3A). Transport was linear up to 30 min in oocytes expressing OATPs. After 30 min, OATP1B1 transport reached a plateau. Uninjected oocytes did not show any significant transport of MEB. Co-incubation of the oocytes with 50 µM rifampicin, a potent inhibitor of OATP-dependent transport (29), inhibited MEB uptake over 60 min to ~10% and ~4% of untreated control values in OATP1B1- and OATP1B3-expressing oocytes, respectively (Fig 3B).
Fig 3. MEB uptake in Xenopus laevis oocytes expressing human OATP1B1 and OATP1B3.
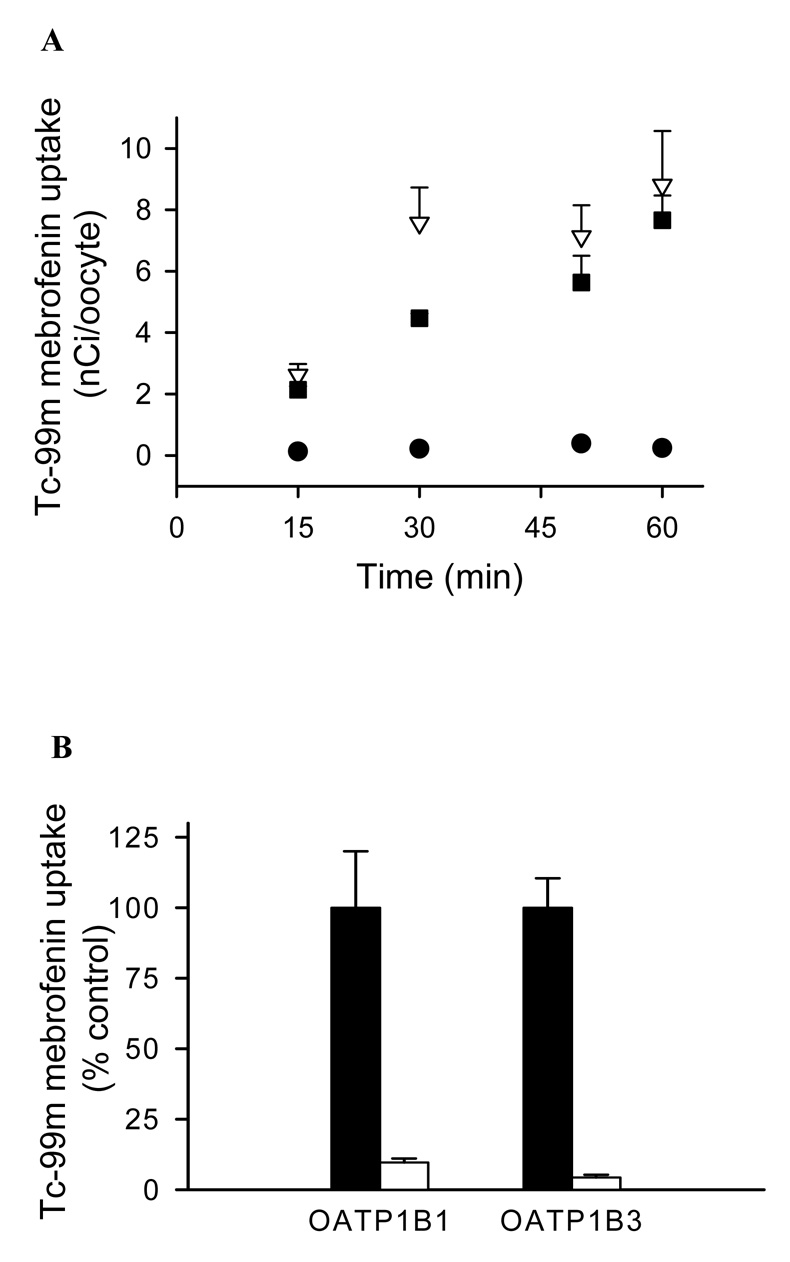
Uptake was measured at room temperature with a MEB concentration of 10 µCi/mL (80 pM). Bars and data points represent mean (± SEM) of 5–8 oocytes in a single experiment. Similar results were obtained in an additional independent experiment.
(A) Time course of MEB uptake by uninjected oocytes (control,●), OATP1B1- (▽) and OATP1B3- (■) expressing oocytes.
(B) Inhibition of OATP1B1- and OATP1B3-mediated uptake of MEB by rifampicin. Oocytes expressing OATP1B1 and OATP1B3 were incubated for 60 min with MEB (80 pM) in the presence (open bar) and absence (closed bar) of rifampicin (50 µM). Results are presented as a percentage of untreated oocytes expressing the same protein.
Tc-99m mebrofenin transport by MRP2 and MRP3
ATP-dependent uptake of MEB by inside-out membrane vesicles prepared from HEK293 cells transiently transfected with MRP2 or MRP3 was determined (Fig. 4). Control experiments to measure the uptake of [3H]E217βG, a well-characterized substrate for both MRP2 and MRP3, were performed at a single time point (3 min) to ensure that membrane vesicles were functional. Consistent with previously published data, uptake of [3H]E217βG in membrane vesicles prepared from untransfected, as well as MRP2 and MRP3 transfected HEK293 cells was 6.24, 16.1 and 102 pmol/mg protein, respectively (25). MEB (50 µCi/mL or 0.4 nM) uptake into membrane vesicles prepared from MRP2 transfected HEK293 cells was linear for up to 3 min (Fig 4A); uptake was more extensive than in vesicles from MRP3 transfected HEK293 cells at 3 min (~23 vs. 5 nCi/µg protein) as shown in Fig 4A. Transport of MEB by MRP3 was linear for up to 3 min, at which time 5 nCi/µg protein had accumulated and uptake began to plateau. Membrane vesicles prepared from untransfected HEK293 cells had no significant transport activity.
Fig 4. MEB transport by membrane vesicles prepared from HEK293 cells transiently transfected with MRP2 or MRP3.

(A) A time course of MEB ATP-dependent transport by control (●), MRP2 (▽) and MRP3 (■) membrane vesicles. Transport was measured at 37°C with a MEB concentration of 50 µCi/mL (0.4 nM). Data points represent mean (± SD) of triplicate determinations in a single experiment.
(B) Inhibition of MRP2- and MRP3-mediated ATP-dependent transport of MEB. Membrane vesicles were incubated for 3 min with MEB (0.4 nM) in the presence (open bar) and absence (closed bar) of E217βG (100 µM) for MRP3 inhibition, and MK571 (50 µM) for MRP2 inhibition. Results are expressed as a percentage of untreated membranes. Bars represent mean (± SD) of triplicate determinations in a single experiment.
Several MRP2 and MRP3 substrates have been shown to be competitive inhibitors of MRP2 and MRP3 transport. E217βG (100 µM) inhibited ATP-dependent MRP3-mediated transport of MEB (0.4 nM) to ~5% of control (Fig. 4B). Unexpectedly, MRP2-dependent transport of MEB was not inhibited by the same concentration of E217βG, possibly due to a higher affinity of MRP2 for MEB than E217βG. MRP2 transport of MEB (0.4 nM) was inhibited (to ~12% of control) by MK571 (50 µM), a leukotriene D4 receptor antagonist commonly used as a general MRP inhibitor.
Pharmacokinetic modeling of Tc-99m mebrofenin disposition in healthy subjects; disease state simulations
The model depicted in Fig 2 was suitable for describing MEB disposition in all subjects. The goodness of fit of this model to each data set for all subjects is shown in Fig 5 A–D. The parameter estimates and associated coefficients of variation for k10, k12, k21, k20 and Vc in all four subjects are reported in Table I together with the administered dose and the cumulative amounts of MEB excreted into bile and urine, which were used as input for the pharmacokinetic modeling studies (9). The model clearly supports the hypothesis that a fraction of hepatic MEB is effluxed back into sinusoidal blood and is available for urinary excretion or reuptake by the liver. In all subjects, the ratio between the canalicular (k20) and basolateral (k21) efflux rate constants exceeded 2.5 (k20/k21 = 3.4±0.8, mean ±SD), suggesting that once in the liver, the predominant process that determines MEB fate is excretion into bile. The small volume of distribution for the central compartment (Vc) suggests that this represents the blood pool. Additionally, the systemic clearance, calculated from the individual parameters shown in Table I and the equation in the Methods section (16.2 ± 2.7 ml/min/kg), was in excellent agreement with the value obtained from noncompartmental analysis (17.3 ± 1.7 mL/min/kg) (9).
Fig 5. panels A–D: MEB disposition in Subjects 1 (A), 2 (B), 3 (C) and 4 (D).


The solid curves represent the fit of the pharmacokinetic model based on the scheme depicted in Fig 2 to the data. The blood concentration-time profiles (◆) are shown on a log-linear scale (left axes), while bile (●) and urine (▲) amount vs. time profiles are plotted on a Cartesian scale (right axes). Symbols represent actual data points while lines represent the fit of the model to the data.
Table I.
MEB biliary and urinary recovery and pharmacokinetic parameters in healthy volunteers.a
| Subject 1 | Subject 2 | Subject 3 | Subject 4 | Mean | S.D. | |
|---|---|---|---|---|---|---|
| *Dose (µCi) | 2188 | 2072 | 2282 | 2476 | 2255 | 171 |
|
*Urinary Recovery (% of dose) |
0.7 | 0.5 | 0.8 | 0.5 | 0.6 | 0.2 |
|
*Biliary Recovery corrected for EF (% of dose) |
70.9 | 89.1 | 91.9 | 84.9 | 84.2 | 9.3 |
| Parameter Estimate (CV%) |
||||||
| K12 (min−1) | 0.11 | 0.17 | 0.22 | 0.23 | 0.18 | 0.05 |
| (8.85) | (10.1) | (16.2) | (7.23) | |||
| K21 (min−1) | 0.0018 | 0.0052 | 0.0035 | 0.0033 | 0.0034 | 0.0014 |
| (21.8) | (19.4) | (59.7) | (21.9) | |||
| K20 (min−1) | 0.0073 | 0.013 | 0.015 | 0.011 | 0.012 | 0.003 |
| (0.65) | (0.82) | (1.23) | (0.48) | |||
| K10 (min−1) | 0.00066 | 0.00063 | 0.0014 | 0.00087 | 0.0009 | 0.0004 |
| (9.87) | (15.0) | (20.6) | (15.6) | |||
| Vc (L/kg) | 0.15 | 0.13 | 0.11 | 0.09 | 0.12 | 0.02 |
| (8.65) | (9.99) | (17.8) | (8.51) | |||
| Ratio K20/K21 | 4.0 | 2.6 | 4.3 | 3.4 | 3.4 | 0.77 |
from (9)
Biliary and urinary recovery of MEB was measured after IV administration to 4 healthy human volunteers (9). The biliary recovery was corrected for the degree of gallbladder contraction in response to pharmacological stimulation, thereby correcting the amount of MEB recovered in bile for the residual amount remaining in the gallbladder. The individual parameter estimates and associated variability for the first-order rate constants (see Fig. 2 legend for parameter definitions) and the volume of the central compartment (Vc) were obtained from pharmacokinetic modeling of MEB disposition data.
Simulations were performed using the mean values for the pharmacokinetic parameters derived from modeling the data as detailed in Table I. Based on these simulations, ~22% of the dose remained in blood 10 min after administration of MEB, which was consistent with the mean value of 17% reported in the literature for normal subjects(21). The simulated percentage of the dose recovered in urine at 3 hr was ~0.6 %, which was similar to the average urinary excretion of 0.4–2.0% of the dose reported in previous clinical studies (21). In the four healthy subjects enrolled in this clinical study, MEB renal clearance was 5–13 mL/min. In vitro protein binding studies revealed that the unbound fraction of MEB in plasma was ~10%. For a compound with these characteristics, the expected renal clearance would be 12 mL/min if glomerular filtration was the predominant process determining renal clearance. These data suggest that urinary excretion of MEB is primarily a passive process driven by glomerular filtration. Since MEB renal clearance is minimal, only the rate constants for hepatic uptake and efflux were modified in the simulation study.
Alterations in the hepatic uptake and/or excretion of MEB due to pathophysiological abnormalities such as hyperbilirubinemia and cholestasis were examined using mathematical simulations, and simulated changes in blood MEB concentrations are depicted in Fig. 6A. Impaired hepatic uptake of MEB, due to elevated plasma bilirubin caused an increase in MEB blood concentrations; this phenomenon also has been observed clinically in patients with jaundice (21) where the MEB blood concentrations were twice or more than in healthy subjects. For pathologies in which biliary excretion processes were impaired (obstructive and inflammation-induced cholestasis), the concentrations in blood remained elevated for a prolonged period of time because of more extensive hepatic accumulation of MEB which increased the driving force for excretion of MEB back into blood via MRP3. MEB hepatic disposition based on the simulation studies is depicted in Fig. 6B. Impaired hepatic uptake of MEB would, as expected, lower hepatic exposure and delay the Cmax in the liver. On the other hand, impaired biliary excretion due to cholestasis resulted in prolonged hepatic exposure to MEB.
Fig 6. Simulations of MEB disposition in blood and liver of patients with altered hepatic uptake and/or excretion consistent with hyperbilirubinemia, inflammation-induced cholestasis and obstructive cholestasis.

Predicted modifications in the blood concentration-time profiles (A) and in the hepatic exposure over time (B) due to various liver pathologies. The solid line represents the simulated profile in healthy volunteers. Simulations were designed to reflect changes due to mild hyperbilirubinemia [dotted line; 2.5-fold impaired hepatic uptake (k12) of MEB], intermediate hyperbilirubinemia [dashed line; 5-fold impaired hepatic uptake (k12) of MEB], inflammation-induced cholestasis [dash-dotted line; 5-fold impaired hepatic uptake (k12) of MEB with 2-fold impaired biliary excretion (k20)], and obstructive cholestasis [long dashed line; 3-fold impaired biliary excretion (k20) with induction of basolateral transport (5-fold increase in k21 )].
DISCUSSION
This series of studies was designed to characterize the disposition of MEB in humans. Using in vitro tools, several transport proteins were implicated in the hepatic uptake and excretion of MEB. Based on pharmacokinetic modeling and simulation studies, the in vivo disposition and elimination of MEB was described in healthy volunteers, and various scenarios were simulated to evaluate the possible impact of disease states on MEB disposition.
The OATP family is responsible for the uptake of a very broad range of substrates, preferentially anionic amphipathic compounds such as bile acids, bilirubin and other compounds/metabolites with high molecular weight that bind to plasma albumin and are excreted ultimately into bile (30). MEB has a high molecular weight and a negative charge; accordingly it was not surprising to find that OATP1B1 and OATP1B3 expressed in oocytes transported this compound. In the liver, OATP1B1 also is responsible for the basolateral uptake of bilirubin and its glucuronide metabolites (22). Elevated plasma bilirubin concentrations have been reported to impair hepatic uptake and enhance urinary excretion of MEB, presumably by competing for OATP-mediated transport into the liver (21). The potential role of OATP2B1 in MEB hepatic uptake could not be examined directly in the present studies because a transfected system expressing this transport protein was not readily available. The finding that membrane vesicles prepared from HEK293 cells transfected with MRP2 or MRP3 transported MEB is in good agreement with clinical observations in patients with Dubin-Johnson syndrome, as well as experiments in TR− rats (4, 5, 7). Additionally, in vitro studies have shown that an analog of MEB, Tc-99m HIDA, is transported by MRP2 and MRP1 (7), however, MRP1 expression in healthy human liver is almost negligible (31). In the liver, MRP2 mediates the excretion of endogenous and exogenous organic anions and conjugates across the canalicular membrane into bile (32). The basolateral transport protein MRP3 shares tissue distribution and substrate specificity with MRP2, and these transporters play a complementary role in hepatic detoxification; in disease states where MRP2 is absent or down-regulated, MRP3 is induced several fold (33, 34).
The pharmacokinetic model adequately described all data sets from the four healthy subjects and there was low variability associated with parameter estimates in all subjects. Following hepatic uptake, MEB is transported into bile and can be excreted from the hepatocyte back into blood. The terminal phase of the MEB blood concentration-time profile may be due to egress into blood by the efflux transport protein MRP3, located on the basolateral membrane of hepatocytes. This excretory process is required in the pharmacokinetic model (k21) and, interestingly, a similar process has been described in preclinical studies using extensive invasive sampling in dogs (6). The in vitro findings in this study demonstrated that OATP1B1, OATP1B3, MRP2 and MRP3 could play a role in the hepatobiliary disposition of MEB in humans.
Drug elimination by the kidney is the result of glomerular filtration, active secretion and active reabsorption (when transport processes are involved). This differs from hepatic elimination of drugs that relies heavily on uptake (active or passive) of compounds into the hepatocyte. The renal clearance in the four subjects enrolled in this study was within the range of normal glomerular filtration, when MEB plasma protein binding was taken into account. The possibility that other transport proteins, such as MRP4, contribute to the urinary excretion of this drug cannot be excluded. However, renal clearance of MEB accounts for ~1 % of total clearance, emphasizing that this is a minor route of elimination under normal conditions.
The findings from the in vitro experiments, coupled with the results of the pharmacokinetic modeling, were used in simulation studies to predict the potential impact of disease states on MEB disposition. Since these clinical studies are complex and not easily undertaken, simulations can be very valuable to predict the fate of drugs in states of altered hepatic transport. For example, simulations predicted that patients with obstructive cholestasis would exhibit significant differences in the blood mass-time profiles of MEB, compared to patients with hyperbilirubinemia. Additionally, the pharmacokinetic modeling and simulations provided important information regarding the hepatic exposure of MEB. Typically, it is not possible to quantify liver exposure to drugs in humans, but changes in hepatic accumulation could be an important cause of hepatotoxicity. The simulations were particularly useful in examining the impact of impaired hepatic uptake and biliary excretion processes, and in appreciating the differences in hepatic accumulation when both processes were inhibited. MEB liver exposure in a disease state like inflammation-induced cholestasis, where hepatic uptake and biliary excretion are impaired, would differ from the predicted hepatic exposure in the presence of hyperbilirubinemia alone. Simulations of inflammation-induced cholestasis revealed that liver exposure increased ~25% compared to normal subjects. These differences in hepatic accumulation may be relevant in cases where the drug affected by this interaction has hepatotoxic potential during prolonged liver exposure. Additionally, hepatotoxicants that are handled by the liver in a manner similar to MEB may cause significant toxicity in patients with obstructive cholestasis, where biliary excretion is impaired and a compensatory increase in hepatic egress occurs. Simulations of obstructive cholestasis revealed that liver exposure was increased 60% compared to normal subjects, these results are in accordance with changes in transit time through the liver that Guhlmann et al. observed for N-acetyl LTE4 in rats with cholestasis due to bile duct obstruction (19).
CONCLUSION
In conclusion, these studies identified hepatic transport proteins that likely are involved in the hepatobiliary disposition of MEB and characterized the disposition of this probe in healthy humans. The simulations suggested that pharmacokinetic studies with MEB may be a useful in vivo clinical tool to assess the potential impact of altered hepatic uptake and/or excretion due to disease states (e.g., hyperbilirubinemia, cholestasis). A probe of this nature may be particularly useful in determining the functional consequences of genetic polymorphisms in hepatic transport proteins and the likelihood of prolonged hepatic exposure to hepatotoxicants.
AKNOWLEDGEMENTS
This work was supported by National Institutes of Health grant R01 GM41935 and grant RR00046 from the GCRC program of the Division of Research Resources. Giulia Ghibellini was the recipient of an American Foundation for Pharmaceutical Education Predoctoral Fellowship, Elaine M. Leslie was the recipient of a Postdoctoral Fellowship from the Canadian Institutes of Health Research (CIHR).
Drs. Richard Kowalsky, Daniel Bow, Joe Polli and Brendan Johnson are gratefully acknowledged for their expertise and help in the execution of the in vitro and in vivo studies. Drs. Susan P.C. Cole and Roger G. Deeley (Queen’s University) kindly provided the MRP2 and MRP3 vectors.
ABBREVIATIONS
- Tc-99m
99mTechnetium
- MEB
Tc-99m mebrofenin
- HEK293
human embryonic kidney cells
- MRP
multidrug resistance-associated protein
- OATP
organic anion transporting polypeptide
- TR−
Mrp2 transport-deficient Wistar rat
- HIDA
hepatobiliary imino diacetic acid
- E217βG
Estradiol 17-β-D-glucuronide
- OR-2
oocyte Ringer's 2 buffer
- EF
gallbladder ejection fraction
- GB
gamma counts over gallbladder region
REFERENCES
- 1.Krishnamurthy S, Krishnamurthy GT. Technetium-99m-iminodiacetic acid organic anions: review of biokinetics and clinical application in hepatology. Hepatology. 1989;9:139–153. doi: 10.1002/hep.1840090123. [DOI] [PubMed] [Google Scholar]
- 2.Gencoglu E, Karakayali H, Moray G, Aktas A, Haberal M. Evaluation of pediatric liver transplant recipients using quantitative hepatobiliary scintigraphy. Transplant Proc. 2002;34:2160–2162. doi: 10.1016/s0041-1345(02)02890-7. [DOI] [PubMed] [Google Scholar]
- 3.Koruk M, Ozkilic S, Savas MC, Celen Z, Kadayifci A, Ozkilic C. Evaluation of hepatic functions and biliary dynamics in patients with liver cirrhosis by quantitative scintigraphy. Hepatogastroenterology. 2003;50:1803–1805. [PubMed] [Google Scholar]
- 4.Bujanover Y, Bar-Meir S, Hayman I, Baron J. 99mTc-HIDA cholescintigraphy in children with Dubin-Johnson syndrome. J Pediatr Gastroenterol Nutr. 1983;2:311–312. [PubMed] [Google Scholar]
- 5.Pinos T, Constansa JM, Palacin A, Figueras C. A new diagnostic approach to the Dubin-Johnson syndrome. The American Journal of Gastroenterology. 1990;85:91–93. [PubMed] [Google Scholar]
- 6.Peters AM, Myers MJ, Mohammadtaghi S, Mubashar M, Mathie RT. Bidirectional transport of iminodiacetic organic anion analogues between plasma and hepatocyte. Eur J Nucl Med. 1998;25:766–773. doi: 10.1007/s002590050281. [DOI] [PubMed] [Google Scholar]
- 7.Hendrikse NH, Kuipers F, Meijer C, Havinga R, Bijleveld CM, van der Graaf WT, Vaalburg W, de Vries EG. In vivo imaging of hepatobiliary transport function mediated by multidrug resistance associated protein and P-glycoprotein. Cancer Chemother Pharmacol. 2004;54:131–138. doi: 10.1007/s00280-004-0793-2. [DOI] [PubMed] [Google Scholar]
- 8.Araikum S, Mdaka T, Esser JD, Zuckerman M. Hepatobiliary kinetics of technetium-99m-IDA analogs: quantification by linear systems theory. Journal of Nuclear Medicine. 1996;37:1323–1330. [PubMed] [Google Scholar]
- 9.Ghibellini G, Johnson BM, Kowalsky RJ, Heizer WD, Brouwer KLR. A novel method for the determination of biliary clearance in humans. AAPS J. 2004;6:e33. doi: 10.1208/aapsj060433. [DOI] [PMC free article] [PubMed] [Google Scholar]
- 10.Kartenbeck J, Leuschner U, Mayer R, Keppler D. Absence of the canalicular isoform of the MRP gene-encoded conjugate export pump from the hepatocytes in Dubin-Johnson syndrome. Hepatology. 1996;23:1061–1066. doi: 10.1053/jhep.1996.v23.pm0008621134. [DOI] [PubMed] [Google Scholar]
- 11.Toh S, Wada M, Uchiumi T, Inokuchi A, Makino Y, Horie Y, Adachi Y, Sakisaka S, Kuwano M. Genomic structure of the canalicular multispecific organic anion-transporter gene (MRP2/cMOAT) and mutations in the ATP-binding-cassette region in Dubin-Johnson syndrome. Am J Hum Genet. 1999;64:739–746. doi: 10.1086/302292. [DOI] [PMC free article] [PubMed] [Google Scholar]
- 12.Tsujii H, Konig J, Rost D, Stockel B, Leuschner U, Keppler D. Exon-intron organization of the human multidrug-resistance protein 2 (MRP2) gene mutated in Dubin-Johnson syndrome. Gastroenterology. 1999;117:653–660. doi: 10.1016/s0016-5085(99)70459-2. [DOI] [PubMed] [Google Scholar]
- 13.Paulusma CC, Kool M, Bosma PJ, Scheffer GL, ter Borg F, Scheper RJ, Tytgat GN, Borst P, Baas F, Oude Elferink RP. A mutation in the human canalicular multispecific organic anion transporter gene causes the Dubin-Johnson syndrome. Hepatology. 1997;25:1539–1542. doi: 10.1002/hep.510250635. [DOI] [PubMed] [Google Scholar]
- 14.Kajihara S, Hisatomi A, Mizuta T, Hara T, Ozaki I, Wada I, Yamamoto K. A splice mutation in the human canalicular multispecific organic anion transporter gene causes Dubin-Johnson syndrome. Biochem Biophys Res Commun. 1998;253:454–457. doi: 10.1006/bbrc.1998.9780. [DOI] [PubMed] [Google Scholar]
- 15.Keitel V, Nies AT, Brom M, Hummel-Eisenbeiss J, Spring H, Keppler D. A common Dubin-Johnson syndrome mutation impairs protein maturation and transport activity of MRP2 (ABCC2) Am J Physiol Gastrointest Liver Physiol. 2003;284:G165–G174. doi: 10.1152/ajpgi.00362.2002. [DOI] [PubMed] [Google Scholar]
- 16.Konig J, Rost D, Cui Y, Keppler D. Characterization of the human multidrug resistance protein isoform MRP3 localized to the basolateral hepatocyte membrane. Hepatology. 1999;29:1156–1163. doi: 10.1002/hep.510290404. [DOI] [PubMed] [Google Scholar]
- 17.Johnson BM, Zhang P, Schuetz JD, Brouwer KLR. Characterization of transport protein expression in multidrug resistance-associated protein (mrp) 2-deficient rats. Drug Metab Dispos. 2006;34:556–562. doi: 10.1124/dmd.105.005793. [DOI] [PubMed] [Google Scholar]
- 18.Donner MG, Keppler D. Up-regulation of basolateral multidrug resistance protein 3 (Mrp3) in cholestatic rat liver. Hepatology. 2001;34:351–359. doi: 10.1053/jhep.2001.26213. [DOI] [PubMed] [Google Scholar]
- 19.Guhlmann A, Krauss K, Oberdorfer F, Siegel T, Scheuber PH, Muller J, Csuk-Glanzer B, Ziegler S, Ostertag H, Keppler D. Noninvasive assessment of hepatobiliary and renal elimination of cysteinyl leukotrienes by positron emission tomography. Hepatology. 1995;21:1568–1575. [PubMed] [Google Scholar]
- 20.Okuda H, Nunes R, Vallabhajosula S, Strashun A, Goldsmith SJ, Berk PD. Studies of the hepatocellular uptake of the hepatobiliary scintiscanning agent 99mTc-DISIDA. J Hepatol. 1986;3:251–259. doi: 10.1016/s0168-8278(86)80035-6. [DOI] [PubMed] [Google Scholar]
- 21.Choletec. Kit for the Preparation of Technetium Tc 99m Mebrofenin. Princeton (NJ): Bracco Diagnostic, Inc.; [Google Scholar]
- 22.Cui Y, Konig J, Leier I, Buchholz U, Keppler D. Hepatic uptake of bilirubin and its conjugates by the human organic anion transporter SLC21A6. J Biol Chem. 2001;276:9626–9630. doi: 10.1074/jbc.M004968200. [DOI] [PubMed] [Google Scholar]
- 23.Kowalsky RJ, Falen SW. Radiopharmaceuticals in Nuclear Pharmacy and Nuclear Medicine. Washington, D.C.: American Pharmacists Association; 2004. [Google Scholar]
- 24.Bow DA, Perry JL, Simon JD, Pritchard JB. The impact of plasma protein binding on the renal transport of organic anions. J Pharmacol Exp Ther. 2006;316:349–355. doi: 10.1124/jpet.105.093070. [DOI] [PubMed] [Google Scholar]
- 25.Ito K, Oleschuk CJ, Westlake C, Vasa MZ, Deeley RG, Cole SP. Mutation of Trp1254 in the multispecific organic anion transporter, multidrug resistance protein 2 (MRP2) (ABCC2), alters substrate specificity and results in loss of methotrexate transport activity. J Biol Chem. 2001;276:38108–38114. doi: 10.1074/jbc.M105160200. [DOI] [PubMed] [Google Scholar]
- 26.Oleschuk CJ, Deeley RG, Cole SP. Substitution of Trp1242 of TM17 alters substrate specificity of human multidrug resistance protein 3. Am J Physiol Gastrointest Liver Physiol. 2003;284:G280–G289. doi: 10.1152/ajpgi.00331.2002. [DOI] [PubMed] [Google Scholar]
- 27.Leslie EM, Mao Q, Oleschuk CJ, Deeley RG, Cole SP. Modulation of multidrug resistance protein 1 (MRP1/ABCC1) transport and atpase activities by interaction with dietary flavonoids. Mol Pharmacol. 2001;59:1171–1180. doi: 10.1124/mol.59.5.1171. [DOI] [PubMed] [Google Scholar]
- 28.Geier A, Wagner M, Dietrich CG, Trauner M. Principles of hepatic organic anion transporter regulation during cholestasis, inflammation and liver regeneration. Biochim Biophys Acta. 2007;1773:283–308. doi: 10.1016/j.bbamcr.2006.04.014. [DOI] [PubMed] [Google Scholar]
- 29.Vavricka SR, Van Montfoort J, Ha HR, Meier PJ, Fattinger K. Interactions of rifamycin SV and rifampicin with organic anion uptake systems of human liver. Hepatology. 2002;36:164–172. doi: 10.1053/jhep.2002.34133. [DOI] [PubMed] [Google Scholar]
- 30.Hagenbuch B, Meier PJ. Organic anion transporting polypeptides of the OATP/ SLC21 family: phylogenetic classification as OATP/ SLCO superfamily, new nomenclature and molecular/functional properties. Pflugers Arch. 2004;447:653–665. doi: 10.1007/s00424-003-1168-y. [DOI] [PubMed] [Google Scholar]
- 31.Barnes SN, Aleksunes LM, Augustine L, Scheffer GL, Goedken MJ, Jakowski AB, Pruimboom-Brees IM, Cherrington NJ, Manautou JE. Induction of hepatobiliary efflux transporters in acetaminophen-induced acute liver failure cases. Drug Metab Dispos. 2007;35:1963–1969. doi: 10.1124/dmd.107.016170. [DOI] [PubMed] [Google Scholar]
- 32.Chandra P, Brouwer KLR. The complexities of hepatic drug transport: current knowledge and emerging concepts. Pharm Res. 2004;21:719–735. doi: 10.1023/b:pham.0000026420.79421.8f. [DOI] [PubMed] [Google Scholar]
- 33.Konig J, Nies AT, Cui Y, Leier I, Keppler D. Conjugate export pumps of the multidrug resistance protein (MRP) family: localization, substrate specificity, and MRP2-mediated drug resistance. Biochim Biophys Acta. 1999;1461:377–394. doi: 10.1016/s0005-2736(99)00169-8. [DOI] [PubMed] [Google Scholar]
- 34.Stockel B, Konig J, Nies AT, Cui Y, Brom M, Keppler D. Characterization of the 5'-flanking region of the human multidrug resistance protein 2 (MRP2) gene and its regulation in comparison with the multidrug resistance protein 3 (MRP3) gene. Eur J Biochem. 2000;267:1347–1358. doi: 10.1046/j.1432-1327.2000.01106.x. [DOI] [PubMed] [Google Scholar]