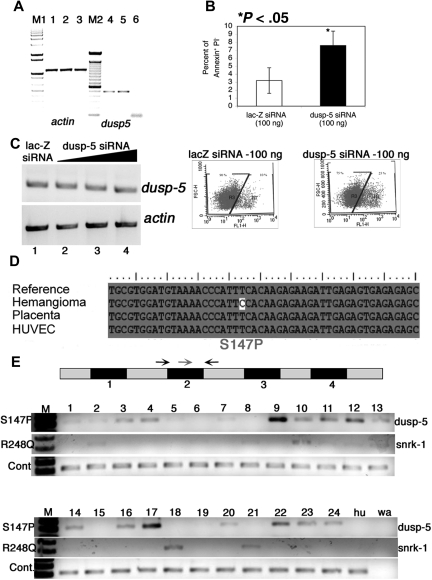
Figure 4.
Dusp-5 knockdown in vitro and mutation analysis of vascular anomaly patient samples. (A) RT-PCR for actin (lanes 1-3) and dusp-5 (lanes 4-6) transcripts from UI (lanes 1 and 4), lac-Z siRNA (lanes 2 and 5), and dusp-5 siRNA-transfected (lanes 3 and 6) ECs. M1 indicates 1-kb DNA ladder marker; M2, 100-bp DNA ladder marker. (B) Percentage of apoptotic HUVECs (annexin V+ and PI−) 8 hours after transfection with 100 ng each of lac-Z and dusp-5 siRNA. The data are compiled from 4 independent experiments, and the error bars represent SEM. The dot plots indicating the gates and the percentage of annexin V–fluorescein isothiocyanate+ cells in lac-Z and dusp-5 siRNA samples. *P < .05 between sample groups. (C) RT-PCR for dusp-5 and actin transcripts from hemangioma templates. The black triangle indicates increasing concentrations of dusp-5 siRNA (lane 2, 100 ng; lane 3, 250 ng; lane 4, 500 ng) transfected into ECs, lacZ siRNA (lane 1, 500 ng). No change in dusp-5 transcript levels is noted across samples. (D) Mutation in the dusp-5 coding sequence identified only in the hemangioma sample and not from HUVEC or placenta tissue compared with the sequence of NCBI Gene Id 1847. (E) Exon-intron structure of dusp-5 in the genome. The numbers below the black box indicate exons. The gray boxes represent untranslated or intron sequences. Arrows indicate primers used for genomic PCR amplification. The red arrow indicates the mutated forward primer in exon 2; black arrow, the normal forward primer. The S147P PCR gel shows amplification resulting from the dusp-5 mutation specific red primer and the dusp-5 black reverse primer. The R248Q gel shows amplification resulting from the snrk-1 mutation-specific primer and the snrk-1 reverse primer. The wild-type (WT) gel shows amplification resulting from the dusp-5 normal forward and reverse primers. The Hu lane contains DNA from HUVEC cells, and the wa lane contains a water control with no genomic DNA in the PCR.

