

Abstract
Considerable information about the texture of objects can be perceived remotely through a probe. It is not clear, however, how texture perception with a probe compares with texture perception with the bare finger. Here we investigate the perception of a variety of textured surfaces encountered daily (e.g., corduroy, paper, and rubber) using the two scanning modes—direct touch through the finger and indirect touch through a probe held in the hand—in two tasks. In the first task, subjects rated the overall pair-wise dissimilarity of the textures. In the second task, subjects rated each texture along three continua, namely, perceived roughness, hardness, and stickiness of the surfaces, shown previously as the primary dimensions of texture perception in direct touch. From the dissimilarity judgment experiment, we found that the texture percept is similar though not identical in the two scanning modes. From the adjective rating experiments, we found that while roughness ratings are similar, hardness and stickiness ratings tend to differ between scanning conditions. These differences between the two modes of scanning are apparent in perceptual space for tactile textures based on multidimensional scaling (MDS) analysis. Finally, we demonstrate that three physical quantities, vibratory power, compliance, and friction carry roughness, hardness, and stickiness information, predicting perceived dissimilarity of texture pairs with indirect touch. Given that different types of texture information are processed by separate groups of neurons across direct and indirect touch, we propose that the neural mechanisms underlying texture perception differ between scanning modes.
Keywords: Texture, multidimensional scaling, probe, dissimilarity, roughness, hardness, stickiness
Introduction
Exploring the world with probes or tools is a ubiquitous experience in our daily life. Examples include drawing with a pencil, using cooking utensils, or in more special cases, performing minimally invasive surgery with laparoscopic instruments. Despite this indirect perception of objects through a tool, people experience a rich impression of the surface, not of the tool or the vibrations through it (Katz 1925/1989; Klatzky et al. 2003). Although much is known about texture perception with direct touch (Johnson 2002), less is known about the texture perception with indirect touch, and how the percepts in the two scanning modes are related.
Our motivation for performing this study is the observation that while perception of textures appears intact through a tool, the information available to subjects about the surfaces is different in direct and indirect touch. When exploring surfaces with the finger (i.e., direct touch), both a crisp two-dimensional spatial image of the texture and vibratory information are available to the receptors in the finger pad. In the probe-scanning condition, the information about the surface must rely on transmitted vibrations that quasi-synchronously activate the mechanoreceptors in the hand: no spatial cues are available for texture perception since the pattern of deformation of the skin reflects the contours of the probe rather than the properties of the scanned surface (Klatzky et al. 2003). In other words, the spatial image of the texture that is sent to the central nervous system by the different afferent populations in the two scanning modes is quite different.
Because of this difference in inputs to the nervous system, the neural mechanisms of texture perception differ between direct and indirect touch. In direct touch, a spatial image of the texture is available in the population response of SA1 afferents (Connor et al. 1990; Connor and Johnson 1992; Johnson and Yoshioka 2002). With indirect touch, vibrations must convey texture information, and RA and PC afferents that are sensitive to vibratory stimuli are likely to be employed when textures are scanned through a probe (Gardner and Palmer 1989a, 1989b; Kops and Gardner 1996; Craig and Rollman 1999).
The perceptual space for tactile textures during direct touch is spanned by the primary dimensions of roughness, hardness, and stickiness, and to a lesser degree warmth (Hollins et al. 1993, 2000). Although other putative adjectives have been used to describe textures including “thin”, “thick”, “relief”, “harsh” (Picard et al. 2003), “blurred”, and “clear” (Gescheider et al. 2005), exactly how these descriptors relate to the primary dimensions is not clear. In the present study, we concentrate on the three primary dimensions of “hardness”, “stickiness”, and “roughness”.
In separate studies with indirect touch, texture percept is shown to vary along the rough–smooth (Lederman et al. 1999; Hollins et al. 2005), hard–soft (LaMotte 2000), and sticky–slippery axis (Smith and Scott 1996). How these texture dimensions interact with each other has not been investigated with indirect touch. Furthermore, the warm–cool dimension cannot be conveyed by probes.
The aim of the present study is to characterize and compare texture perception between direct and indirect touch in a set of psychophysical experiments, and determine perceptual similarities and differences between scanning conditions from judgments of perceived “dissimilarity” of texture pairs and magnitude estimates along the three primary texture continua, “roughness”, “hardness”, and “stickiness” of each texture (Hollins et al. 2000). We then determine how much roughness, hardness, and stickiness information might have contributed to the dissimilarity ratings of texture pairs. These perceptual quantities are analyzed in the perceptual space for tactile textures using a multidimensional scaling (MDS) algorithm (Matlab, MathWorks, Inc., Natick, MA, USA). We also characterize the physical quantity that underlies the perceived roughness, hardness, and stickiness of a surface explored through a probe in a series of measurements of vibrations and forces produced during the scanning. In addition, we examine the effect of scanning force and velocity on roughness perception with indirect touch, and show that the changes in velocity and force have little effect on roughness perception. We also show that both direct and indirect touch yield rich multidimensional textural percepts, but that there are distinct perceptual differences across scanning modes. Because previous results suggest that different types of texture information are used during direct touch and likely to be processed by separate groups of neurons, we propose that the neural mechanisms underlying texture perception differ between scanning modes.
Methods
Stimuli
Stimuli consisted of materials that subjectively feel very different and spanned a wide range of texture qualities (e.g., different types of cloths and paper; see Table I). All but 3 of the 16 stimuli were mounted on 7 cm × 22 cm × 0.6 cm Plexiglas blocks using double-sided tape. There was no need to mount the other three surfaces (glass, rubber, and wood). The thickness of the stimuli, including the Plexiglas base plate, varied slightly from 0.6 (glass) to 0.75 cm (foam). Corduroy was mounted so that the ridges ran perpendicular to the long axis of the plate; that is, the direction of scanning. Wood was oriented with the grain parallel to the scanning direction. The surfaces included three grades of water-color papers of varying coarseness and two kinds of vinyl surfaces.
Table I.
Summary of stimuli used in the study. We refer to the textured surfaces using common names in the text (left column). Descriptions (right column) are those used by the manufacturer or the store where they were purchased.
| Name | Description |
|---|---|
| Corduroy | PPK5 corduroy (100% cotton) |
| Denim | Non-stitch DKWSH (100% cotton) |
| Fleece | PPK6 suiting (100% polyester) |
| Foam | 100% nylon headliner/black Donna foam |
| Glass | 6 mm thick |
| Latex | 0.5 mm thick (McMaster–Carr, 8611 K164) |
| Nylon | Sport nylon (100% nylon) |
| Organza | Bridal organza (100% nylon) |
| Paper1 | Water-color paper (90 lb hot press) |
| Paper2 | Water-color paper (140 lb cold press) |
| Paper3 | Water-color paper (300 lb rough) |
| Rubber | 6.5 mm thick (McMaster–Carr, 8635 K646) |
| Suede | Alova suede (100% polyester) |
| Vinyl1 | Poly-vinyl chloride, silver surface color |
| Vinyl2 | Poly-vinyl chloride, brown surface color |
| Wood | Poplar |
The stimuli were placed in wells milled in a 13 cm × 61 cm × 3 cm stainless steel block (Figure 1) and were fixed in the stimulus assembly by steel flaps. The edges of each aperture were graded at a shallow angle (∼10°) so that the exploring probe (or finger) moved smoothly onto each surface. This smooth movement of the probe onto the texture surfaces minimized texture cues related to tapping. The assembly was placed behind a curtain that hung from the bottom of a 40-inch flat monitor (Dell Inc.). Subjects could see neither their hands nor the stimulus assembly during the experiment. A real-scale line drawing on the monitor showed subjects the locations of the beginning and ends of the apertures and helped subjects position their hands while exploring the surfaces. Auditory cues were masked by headphones that provided pink noise to the subjects.
Figure 1.
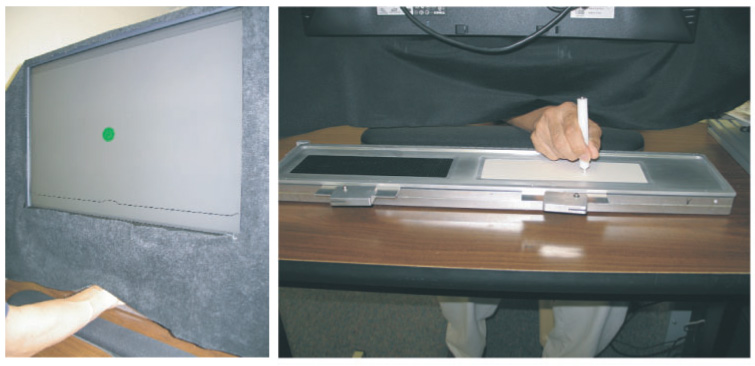
Subject’s (left) and experimenter’s (right) view of the experimental setup. The green circle signaled the beginning of the trial. The subject placed the finger or probe on the leftmost platform of the stimulus assembly and waited for the circle to disappear, at which time the subject began moving the finger or probe to their right. As the subjects scanned the finger/probe to the right, they reached the first aperture (i.e., the first stimulus). The subjects explored the first stimulus by scanning it in a back and forth motion with the finger/probe for as long as they wished. The subjects then slid the finger/probe up the rightmost edge of the aperture, across a short platform on the stimulus assembly, to the second aperture. Again, the subjects explored the stimulus by scanning back and forth until they were satisfied, and then slid the finger/probe out of the second aperture. When the finger/probe was on the rightmost platform, the subjects removed the finger/probe from the assembly and provided the experimenter with their dissimilarity rating. In the adjective rating task, subjects explored only the first texture, then produced their rating.
Subjects
A total of nine subjects participated in the experiments. Eight subjects (7 females and 1 male) participated in the dissimilarity rating and adjective scaling tasks (see below). Two of those subjects and one additional subject participated in the measurements of scanning force and velocity. All subjects except one were students of the Johns Hopkins University (JHU) and ranged in age from 18 to 22. The other subject was a 34-year-old JHU employee. All subjects were right-handed and reported no neurological problems. All of the procedures were approved by the Johns Hopkins University Human Institutional Review Board.
Procedure
Dissimilarity ratings
In this task subjects scanned two textured surfaces successively and then produced free magnitude estimations of dissimilarity (cf., Bensmaia and Hollins 2005). Subjects were instructed to report a number proportional to the overall perceived dissimilarity of the two surfaces. If the pair was perceived as identical, subjects reported the number zero. They were told that the number they assigned to the first pair was arbitrary (unless the textures were perceived as identical). For subsequent pairs, they reported numbers using a ratio scale. For example, if the second pair of textures was twice as dissimilar as the first, they were to assign it a number twice as large. They were encouraged to use any range of numbers that they desired. Each of the 16 textured stimuli was paired with each other, for a total of 120 pairs. Stimuli were presented in a pseudo-random order with each stimulus equally likely to occur in the first or second aperture. There were six experimental runs per subject per scanning condition (probe or finger). The first set of ratings was for practice and was not included in the analysis. Half of the subjects (i.e., four out of eight subjects) began with the finger-scanning condition, and the other half with the probe-scanning condition.
On each trial, two textured surfaces were placed in the stimulus assembly (see Figure 1). The beginning of the trial was signaled to the subject by a green circle that appeared on the screen. The subject then placed their finger or the probe on the leftmost platform of the stimulus assembly and waited for the circle to green appear. The subject then moved their finger or the probe to their right, until they reached the first aperture (i.e., the first stimulus). The subjects explored this stimulus using a back and forth motion for as long as they wished. The subjects then moved their hand to the start of the second aperture and explored the second stimulus. The subjects reported a number which represented the magnitude of dissimilarity for the texture pair. The experimenter then changed the texture pair and the next trial was begun. Each subject was tested over 9–15 sessions.
Adjective ratings
After completing the six runs of dissimilarity ratings, subjects rated each of the textures along three textural continua of rough/smooth, sticky/slippery, and hard/soft. Subjects followed the same scanning procedure as described above but scanned only the texture located in the first aperture. Experiments were run in blocks in which subjects were asked to make free magnitude estimations along one of the continua. For rough/smooth and sticky/slippery, a perfectly smooth or perfectly slippery surface was to be assigned the number zero. Because there is no absolute zero along the hard/soft dimension, subjects were told simply to assign higher numbers to harder surfaces and to use a consistent scale. Each subject rated each surface six times along each textural continuum in the two scanning conditions. The first set of ratings was for practice and was not included in the analysis. Roughness, hardness, and stickiness blocks were ordered pseudo-randomly.
Scanning
Subjects explored the textures with either their bare index finger or with a 10-cm-long Delrin probe (body diameter = 1 cm), with a rounded tip (diameter = 3 mm) that they held in their hand using a pencil grip. Subjects grasped the probe about midway along the axis of the probe and were asked to hold the probe as vertical as possible. The subjects scanned back and forth along the length of the surface with scanning force and velocity of their choice. The scanning duration for both scanning conditions was typically about 3–5 s and included about five sweeps (i.e., three left-to-right and two right-to-left scanning movements). Some subjects used a single sweep as they became accustomed to the procedure.
In a separate experiment, scanning force and velocity in the probe-scanning condition were measured in three subjects while performing a subjective roughness rating task. Scanning force was measured using four force transducers placed at the four corners of the texture apparatus (Figure 1). The outputs from the force transducers were sampled at a rate of 5000 Hz, and were then averaged. Scanning velocity was computed from the output of an accelerometer attached to the end of the probe, by taking the Fourier transform of the acceleration and converting it to velocity in the frequency domain, and then taking the inverse Fourier transform to obtain velocity in the time domain. Scanning velocities were obtained only in the probe-scanning condition.
The average scanning force used in the probe-scanning mode was 134 g (σE = 5.5 g, SEM) for subject S3, 169 g (σE = 5.1 g) for subject S2, and 282 g (σE = 7.8 g) for subject S1 with the overall mean of 195 g (σE = 6 g). The average scanning force in this condition was about three times as high as that in the finger-scanning condition (64 g, σE = 12 g) with the individual subjects using 83 g (S1, σE = 2.9 g), 50 g (S2, σE = 1.7 g), or 59 g (S3, σE = 3.3 g). The average scanning velocity also varied from subject to subject; 17 mm/s for subject S3, 35 mm/s for subject S2, and 74 mm/s for subject S3, yielding a mean of 42 mm/s (σE = 3 mm/s).
Physical measurements
We measured three physical quantities during the probe scans, namely, vibratory power, compliance, and coefficient of friction, and determined the extent to which adjective ratings along the three textural continua were correlated with these quantities.
To measure the vibrations, we attached a tri-axial accelerometer (Kistler Inc., model 8692B5, ±5 g range) to the top end of the probe. To reduce the effects of physiological hand tremors during active scanning, textures were passively scanned by placing them on a conveyor belt (courtesy of Dr Mark Hollins) moving at 40 mm/s while holding the probe against the texture (Figure 2 and Figure 3). The velocity, 40 mm/s, was chosen because it is about the average velocity used by subjects in the roughness task (see earlier). We amplified and stored the resulting acceleration signals along x- (scanning direction), y- (transverse to the scanning direction), and z- (vertical direction) axes. We computed vibratory power along each of the three axes using the following formula:
| (1) |
where Pt is the vibratory power of texture t and atf is the Fourier component of the acceleration signal produced by texture t at frequency f. We present results obtained using acceleration signals recorded along the scanning direction (x-axis), as vibrations were highest in amplitude along this axis (Figure 2).
Figure 2.
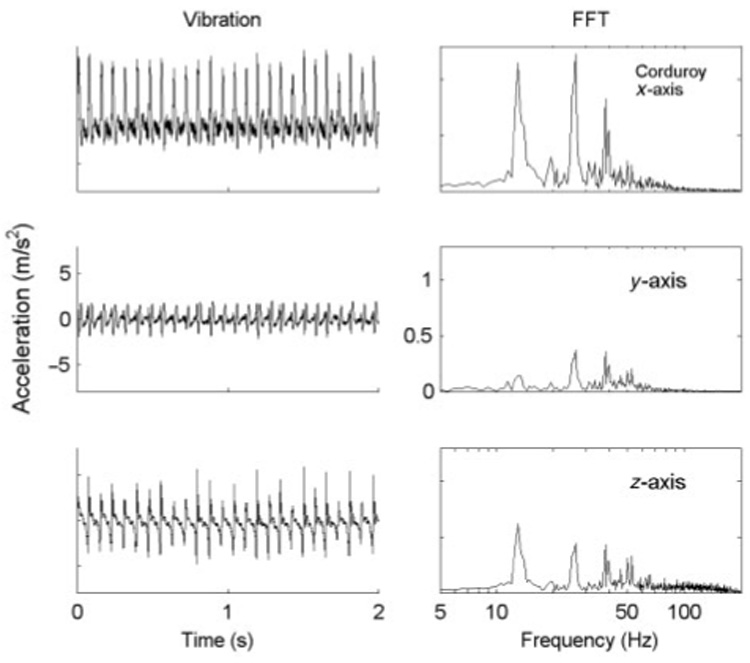
Vibrations recorded from scanning corduroy when the texture surface was moved at 40 mm/s against a Delrin probe (diameter = 3mm) held by a stationary hand. A tri-axial accelerometer attached to the top of the probe monitored accelerations along the x- (scanning direction), y- (orthogonal to x in the horizontal plane), and z-(vertical) axes. The corresponding Fourier spectra are shown on the right. Notice that the amplitudes of Fourier components along the scanning direction (x) are the largest, and that the same frequency peaks (13.5, 27, 40 Hz) are present in the y- and z-axes.
Figure 3.
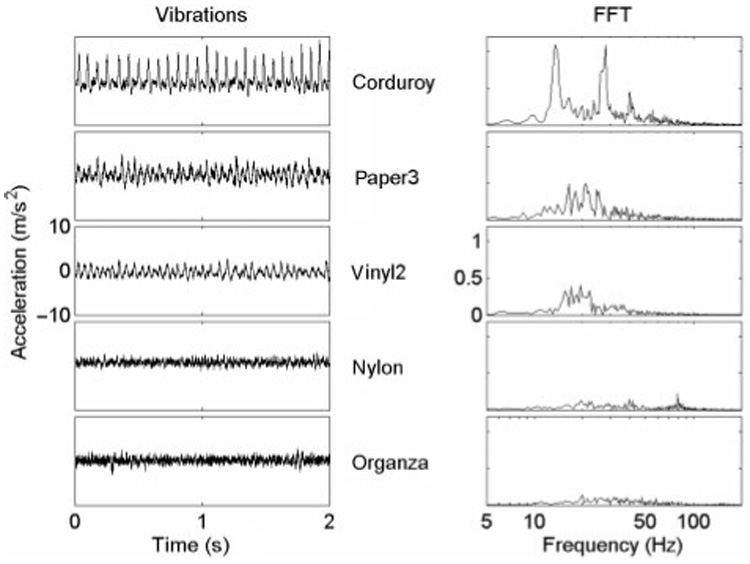
Vibration (acceleration) signals recorded in the scanning direction (left panels) and their corresponding Fourier spectra (right panels; logarithmic) for five sample textures. (See figure 2 for details).
Compliance (cm/g) is defined in these studies by the distance a probe indents into a surface for a given force. To determine compliance, we measured the vertical displacement of a 3-mm diameter tip Delrin probe for three different forces (30, 120, and 150 g; i.e., approximately 0.3, 1.2, and 1.5 N). The probe positions were measured using a laser position meter with 2-nm resolution (model LDS-1000 Laser Doppler Scale, Optodyne Inc., Compton, CA, USA).
Friction is the reaction force in the direction opposite to the pulling force needed to move an object across a surface. There are two types of friction. Static friction increases with increases in pulling force while the object is stationary. Kinetic friction is constant once the object starts moving and is independent of the pulling force. We measured the coefficient of kinetic friction, defined as the ratio of lateral force to normal force (see equation below), by measuring the acceleration of each texture surface as it was pulled, textured side down, across a Delrin plate (the probe material), using a mass and pulley system. The kinetic friction was measured for each texture for a range of forces (150–350 g force = 1.5–3.5 N) and masses (300–750 g). The large Delrin plate simulates the material interface between the Delrin probe and the texture. The acceleration was measured by monitoring the changes of texture positions at a reflector site with a laser position meter (Optodyne Inc.). The coefficient of kinetic friction (µk) for each texture was computed from these measurements as follows:
| (2) |
where m1 is the mass of the weight pulling the texture, m2 is the mass of the loaded texture, g is gravity (9.8 m/s²), and a is the acceleration of the plate with the stimulus surface.
Analyses
Psychophysical ratings
The individual dissimilarity ratings for the texture pairs and the adjective ratings (rough, hard, sticky) for the 16 textures were normalized by the mean of all of the responses produced by each subject in each experimental block. Ratings were then averaged across subjects. To examine the relationship between adjective and dissimilarity ratings, we first computed, for each pair of textures, the absolute difference in the normalized adjective rating ascribed to each texture in the pair. We then carried out a multivariate regression of these difference scores onto the dissimilarity ratings. From the regression analysis, we could determine the degree to which difference scores were predictive of the dissimilarity ratings, whether difference scores along a certain continuum were more predictive than scores along other continua, and whether the regression statistics depended on the scanning condition. The p-values in the regression or correlation analyses were obtained using t-statistics.
Multidimensional scaling (MDS) perceptual space
The MDS algorithm (Matlab, MathWorks Inc.) was used to find the n-dimensional texture perceptual space given a set of distance measures. The optimization algorithm uses dissimilarity ratings between texture pairs to place the stimuli in a hypothetical n-dimensional space such that the distances between textures closely match the given dissimilarities. The result is a least-squares representation of Euclidean distance between texture pairs in that space. The coefficient of determination (R²) was measured for models of up to six dimensions. The relationship between adjective scales (rough, hard, sticky) and MDS space was examined using a three-dimensional space by regressing the adjective ratings into the MDS space. The algorithm uses a Vandermonde matrix whose columns are powers of the vector in question to find the coefficients of a polynomial in a least-squares sense. By evaluating the polynomial along the values of the adjective ratings, we obtained the data points which formed lines for rough, hard, and sticky dimensions. Note that the angle between these adjective axes in multidimensional space gives an indication of the relative dependence of these continua.
Cluster analysis
We selected a wide range of textures that subjectively span typical texture ranges we encounter in everyday life. To examine how evenly these textures are distributed in the perceptual space, we used cluster analysis with two-dimensional hierarchical, binary cluster trees. The computation of three-dimensional MDS perceptual space provides the spatial coordinates of the 16 textures and the inter-texture distances based on a least-squares algorithm for Euclidean distance (see the section above). The linkage-based cluster analysis reduces the dimensionality of the relationship between the MDS space and adjective ratings from 3D to 2D, thereby allowing us to visualize in 2D how textures are distributed in the perceptual space.
We used the “nearest neighbor” algorithm for the linkage-based cluster analysis (also called the “single linkage” algorithm) which uses the smallest distance between objects in the two clusters. To test whether the choice of algorithm yields any difference, we also examined the data with two other methods, “centroid” algorithm, which uses centroid distance between objects, and “average” algorithm, which uses unweighted average distance between objects.
Results
Dissimilarity ratings
The individual dissimilarity ratings for the 120 pairs of textures were normalized by calculating the mean of all responses produced by each subject in each experimental block. The dissimilarity rating for each texture pair, averaged across subjects, is shown in Table II. The table includes data from both the finger-scanning condition (upper triangular matrix; shaded) and the probe-scanning condition (lower triangular matrix; not shaded). For both scanning conditions, there was a wide range of dissimilarity ratings. The correlation coefficient between the ratings obtained in the two scanning conditions was 0.74 (p < 0.001), suggesting that the perception of surfaces examined through a probe and with the bare finger was similar though not identical (Figure 4).
Table II.
Normalized dissimilarity ratings averaged over eight subjects for the 120 texture pairs obtained in the finger-scanning (shaded upper triangular matrix) and probe-scanning (un-shaded lower triangular matrix) conditions.
| Probe\finger | Corduroy | Denim | Fleece | Foam | Glass | Latex | Nylon | Organza | Paper1 | Paper2 | Paper3 | Rubber | Suede | Vinyl1 | Vinyl2 | Wood |
|---|---|---|---|---|---|---|---|---|---|---|---|---|---|---|---|---|
| Corduroy | 1.11 | 1.34 | 1.52 | 1.91 | 1.84 | 1.29 | 1.31 | 1.49 | 1.08 | 0.89 | 1.68 | 1.23 | 1.08 | 0.93 | 1.49 | |
| Denim | 1.14 | 1.20 | 1.32 | 1.44 | 1.49 | 0.44 | 0.64 | 0.67 | 0.27 | 0.28 | 1.05 | 0.58 | 0.31 | 0.38 | 0.62 | |
| Fleece | 1.22 | 0.63 | 0.79 | 1.80 | 1.88 | 1.30 | 1.36 | 1.20 | 1.35 | 1.31 | 1.53 | 0.72 | 1.35 | 1.20 | 1.17 | |
| Foam | 1.64 | 1.24 | 0.77 | 1.71 | 1.83 | 1.27 | 1.22 | 1.18 | 1.40 | 1.43 | 1.48 | 1.18 | 1.41 | 1.41 | 1.18 | |
| Glass | 1.92 | 1.40 | 1.52 | 1.40 | 0.70 | 1.31 | 1.20 | 1.19 | 1.36 | 1.43 | 0.65 | 1.38 | 1.41 | 1.45 | 1.11 | |
| Latex | 1.84 | 1.57 | 1.39 | 1.10 | 1.80 | 1.40 | 1.36 | 1.35 | 1.41 | 1.56 | 0.84 | 1.44 | 1.34 | 1.51 | 1.23 | |
| Nylon | 1.39 | 0.49 | 0.97 | 1.11 | 1.19 | 1.56 | 0.28 | 0.33 | 0.41 | 0.68 | 0.83 | 0.75 | 0.57 | 0.72 | 0.38 | |
| Organza | 1.48 | 0.72 | 0.89 | 1.10 | 0.94 | 1.57 | 0.28 | 0.34 | 0.72 | 0.84 | 0.79 | 0.78 | 0.80 | 0.91 | 0.41 | |
| Paper1 | 1.48 | 0.70 | 0.94 | 1.03 | 0.83 | 1.56 | 0.40 | 0.19 | 0.53 | 0.79 | 0.58 | 0.63 | 0.74 | 0.85 | 0.14 | |
| Paper2 | 1.16 | 0.27 | 0.69 | 1.24 | 1.31 | 1.61 | 0.54 | 0.65 | 0.63 | 0.28 | 0.94 | 0.72 | 0.37 | 0.35 | 0.43 | |
| Paper3 | 0.77 | 0.47 | 0.75 | 1.49 | 1.49 | 1.69 | 0.86 | 0.89 | 0.89 | 0.30 | 1.12 | 0.74 | 0.36 | 0.26 | 0.79 | |
| Rubber | 1.74 | 1.42 | 1.20 | 0.73 | 1.49 | 0.51 | 1.39 | 1.37 | 1.31 | 1.44 | 1.55 | 0.93 | 1.05 | 1.07 | 0.63 | |
| Suede | 1.24 | 0.33 | 0.50 | 1.00 | 1.32 | 1.47 | 0.51 | 0.51 | 0.47 | 0.29 | 0.57 | 1.34 | 0.89 | 0.80 | 0.61 | |
| Vinyl1 | 0.86 | 0.43 | 0.67 | 1.23 | 1.68 | 1.24 | 0.84 | 0.94 | 1.03 | 0.67 | 0.62 | 1.28 | 0.57 | 0.24 | 0.71 | |
| Vinyl2 | 0.98 | 0.39 | 0.38 | 1.05 | 1.54 | 1.38 | 0.87 | 0.96 | 0.99 | 0.55 | 0.67 | 1.29 | 0.60 | 0.34 | 0.80 | |
| Wood | 1.44 | 0.89 | 1.06 | 1.27 | 0.88 | 1.49 | 0.50 | 0.29 | 0.18 | 0.58 | 0.86 | 1.25 | 0.51 | 1.01 | 1.05 |
Figure 4.
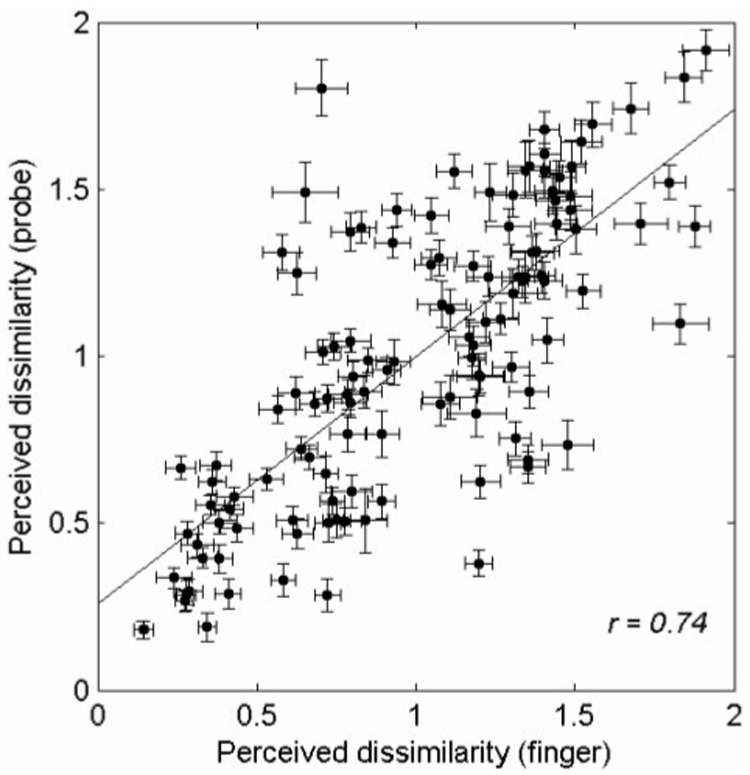
Normalized dissimilarity ratings for the 120 texture pairs obtained in the finger-scanning condition vs. ratings obtained in the probe-scanning condition. Dissimilarity ratings were first normalized within block by dividing each dissimilarity rating by the mean rating for that block. Ratings were then averaged over eight subjects and five repeats. The solid line is the least-squares regression line, and error bars show the standard error of the mean. The perceived dissimilarity of textures was similar but not identical in the two scanning conditions.
We examined both the population means of the data and individual subject data separately. Although the correlation coefficients for the dissimilarity ratings between direct touch and indirect touch varied among subjects (0.52 < r < 0.84; r = 0.65 ± SEM 0.04), the correlations were all statistically significant (p < 0.001).
Adjective scaling of individual textures
Subjective magnitude estimates of roughness, hardness, and stickiness were normalized by the mean rating in each block and then averaged across blocks for each subject and texture. Figure 5 shows the ratings averaged across subjects for each texture along each textural continuum in both finger- and probe-scanning conditions. Ratings spanned a wide range for all three textural continua. Whereas many textures yielded similar ratings in the two scanning conditions (e.g., vinyl2), others yielded substantially different ratings (e.g., rubber). To directly compare the ratings in the two scanning conditions, we plotted roughness, hardness, and stickiness ratings obtained in one scanning condition against those obtained in the other. Roughness ratings obtained in the two scanning conditions were highly correlated (r = 0.92, p < 0.001), whereas the corresponding correlations for hardness (r = 0.70, p < 0.005) and stickiness (r = 0.58, p < 0.05) were lower (Figure 6). The high correlation between the two sets of roughness ratings confirms previous reports that roughness perception through a probe is comparable to roughness perception with the bare finger (Klatzky et al. 2003). In contrast, the perception of hardness and stickiness seems to be affected more by the mode of exploration.
Figure 5.
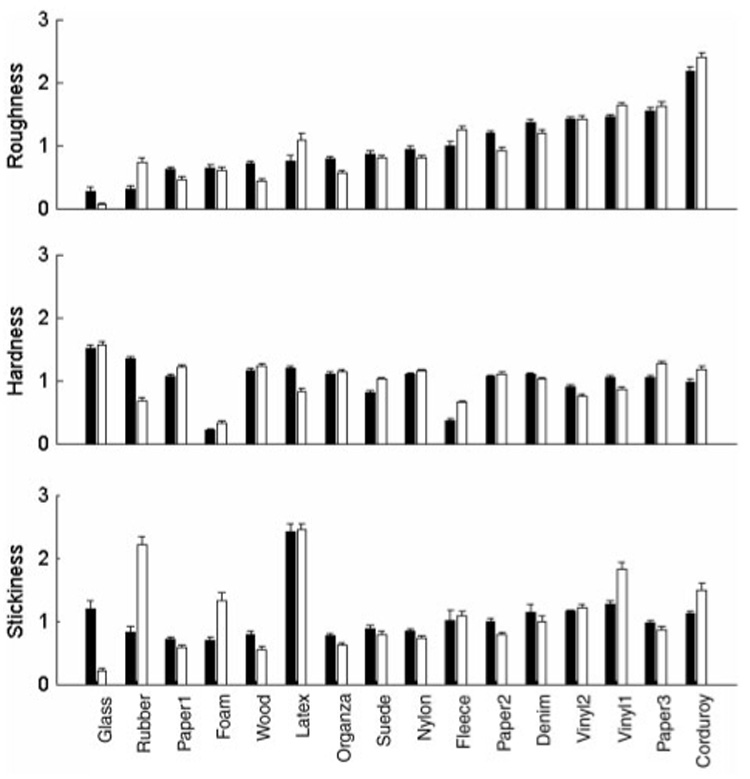
Results from the adjective scaling experiment. Perceived roughness (top panel), hardness (middle panel), and stickiness (bottom panel), normalized within block then averaged over eight subjects. Solid bars show the results obtained in the finger-scanning condition, and open bars represent the results obtained in the probe-scanning condition. For many textures, ratings are similar between finger- and probe-scanning conditions. Some textures, however, yielded considerably different ratings in the two conditions along some textural continua (e.g., the perceived stickiness of glass was high in the finger-scanning condition and low in the probe-scanning condition). Textures are ordered from the left to the right in increasing order of perceived roughness in the finger-scanning condition. Error bars show standard error of the mean.
Figure 6.
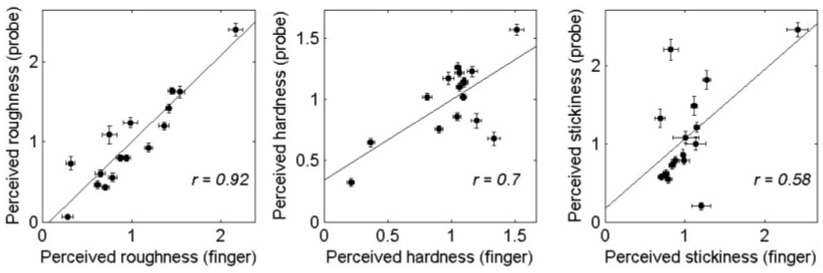
Normalized perceived roughness (left panel), hardness (middle panel), and stickiness (right panel) ratings obtained in the finger-scanning condition vs. ratings obtained in the probe-scanning condition. Data are the same as those presented in Figure 5. Roughness ratings obtained in the two scanning conditions are highly correlated whereas hardness and stickiness ratings are less so. Error bars show the standard error of the mean.
Roughness ratings obtained in the two scanning conditions were significantly correlated for all eight subjects (r = 0.82 ± SEM 0.03; p < 0.005), hardness and stickiness ratings were less correlated; six out of eight subjects showed significant correlation between two modes of scanning (hardness: r = 0.72 ± SEM 0.06; 0.0001 < p <0.05; stickiness: r = 0.63 ± SEM 0.06; 0.0001 < p <0.05), while two subjects showed non-significant correlation (hardness: r = 0.10 and 0.47; p > 0.05; stickiness: r = 0.06 and −0.01; p > 0.05).
Relationship between overall dissimilarity rating and adjective scaling
To examine the relationship between the dissimilarity ratings and the adjective scaling results, we investigated whether the difference in the ratings obtained for a given pair of textures along the three adjectival dimensions was a good predictor of the overall dissimilarity rating assigned to that pair. Furthermore, we wished to compare the relationship between adjective and dissimilarity ratings across scanning conditions. A least-squares linear regression model was constructed to predict dissimilarity rating using roughness (r), hardness (h), and stickiness (s) difference scores (see Methods):
| (3) |
where b1, b2, and b3 are the least-squares regression coefficients (finger: b1 = 0.52, b2 = 0.93, and b3 = 0.47; probe: b1 = 0.37, b2 = 0.48, and b3 = 0.48). The standardized regression coefficients, which index the relative contribution of the three independent variables to the prediction, are β1 = 0.50, β2 = 0.67, and β3 = 0.47 for the finger condition, and β1 = 0.41, β2 = 0.29, and β3 = 0.59 for the probe condition. Thus, hardness is most predictive of dissimilarity in the finger-scanning condition whereas stickiness is the best predictor of dissimilarity in the probe-scanning condition. The correlation coefficient between predicted and measured dissimilarity is 0.92 (p < 0.001) for the finger-scanning condition and 0.87 (p < 0.001) for the probe-scanning condition (see Figure 7).
Figure 7.
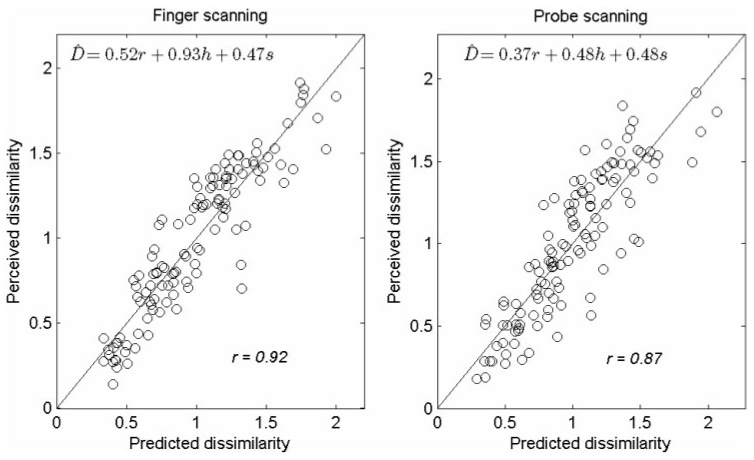
Predicted vs. measured dissimilarity in the finger-scanning (left panel) and probe-scanning (right panel) conditions. To obtain the predicted dissimilarity ratings, we first regressed pair-wise differences in the subjects’ ratings along the three texture continua on predicted dissimilarity, then used the resulting regression coefficients to generate the estimates (see text for details). The match between predicted and measured dissimilarity suggests that, in both scanning conditions, perceived dissimilarity can be reliably predicted from differences in roughness, hardness, and stickiness.
In other words, approximately 85% of the variance in the dissimilarity ratings obtained in the finger-scanning condition is accounted for by differences in roughness, hardness, and stickiness. In the probe-scanning condition, 76% of the variance in dissimilarity ratings is explainable in terms of differences along the three textural continua. The explained variance may be higher for the finger condition than for the probe condition because the dissimilarity and adjective ratings were more variable in the probe-scanning than in the finger-scanning condition (data not shown). Note that pairs of textures yielding substantially different ratings along a given textural continuum in the two scanning conditions also tend to yield different dissimilarity ratings across scanning conditions. For instance, glass is perceived as sticky with the finger but slippery with the probe; latex is perceived as highly sticky with both finger and probe (Figure 5). As a result, the perceived dissimilarity between glass and latex is high in the probe-scanning condition (1.8) whereas it is low in the finger-scanning condition (0.7) (Table II).
Multidimensional scaling (MDS)
Another way to view the perceptual organization of textures in the two scanning conditions is to use a MDS algorithm (SPSS Inc.) and view the textures in an n-dimensional space (cf., Hollins et al. 1993, 2000) where the distance between the stimuli in the space is proportional to their perceived dissimilarity. Figure 8 shows the textures mapped into a three-dimensional texture perceptual space. Ratings along the three textural continua for these 16 surfaces are then linearly fitted with the MDS coordinates derived from the dissimilarity ratings. The relationships among different textural continua were directly compared with each other in the MDS space by measuring the angles between their fitted axes in the MDS space. The angles between these axes reflect the correlations between the corresponding adjective ratings (see Table III). Thus, hardness and stickiness dimensions are positively correlated in the finger-scanning condition and negatively correlated in the probe-scanning condition, a discrepancy reflected in the angles between these two dimensions in the MDS space (47° vs. 150°, see Figure 8). In both scanning conditions, the correlations between ratings along most pairs of continua are not statistically significant, indicating that these texture continua are closer to orthogonal and contribute independently to the MDS perceptual space. One exception is the negative correlation between hardness and stickiness axes in the probe-scanning condition (r = −0.63, p < 0.01), suggesting that these continua are not independent.
Figure 8.
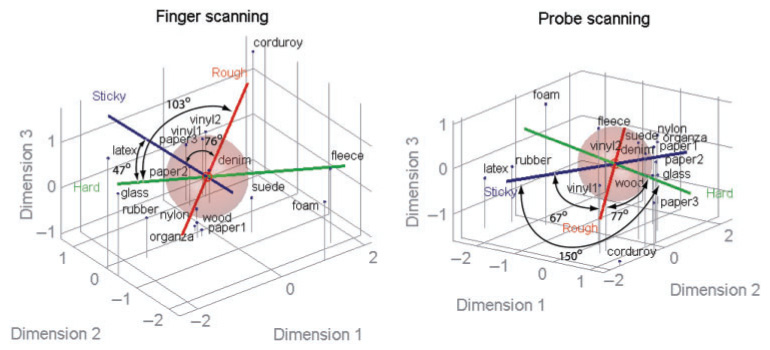
Relative locations of 16 textures are shown in the multidimensional scaling (MDS) space model based on perceived dissimilarity ratings (dark blue dots with vertical gray lines) and their relation to perceived roughness (red line), hardness (green line), and stickiness (dark blue line). Left panel shows a plot in the finger-scanning condition and right panel shows probe-scanning condition. The radii of the spheres represent the overall mean of adjective ratings, and angle values provide the degree of orthogonality between the two adjective axes. These angles were measured between the high ends of the two adjective axes (where the words “Rough”, “Hard”, or “Sticky” are placed). MDS solutions of dissimilarity ratings are based on 3D models in which each axis (Dimensions 1–3) is chosen arbitrarily to attain best fit between the model and normalized ratings. Averaged data over eight subjects in each scanning condition were used. Note a large difference in angle between the hardness and stickiness axes across two modes of scanning (47°: finger scanning, 150°: probe scanning), demonstrating that the correlations of the ratings along these two continua are different across two modes of scanning (Table III).
Table III.
Correlation coefficients between the roughness, hardness, and stickiness ratings along with angle (in parentheses) between textural axes in MDS space. The upper triangular matrix (shaded) shows results obtained in the finger-scanning condition; the lower triangular matrix (un-shaded) shows results obtained in the probe scanning condition. As the correlation nears zero, the axes become closer to orthogonal (90°). An angle greater than 90° indicates a negative correlation between the adjective ratings along the corresponding textural continua. Note that hardness and stickiness are positively but not significantly correlated in the finger-scanning condition, but negatively and significantly (p < 0.01) correlated in the probe-scanning condition (see the text). All other correlations are not statistically significant.
| Probe\finger | Roughness | Hardness | Stickiness |
|---|---|---|---|
| Roughness | – | −0.17 (103°) | 0.11 (76°) |
| Hardness | −0.16 (77°) | – | 0.25 (47°) |
| Stickiness | 0.45 (67°) | −0.63 (150°) | – |
Overall, the lack of orthogonality between hardness and stickiness axes in the probe-scanning condition suggests that the perceptual spaces in the two conditions are different. The reason for this difference is because some textures, such as glass and rubber, are perceived very differently in the two scanning modes. For instance, glass is perceived as sticky in the finger-scanning condition, but it is perceived as slippery in the probe-scanning condition (Figure 5).
To obtain an understanding of how textures are distributed in perceptual space, we performed a two-dimensional cluster analysis on the dissimilarity data. The cluster analysis uses hierarchical, binary cluster trees to provide information about whether certain groups of textures are perceptually similar (i.e., clustered), and how overall texture perceptual space might differ between different scanning conditions. Figure 9 illustrates that 9 out of 16 texture surfaces (56%) exhibited inter-texture perceptual distances within two standard deviations from the mean distance in the finger-scanning condition, while 11 out of 16 texture surfaces (69%) are found within a group of similar inter-texture distances in the probe-scanning condition (Figure 9). The remaining textures had larger inter-texture distances (Figure 9). About two-thirds of the textures that we used are at a similar inter-texture distance in perceptual space for both scanning conditions. Two other different linkage algorithms (“centroid distance” algorithm and “unweighted average distance” algorithm) yielded similar results. Some textures are perceived very differently in the two scanning conditions. For example, fleece and suede are not in the predominant texture cluster in the finger-scanning condition, but are in the majority group in the probe-scanning condition. The overall perceptual difference between the two modes of scanning is thus more complex than what individual adjective scaling might imply (Figure 5).
Figure 9.
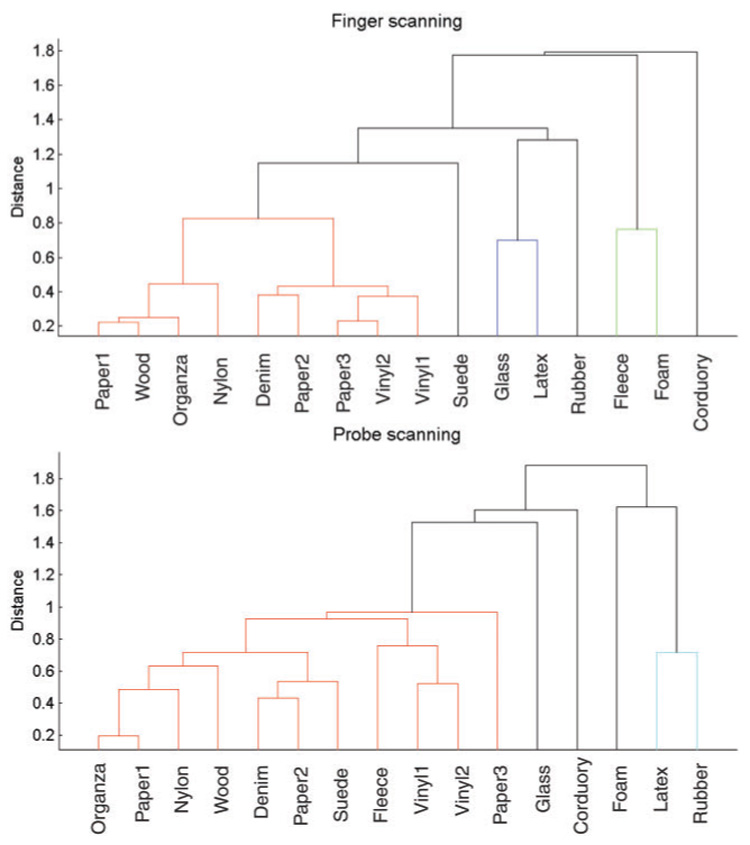
Cluster plots (dendrograms) of inter-texture distances in perceptual space based on the 3D multidimensional scaling (MDS) models using perceived dissimilarity of texture pairs. Different colors are used to categorize different clusters at the thresholded at, two standard deviations above the mean perceptual distance.
In the MDS analysis, the fit between model and data (dissimilarity ratings) varies with the number of dimensions in the model. Because higher-dimensional models have more degrees of freedom, the larger the number of dimensions used, the better the fit. Such a dependence on dimensionality can be examined by plotting the coefficient of determination (R²) against the dimensionality of the model. Figure 10 shows that for both finger and probe scanning, two dimensions are necessary to achieve an R² of at least 0.9 and that a 3D model explains 96–97% of the variance in the finger- and probe-scanning condition.
Figure 10.
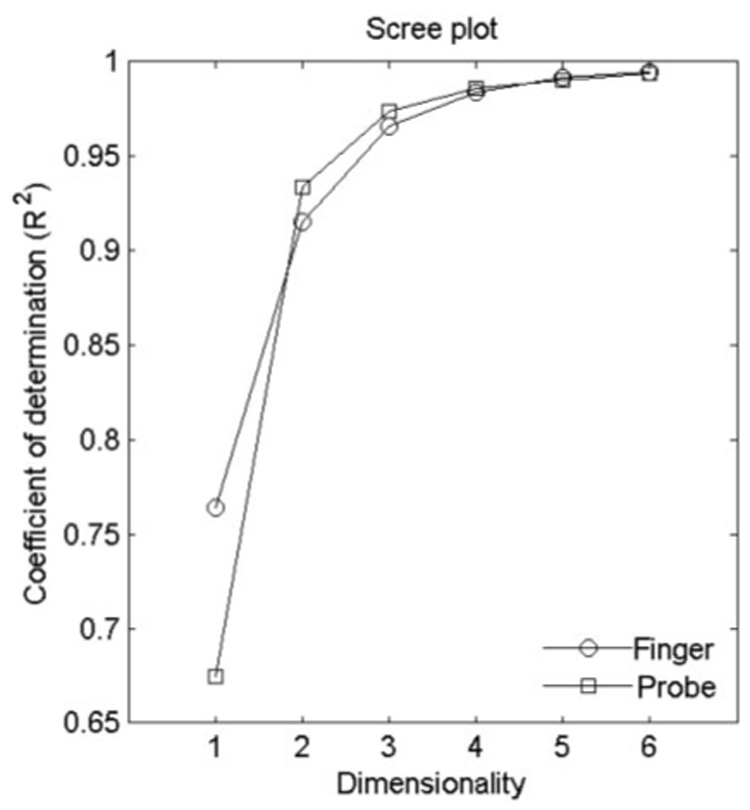
Scree plots illustrating the coefficient of determination R² achieved by an n-dimensional MDS model as a function of the dimensionality of the model for dissimilarity ratings obtained in the finger-scanning (circles) and probe-scanning (squares) conditions. Two or more dimensions are necessary to achieve a good fit in the finger-scanning and probe-scanning conditions at the level above R² = 0.9.
Physical correlates of roughness, hardness, and stickiness
Next, we assessed the extent to which certain physical quantities co-varied with the adjective ratings. Specifically, we analyzed the relationship between the three adjective ratings and the three physical quantities which, we surmised, might be correlated with these ratings, namely, vibratory power, compliance, and coefficient of friction.
The correlation coefficients between the log power of the texture-generated vibrations (which was recorded at a constant velocity of 40 mm/s; see Methods) and perceived roughness, hardness, and stickiness were 0.92, 0.04, and 0.23, when vibratory power was summed over a frequency range of 10–500 Hz. Thus, the roughness of a texture explored through a probe seems to be closely associated with the intensity of the vibrations it produces in the probe as gauged by their log power (Figure 11, left panel) and is poorly correlated with hardness and stickiness. Vibratory power was computed using vibrations elicited by the texture along the scanning direction (i.e., x-axis; see Methods). When vibratory power was computed using vibration data along the vertical axis (z-axis) or along the axis orthogonal to the scanning direction (y-axis), the correlation coefficients between log(vibratory power) and perceived roughness were 0.92 (z-axis) and 0.90 (y-axis), indicating that texture-generated vibrations along all three axes contained enough information to account for over 80% of the explained variance in perceived roughness (p < 0.001).
Figure 11.
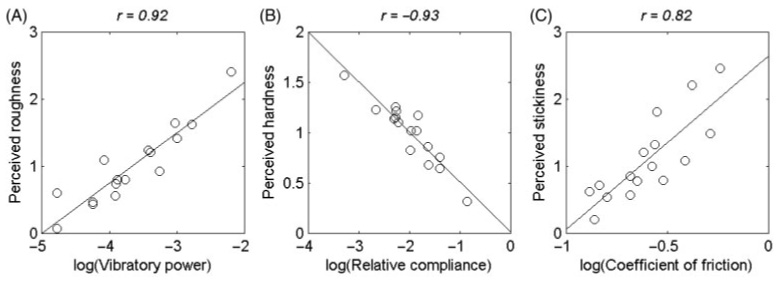
Physical quantities associated with perceived roughness, hardness, and stickiness when exploring textures through probes. (A) Log power of texture-elicited vibrations vs. subjective roughness magnitude. Correlation coefficients between log vibratory power and perceived roughness, hardness, and stickiness were 0.92, 0.04, and 0.23, respectively. (B) Perceived hardness vs. log relative compliance. Relative compliance was given by the ratio between the displacement of a Delrin 3-mm diameter probe into a textured surface and the weight that produced it (in cm/g). Correlation coefficients between log relative compliance and perceived roughness, hardness, and stickiness were 0.43, −0.93, and 0.59, respectively. (C) Perceived stickiness vs. the log coefficient of friction. Correlation coefficients between log coefficient of friction and perceived roughness, hardness, and stickiness were 0.57, −0.54, and 0.82, respectively. Thus, perceived roughness is associated with vibratory information, perceived hardness with relative compliance, and perceived stickiness with friction.
One would expect the perceived hardness of a surface to be negatively correlated with its compliance (LaMotte 2000).1 Indeed, the logarithm of relative compliance was highly predictive of hardness (r = −0.93; Figure 11 center panel), less so of stickiness (r = 0.59, p < 0.05), but not predictive of roughness (r = 0.43, p > 0.05). Similarly, stickiness is a sensory attribute that is associated with the friction between the finger or probe and the surface contacted (Smith and Scott 1996; Hollins et al. 2005). Indeed, the coefficient of kinetic friction was predictive of stickiness (r = 0.82, p < 0.001, Figure 11 right panel), less so of the other two dimensions (r = 0.57 and −0.54, for roughness and hardness, respectively, p <0.05 for both).
Of the three physical quantities that we measured, only compliance and friction were significantly but weakly correlated (r = 0.59, p < 0.05). Correlations between physical properties in a given stimulus set may underlie the correlations between adjective ratings observed in this and previous psychophysical studies. For instance, the ratings of stickiness and hardness obtained in the probe-scanning condition were significantly, but negatively correlated (r = −0.63, p < 0.01), reflecting the special relationship between the two underlying physical quantities.
In summary, when textures are explored with a probe, roughness seems to be correlated with the power of the texture-evoked vibrations, hardness increases as compliance decreases, and stickiness seems to increase as the coefficient of friction increases.
Discussion
We compared directly the textural percepts elicited when scanning natural textures with a probe to those evoked when the same textures are scanned with the bare finger. Subjects rated the surfaces along three well-established textural continua—roughness, hardness, and stickiness—and judged the overall dissimilarity of texture pairs.
Roughness judgments were similar in the probe-scanning and finger-scanning conditions, whereas judgments of hardness and stickiness differed to some extent across the two scanning conditions; judgments of textural dissimilarity obtained in the two conditions were also correlated but not identical. In both scanning conditions, pair-wise differences in adjectival ratings were highly predictive of the dissimilarity ratings. We also found that three physical quantities are highly predictive of the perceptual quality of the surfaces when they are scanned by a probe: (1) perceived roughness increased as the power of the vibrations elicited in the probe increased, (2) perceived hardness of a surface decreased as its compliance increased, and (3) perceived stickiness increased as the friction between the probe and texture increased.
Overall, perception in the two scanning conditions was similar, though not identical. The similarity in the properties of texture perception with direct and indirect touch is surprising because the information available to the subjects in the two modes is very different, and dissimilarity judgments can be based on any aspect of the neural discharge evoked by the stimuli. In one condition (bare finger), the observer has direct information about the intrinsic properties of the surface including its two-dimensional spatial structure, compliance, friction, and thermal properties. In the other condition (indirect touch), all of the information about the surface must be inferred from the vibrations, reaction forces, and displacements that are transmitted from the working end of the probe to the hand (Johnson and Hsiao 1992; Johnson and Yoshioka 2002).
Multidimensionality of texture perception
We found that the perceptual organization of textures as perceived through probes was similar to that with direct touch. Most of the variance in the dissimilarity ratings in both scanning conditions could be accounted for using a three-dimensional Cartesian model (Figure 8 and Figure 10). Furthermore, in both scanning conditions, the dissimilarity ratings could be predicted from the weighted sum of pairwise differences along the three continua: in the finger-scanning condition, 85% of the variance in the dissimilarity ratings could be explained from the adjectival difference scores; in the probe-scanning condition, the linear model accounted for 76% of the variance in the dissimilarity judgments (Figure 7). The weights (standardized coefficients) were somewhat different in the two scanning modes, suggesting that the salience of these textural properties may differ across conditions. For instance, dissimilarity was best predicted by differences in perceived hardness (followed by differences in roughness) in the finger condition, whereas stickiness (followed by roughness) was the best predictor of dissimilarity in the probe-scanning condition.
Results obtained in the finger-scanning condition are compatible with those obtained in previous studies, in which roughness, hardness, and stickiness were found to be closely associated with overall textural dissimilarity (Hollins et al. 1993, 2000). However, those studies found that roughness is typically the best predictor of dissimilarity. Why this is not the case here is unclear, but may be due to the range and type of textures that were used in this study. However, our textures do not appear clustered along a particular textural dimension or in a particular region in the texture perceptual space (Figure 8). This is supported by the cluster analysis which shows that the textures we used are relatively evenly distributed in the texture perceptual space with similar inter-texture perceptual distances within and across the two scanning conditions (Figure 8 and Figure 9).
The observed difference in the salience of hardness between the two scanning conditions may be because subjects were not allowed to tap the surfaces with the probe (in the indirect touch condition), an exploratory strategy that yields considerable information about surface compliance (LaMotte 2000). Adjective texture dimensions other than roughness, hardness, and stickiness have been examined by other researchers, and these dimensions include soft/harsh, thin/thick, and relief and hardness (Picard et al. 2003) or blur and clarity (Gescheider et al. 2005). The relationship between the texture perceptual space, on the one hand, and roughness, hardness, and stickiness, on the other, is different in direct touch and indirect touch. This difference stems from the fact that the correlation between perceived hardness and perceived stickiness is positive in the finger-scanning condition and negative in the probe-scanning condition (Table III).
Effects of scanning force and velocity on texture perception
We allowed subjects to scan the textures freely back and forth with instructions to use forces and velocities they desired. This free scanning method was used because it allowed subjects to maximize texture information about the surfaces. With indirect touch we found that perceived roughness is closely correlated with vibratory intensity (Figure 11A). Thus the force and velocity one employs to scan the texture are likely to influence the perception of its roughness since they may alter the intensity and frequency content of the vibrations it elicits in the skin. The relationship between perceived roughness and vibratory power was characterized by using vibration data obtained when textures were scanned at a constant velocity of 40 mm/s. The belt apparatus was used to minimize the effect of hand tremor and other physiological and mechanical noise. However, the actual scanning velocities and forces, which the subjects used, could be quite different from those used with the belt apparatus. We thus wished to determine the range of scanning forces and velocities used by the subjects, and whether the actual scanning forces and velocities influenced their roughness judgments.
To address these questions, we examined the scanning force and velocity during the roughness judgment task through a probe. We tested only roughness perception with indirect touch since roughness is correlated with vibratory power with indirect touch (Figure 11A), and the vibratory information is most likely to be affected by scanning force and velocity. Three subjects were tested. The results revealed that these subjects used different ranges of scanning forces and velocities with the mean scanning force varying from 134 to 282 g (overall average 195 g), and the average scanning velocity varying from 17 to 74 mm/s (overall average 42 mm/s). Despite these differences in force and velocity employed by these subjects, perceived roughness ratings were highly correlated with each other (r = 0.86–0.95), suggesting that the ranges of mean force, mean velocity, and their fluctuations did not alter roughness judgments.
Several other studies have also shown that the variations in scanning velocity and force have little effect, over a range normally used, on the roughness perception with direct touch (Lederman and Taylor 1972; Lederman 1974; Lamb 1983; Morley et al. 1983; Lederman et al. 1999; Lederman and Klatzky 2004). With indirect touch, perceived roughness also does not change significantly even when scanning velocity is increased fourfold (Lederman et al. 1999). These observations combined with our findings suggest that the relationship between the neural discharge upon which the behavior is based and the texture-related vibratory information via a probe is not simply related to vibratory power.
What are roughness, hardness, and stickiness?
Although spatial variability in the SA1 response is linear with roughness (Connor et al. 1990; Connor and Johnson 1992; Blake et al. 1997; Yoshioka et al. 2001), the physical quantity underlying perceived roughness is unclear. For example, with direct touch, the perceived roughness of gratings has been found to increase as groove width increases and to decrease as ridge width increases (Lederman and Taylor 1972; Sathian et al. 1989; Yoshioka et al. 2001), and the perceived roughness of sandpapers is a power function of particle size (Ekman et al. 1965; Hollins and Risner 2000). In other studies using embossed dot patterns, the relationship between perceived roughness and dot size, height, and spacing has been shown to be complex. Connor et al. (1990) found that roughness was an inverted “U” shaped function of dot spacing; Blake et al. (1997) found that, for constant dot spacing, roughness increased with dot height and Meftah et al. (2000) found that the relationship between perceived roughess and dot spacing is linear for patterns with large dot heights. As in probe scanning, however, it is possible that the relationship between dot spacing and perceived roughness is monotonic as long as the finger does not reach the “drop point”, that is, the inter-element spacing at which the finger or probe touches the bottom of a surface (Klatzky et al. 2003). In any case, the physical determinant of perceived roughness with direct touch is not clear. Roughness seems to be associated with the spatial modulation in the surface, something that can be termed “surface coarseness”.
In studies using probes, Klatzky et al. (2003) found that perceived roughness was an inverted “U” shaped function of dot spacing—as has been found with direct touch. As discussed above, however, the stimulus that impinges on the skin is very different. One quantity that influences perceived roughness through indirect touch is vibratory power: as the probe is scanned across a textured surface, the probe interacts with the surface in such a way as to produce vibrations. One difference between the power measure used by Bensmaia and Hollins and the one adopted here is that their vibrations were filtered using the inverted Pacinian threshold power as a function of frequency (following Makous et al. 1995). In the present study, raw power was as good a predictor of perceived roughness as was Pacinian-filtered power (the correlation between roughness and power was 0.92 for raw power and 0.89 for PC-weighted power).
Based on the results presented above, we propose that the three quantities, vibratory power, compliance, and friction parameterize the physical space within which textures vary when these are explored through a probe (Figure 11). We propose that using these qualities one should be able to accurately simulate texture perception with a probe.
One component of perceived texture is not, however, captured in this dimensional scheme: some textures consist of structured or patterned elements. The structure in these surface textures can be represented as a structured spatial pattern of activity, or, for fine textures or indirect touch, as a structured temporal pattern of activity. For instance, the periodic structure of corduroy can be readily perceived and is a property that is not captured by its roughness, hardness, or stickiness. When scanning corduroy (a grating) with the bare finger, the response evoked in mechanoreceptive afferents has a strong periodic component, both in the temporal and in the spatial domain (Phillips and Johnson 1981; Goodwin and Morley 1987; Morley and Goodwin 1987; Bensmaia et al. 2006). When scanned with a probe, the vibrations produced by corduroy have a strong periodic component (Figure 2). This periodic property of the textural percept, when represented temporally, has been termed “textural timbre” (Bensmaia and Hollins 2005).
As for the physical determinants underlying hardness and softness, the perceived hardness of a surface has been associated with its compliance, both with direct and indirect touch (Srinivasan and LaMotte 1995; LaMotte 2000), whereas the perceived stickiness of a texture is attributed to the coefficient of friction between finger and surface (Smith and Scott 1996). Hollins et al. (2004, 2005) varied the perceived stickiness of a virtual texture generated using a force-feedback device by manipulating the resistance force applied on the probe as it is scanned across the texture. Thus, the notion that compliance and friction are associated with hardness and stickiness, respectively, is consistent with reports from previous studies.
Neural mechanisms of texture perception
Much of the research on texture perception, both with direct and indirect touch, has focused on the perception of roughness. One of the important questions addressed in this line of inquiry is: are the neural codes underlying roughness perception through direct and indirect touch different? With direct touch, the perceived roughness of a coarse surface has been shown by Johnson and Hsiao and their colleagues to be a function of the spatial variability in the activity it elicits in SA1 afferents over a wide range of textures (Connor et al. 1990; Connor and Johnson 1992; Blake et al. 1997; Yoshioka et al. 2001). After testing a wide range of potential neural codes, they concluded that all codes based on PC, RA, and SA2 responses, mean rate codes, and temporal codes could be rejected (see Johnson and Yoshioka 2002 for a review). Hollins and colleagues have posed a hypothesis that the perception of roughness for fine textures use high frequency vibratory cues (Hollins et al. 1998, 2001; Hollins and Risner 2000), and that direct touch and indirect touch may use different neural mechanisms (Hollins et al. 2006). In the present study, we provide evidence that vibratory cues play a major role in roughness perception with indirect touch.
When scanning a texture with a probe, the perception of the contour of the probe, which is in direct contact with the fingers, is likely mediated peripherally by SA1 afferents (Goodwin et al. 1995; LaMotte et al. 1998). The roughness of the scanned surface, however, seems to be a function of the vibrations elicited in the probe as it is scanned across the surface (see Figure 6, left panel and Figure 11A). The perception of these texture-elicited vibrations is likely mediated peripherally by PC afferents. Both SA1 and RA afferents are far more sensitive to punctate stimuli, corners, and edges than they are to flat or gently graded surfaces. So, although SA1 afferents encode the curvature of the probe as a spatially graded pattern of activity, this pattern is probably not substantially modulated by the texture-elicited vibrations. When a vibratory stimulus is presented to the skin through a cylindrical stimulator, and hence the area over which the stimulator contacts skin is large, SA1 afferents become unresponsive to the vibrations and RA thresholds increase substantially. In contrast, PC thresholds decrease considerably as the area of skin contact increases, as shown in both psychophysical (Verrillo 1963; Brisben et al. 1999; Morioka and Griffin 2005a, 2005b) and neurophysiological (Yoshioka et al. manuscript in preparation) experiments. Thus, PC fibers are exquisitely sensitive to vibrations transmitted through a probe, whereas RA fibers are far less so (and SA1 fibers are almost completely insensitive) when the contactor area is large (as is the case with a probe held in the hand).
While scanning a surface with a probe, then, there is a duality of percepts: the contour of the probe is represented as patterned activity in a population of SA1 afferents while the roughness of the texture is represented in the activity of PC (and possibly RA) afferents. In fact, attention can be focused on the contour of the probe, a percept that is projected to the point of contact between hand and probe, or it can be focused on the texture of the surface, a percept that is projected to the point of contact of the probe with the surface. This ability to switch one’s focus of attention from the probe to the surface is compatible with the hypothesis that two distinct neural signals mediate these two tactile percepts.
Little is known about the neural mechanisms underlying the tactile perception of hardness. With direct touch, the perception of softness/hardness may be mediated by the spatio-temporal pattern of activity evoked in SA1 afferents, itself determined by the pressure distribution over the contact area (Srinivasan and LaMotte 1995). However, proprioceptive information may play a role in the perception of softness/hardness through a probe: if the velocity with which a surface is tapped against the probe varies, subjects’ ability to judge its hardness is impaired (LaMotte 2000). Thus, information about the probe’s motion relative to the object seems to be necessary to judge its hardness, a requirement that seems to implicate SA2 input (Edin and Johansson 1995). In the present study hardness information was not obtained by tapping the probe against the surface as this was not permitted. Rather, the subjects likely obtained hardness information by applying a force against the texture and observing the degree to which the probe indented it. Thus, proprioceptive information about the applied forces and small displacements along the axis of the probe may play an important role in hardness perception.
With direct touch, perceived stickiness has been shown to be closely related to the kinetic friction between skin and surface, that is, the ratio between the force exerted normal to the surface to that exerted parallel to the plane of the surface (Smith and Scott 1996; Hollins et al. 2004). Furthermore, when judging stickiness, subjects do not substantially vary the normal forces they apply on the surface, but the applied tangential forces tend to vary across surfaces, suggesting that tangential forces are critical in the perception of stickiness (Smith and Scott 1996). As SA2 fibers are sensitive to skin stretch (Witt and Hensel 1959; Iggo 1966; Knibestöl 1975), this population of mechanoreceptive afferent fibers may provide the peripheral signals underlying stickiness perception, although recent evidence suggests that other mechanoreceptive afferents also convey information about forces exerted on the skin (Birznieks et al. 2001). Vibratory cues may also be a factor in the perception of stickiness: as the skin skitters across a sticky surface, vibrations are produced in the skin (likely transduced and processed within the Pacinian system) which may contribute to the perception of stickiness (Bensmaia and Hollins 2005). With indirect touch, stickiness perception may rely on proprioceptive information about the normal and lateral (= tangential) forces exerted on the probe while dragging it across the surface. Indeed, the perceived stickiness of a surface scanned with a probe is determined by the coefficient of friction, that is, the ratio between tangential and normal forces exerted on the surface (Figure 11). Vibratory cues may also factor into the perception of stickiness through a probe.
The major difference between direct touch and indirect touch is that a spatial image of the texture is available at the finger pad in direct touch, whereas the spatial image at the finger pads is a contour of the probe with indirect touch (Klatzky et al. 2003). The temporal representation of the textures with indirect touch becomes an important factor in providing texture information. Thus, the neural mechanisms involved in probe-based texture perception are likely to be different from those in a direct touch. The neural coding of texture perception ultimately relies on understanding the relationship between the neural responses and behavior. To elucidate these neural mechanisms, the peripheral neural image evoked by surfaces differing along multiple textural continua and explored in the two scanning modes needs to be characterized and linked to behavioral results, as has been done in the study of roughness perception.
Acknowledgments
We thank Dr Mark Hollins for the generous use of his experimental apparatus, Justin Killebrew and Frank Dammann for computer-related technical support, Bill Nash and Bill Quinlan for assistance with the design and construction of the experimental apparatus, Julia Zhou, Bryce Olenczak, Ashley Watson, and Lisa Carey for assistance with the data collection. Supported by NIH grants NS054180, NS18787, NS34086, NS38034, and DC 00095.
Footnotes
Publisher's Disclaimer: Full terms and conditions of use: http://www.informaworld.com/terms-and-conditions-of-access.pdf
This article maybe used for research, teaching and private study purposes. Any substantial or systematic reproduction, re-distribution, re-selling, loan or sub-licensing, systematic supply or distribution in any form to anyone is expressly forbidden.
The publisher does not give any warranty express or implied or make any representation that the contents will be complete or accurate or up to date. The accuracy of any instructions, formulae and drug doses should be independently verified with primary sources. The publisher shall not be liable for any loss, actions, claims, proceedings, demand or costs or damages whatsoever or howsoever caused arising directly or indirectly in connection with or arising out of the use of this material.
© Taylor and Francis 2007
Note 1. In fact, LaMotte studied the perception of softness, which marks the other extreme on the hardness continuum.
References
- Bensmaia SJ, Craig JC, Yoshioka T, Johnson KO. SA1 and RA afferent responses to static and vibrating gratings. J Neurophysiol. 2006;95:1771–1782. doi: 10.1152/jn.00877.2005. [DOI] [PMC free article] [PubMed] [Google Scholar]
- Bensmaia SJ, Hollins M. Pacinian representations of fine surface texture. Percept Psychophys. 2005;67:842–854. doi: 10.3758/bf03193537. [DOI] [PubMed] [Google Scholar]
- Birznieks I, Jenmalm P, Goodwin AW, Johansson RS. Encoding of direction of fingertip forces by human tactile afferents. J Neurosci. 2001;21:8222–8237. doi: 10.1523/JNEUROSCI.21-20-08222.2001. [DOI] [PMC free article] [PubMed] [Google Scholar]
- Blake DT, Hsiao SS, Johnson KO. Neural coding mechanisms in tactile pattern recognition: The relative contributions of slowly and rapidly adapting mechanoreceptors to perceived roughness. J Neurosci. 1997;17:7480–7489. doi: 10.1523/JNEUROSCI.17-19-07480.1997. [DOI] [PMC free article] [PubMed] [Google Scholar]
- Brisben AJ, Hsiao SS, Johnson KO. Detection of vibration transmitted through an object grasped in the hand. J Neurophysiol. 1999;81:1548–1558. doi: 10.1152/jn.1999.81.4.1548. [DOI] [PubMed] [Google Scholar]
- Connor CE, Hsiao SS, Phillips JR, Johnson KO. Tactile roughness: Neural codes that account for psychophysical magnitude estimates. J Neurosci. 1990;10:3823–3836. doi: 10.1523/JNEUROSCI.10-12-03823.1990. [DOI] [PMC free article] [PubMed] [Google Scholar]
- Connor CE, Johnson KO. Neural coding of tactile texture: Comparisons of spatial and temporal mechanisms for roughness perception. J Neurosci. 1992;12:3414–3426. doi: 10.1523/JNEUROSCI.12-09-03414.1992. [DOI] [PMC free article] [PubMed] [Google Scholar]
- Craig JC, Rollman GB. Somesthesis. Annu Rev Psychol. 1999;50:305–331. doi: 10.1146/annurev.psych.50.1.305. [DOI] [PubMed] [Google Scholar]
- Edin BB, Johansson N. Skin strain patterns provide kinaesthetic information to the human central nervous system. J Physiol. 1995;487:243–251. doi: 10.1113/jphysiol.1995.sp020875. [DOI] [PMC free article] [PubMed] [Google Scholar]
- Ekman G, Hosman J, Lindstrom B. Roughness, smoothness and preference: A study of quantitative relations in individual subjects. J Exp Psychol. 1965;70:18–26. doi: 10.1037/h0021985. [DOI] [PubMed] [Google Scholar]
- Gardner EP, Palmer CI. Simulation of motion on the skin. I. Receptive fields and temporal frequency coding by cutaneous mechanoreceptors of Optacon pulses delivered to the hand. J Neurophysiol. 1989a;62:1410–1436. doi: 10.1152/jn.1989.62.6.1410. [DOI] [PubMed] [Google Scholar]
- Gardner EP, Palmer CI. Simulation of motion on the skin. II. Cutaneous mechanoreceptor coding of the width and texture of bar patterns displaced across the Optacon. J Neurophysiol. 1989b;62:1437–1460. doi: 10.1152/jn.1989.62.6.1437. [DOI] [PubMed] [Google Scholar]
- Gescheider GA, Bolanowski SJ, Greenfield TC, Brunette KE. Perception of the tactile texture of raised-dot patterns: A multidimensional analysis. Somatosens Mot Res. 2005;22:127–140. doi: 10.1080/08990220500262018. [DOI] [PubMed] [Google Scholar]
- Goodwin AW, Browning AS, Wheat HE. Representation of curved surfaces in responses of mechanoreceptive afferent fibers innervating the monkey’s fingerpad. J Neurosci. 1995;15:798–810. doi: 10.1523/JNEUROSCI.15-01-00798.1995. [DOI] [PMC free article] [PubMed] [Google Scholar]
- Goodwin AW, Morley JW. Sinusoidal movement of a grating across the monkey’s fingerpad: Representation of grating and movement features in afferent fiber responses. J Neurosci. 1987;7:2168–2180. doi: 10.1523/JNEUROSCI.07-07-02168.1987. [DOI] [PMC free article] [PubMed] [Google Scholar]
- Hollins M, Bensmaïa SJ, Karlof K, Young F. Individual differences in perceptual space for tactile textures: Evidence from multidimensional scaling. Percept Psychophys. 2000;62:1534–1544. doi: 10.3758/bf03212154. [DOI] [PubMed] [Google Scholar]
- Hollins M, Bensmaïa SJ, Risner R. The duplex theory of tactile texture perception. In: Grondin S, Lacouture Y, editors. Fechner Day 98: Proceedings of the Fourteenth Annual Meeting of the International Society for Psychophysics. Quebec Canada: The International Society for Psychophysics; 1998. pp. 115–120. [Google Scholar]
- Hollins M, Bensmaia SJ, Washburn S. Vibrotactile adaptation impairs discrimination of fine, but not coarse, textures. Somatosens Mot Res. 2001;18:253–262. doi: 10.1080/01421590120089640. [DOI] [PubMed] [Google Scholar]
- Hollins M, Faldowski R, Rao S, Young F. Perceptual dimensions of tactile surface texture: A multidimensional-scaling analysis. Percept Psychophys. 1993;54:697–705. doi: 10.3758/bf03211795. [DOI] [PubMed] [Google Scholar]
- Hollins M, Lorenz F, Harper D. Somatosensory coding of roughness: The effect of texture adaptation in direct and indirect touch. J Neurosci. 2006;26:5582–5588. doi: 10.1523/JNEUROSCI.0028-06.2006. [DOI] [PMC free article] [PubMed] [Google Scholar]
- Hollins M, Lorenz F, Seeger A, Taylor R. Factors contributing to the integration of textural qualities: Evidence from virtual surfaces. Somatosens Mot Res. 2005;22:193–206. doi: 10.1080/08990220500262380. [DOI] [PubMed] [Google Scholar]
- Hollins M, Risner SR. Evidence for the duplex theory of tactile texture perception. Percept Psychophys. 2000;62:695–705. doi: 10.3758/bf03206916. [DOI] [PubMed] [Google Scholar]
- Hollins M, Seeger A, Pelli G, Taylor R. Haptic perception of virtual surfaces: Scaling subjective qualities and interstimulus differences. Perception. 2004;33:1001–1019. doi: 10.1068/p5025. [DOI] [PubMed] [Google Scholar]
- Iggo A. Cutaneous receptors with a high sensitivity to mechanical displacement. In: de Reuck AV, Knight J, editors. Touch, heat and pain. Boston: Little, Brown; 1966. pp. 237–260. [Google Scholar]
- Johnson KO, Msiao SS. Neural Mechanisms of factual form and texture perception. Annu Rev Neurosci. 1992;15:227–250. doi: 10.1146/annurev.ne.15.030192.001303. [DOI] [PubMed] [Google Scholar]
- Johnson KO. Neural basis of haptic perception. In: Yantis S, editor. Stevens handbook of experimental psychology. 3rd ed. Vol. 1. Sensation and perception. New York: Wiley; 2002. pp. 537–583. [Google Scholar]
- Johnson KO, Yoshioka T. Neural mechanisms of tactile form and texture perception. In: Nelson RJ, editor. The somatosensory system: Deciphering the brain’s own body image. Boca Raton: CRC Press; 2002. pp. 73–101. [Google Scholar]
- Katz D. Der Aufbau der Tastwelt Leipzig: Barth. 1925. [Google Scholar]
- Klatzky RL, Lederman SJ, Hamilton C, Grindley M, Swendsen RH. Feeling textures through a probe: Effects of probe and surface geometry and exploratory factors. Percept Psychophys. 2003;65:613–631. doi: 10.3758/bf03194587. [DOI] [PubMed] [Google Scholar]
- Knibestöl M. Stimulus-response functions of slowly adapting mechanoreceptors in the human glabrous skin area. J Physiol. 1975;245:63–80. doi: 10.1113/jphysiol.1975.sp010835. [DOI] [PMC free article] [PubMed] [Google Scholar]
- Kops CE, Gardner EP. Discrimination of simulated texture patterns on the human hand. J Neurophysiol. 1996;76:1145–1165. doi: 10.1152/jn.1996.76.2.1145. [DOI] [PubMed] [Google Scholar]
- Lamb GD. Tactile discrimination of textured surfaces: Psychophysical performance measurements in humans. J Physiol. 1983;338:551–565. doi: 10.1113/jphysiol.1983.sp014689. [DOI] [PMC free article] [PubMed] [Google Scholar]
- LaMotte RH. Softness discrimination with a tool. J Neurophysiol. 2000;83:1777–1786. doi: 10.1152/jn.2000.83.4.1777. [DOI] [PubMed] [Google Scholar]
- LaMotte RH, Friedman RM, Lu C, Khalsa PS, Srinivasan MA. Raised object on a planar surface stroked across the fingerpad: Responses of cutaneous mechanoreceptors to shape and orientation. J Neurophysiol. 1998;80:2446–2466. doi: 10.1152/jn.1998.80.5.2446. [DOI] [PubMed] [Google Scholar]
- Lederman SJ. Tactile roughness of grooved surfaces: The touching process and the effects of macro- and microsurface structure. Percept Psychophys. 1974;16:385–395. [Google Scholar]
- Lederman SJ, Klatzky RL. Multisensory texture perception. In: Spence C, Calvert G, Stein BE, editors. The handbook of multisensory processes. Cambridge, MA: MIT Press; 2004. pp. 107–122. [Google Scholar]
- Lederman SJ, Klatzky RL, Hamilton CL, Ramsay GI. Perceiving surface roughness via a rigid probe: Effects of exploration speed and mode of touch. Electron J Haptic Res. 1999;1:1–20. [Google Scholar]
- Lederman SJ, Taylor MM. Fingertip force, surface geometry, and the perception of roughness by active touch. Percept Psychophys. 1972;12:401–408. [Google Scholar]
- Makous JC, Friedman RM, Vierck CJ. A Critical band filter in touch. J Neurosci. 1995;15:2808–2818. doi: 10.1523/JNEUROSCI.15-04-02808.1995. [DOI] [PMC free article] [PubMed] [Google Scholar]
- Meftah EM, Belingard L, Chapman CE. Relative effects of the spatial and temporal characteristics of scanned surfaces on human perception of tactile roughness using passive touch. Exp Brain Res. 2000;132:351–361. doi: 10.1007/s002210000348. [DOI] [PubMed] [Google Scholar]
- Morioka M, Griffin MJ. Independent responses of Pacinian and Non-Pacinian systems with hand-transmitted vibration detected from masked thresholds. Somatosens Mot Res. 2005a;22:69–84. doi: 10.1080/08990220500084644. [DOI] [PubMed] [Google Scholar]
- Morioka M, Griffin MJ. Thresholds for the perception of hand-transmitted vibration: Dependence on contact area and contact location. Somatosens Mot Res. 2005b;22:281–297. doi: 10.1080/08990220500420400. [DOI] [PubMed] [Google Scholar]
- Morley JW, Goodwin AW. Sinusoidal movement of a grating across the monkey’s fingerpad: Temporal patterns of afferent fiber responses. J Neurosci. 1987;7:2181–2191. doi: 10.1523/JNEUROSCI.07-07-02181.1987. [DOI] [PMC free article] [PubMed] [Google Scholar]
- Morley JW, Goodwin AW, Darian-Smith I. Tactile discrimination of gratings. Exp Brain Res. 1983;49:291–299. doi: 10.1007/BF00238588. [DOI] [PubMed] [Google Scholar]
- Phillips JR, Johnson KO. Tactile spatial resolution: II. Neural representation of bars, edges, and gratings in monkey primary afferents. J Neurophysiol. 1981;46:1192–1203. doi: 10.1152/jn.1981.46.6.1192. [DOI] [PubMed] [Google Scholar]
- Picard D, Dacremont C, Valentin D, Giboreau A. Perceptual dimensions of tactile textures. Acta Psychol (Amst) 2003;114:165–184. doi: 10.1016/j.actpsy.2003.08.001. [DOI] [PubMed] [Google Scholar]
- Sathian K, Goodwin AW, John KT, Darian-Smith I. Perceived roughness of a grating: Correlation with responses of mechanoreceptive afferents innervating the monkey’s fingerpad. J Neurosci. 1989;9:1273–1279. doi: 10.1523/JNEUROSCI.09-04-01273.1989. [DOI] [PMC free article] [PubMed] [Google Scholar]
- Smith AM, Scott SH. Subjective scaling of smooth surface friction. J Neurophysiol. 1996;75:1957–1962. doi: 10.1152/jn.1996.75.5.1957. [DOI] [PubMed] [Google Scholar]
- Srinivasan MA, LaMotte RH. Tactual discrimination of softness. J Neurophysiol. 1995;73:88–101. doi: 10.1152/jn.1995.73.1.88. [DOI] [PubMed] [Google Scholar]
- Verrillo RT. Effect of contactor area on the vibrotactile threshold. J Acoust Soc Am. 1963;35:1962–1966. [Google Scholar]
- Witt I, Hensel H. Afferente Impulse aus der Extremitatenhaut der Katze bei thermischer und mechanischer Reisung. Pflugers Arch ges Physiol. 1959;268:582–596. doi: 10.1007/BF00362294. [DOI] [PubMed] [Google Scholar]
- Yoshioka T, Gibb B, Dorsch AK, Hsiao SS, Johnson KO. Neural coding mechanisms underlying perceived roughness of finely textured surfaces. J Neurosci. 2001;21:6905–6916. doi: 10.1523/JNEUROSCI.21-17-06905.2001. [DOI] [PMC free article] [PubMed] [Google Scholar]