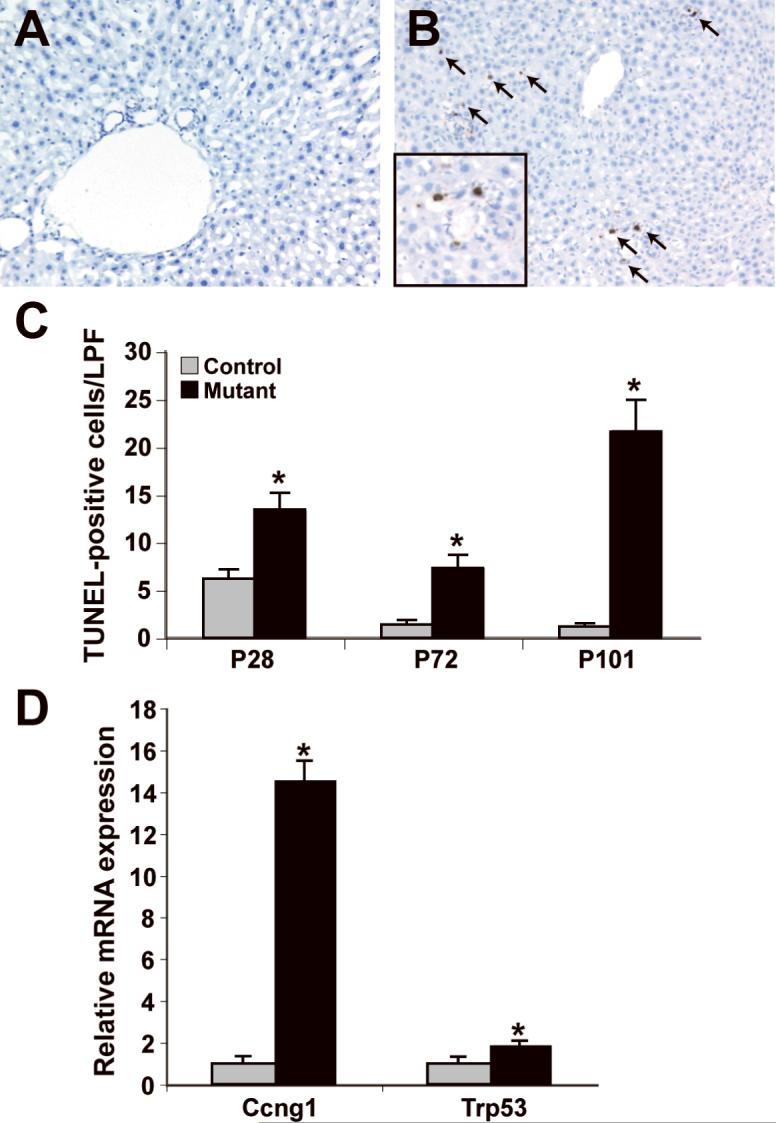
Figure 6. Dicer1 mutant livers display increased apoptosis.

A, B: TUNEL assay of control (A) and mutant (B) liver sections reveals numerous apoptotic bodies (arrows) per low powered field in mutant liver sections (P101 shown). C: Quantification of the results of the TUNEL assay (n=3; *p<0.05). D: Ccng1 and Trp53 expression in P40 purified hepatocytes, normalized to Hprt (control, n=3; mutant, n=5). LPF, low powered field.
