
Figure 5. HDO-CLEM morphometry analysis.
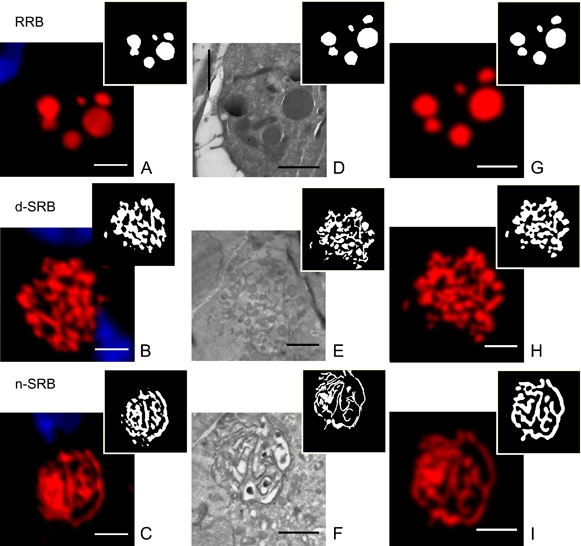
A–C) CLSM images of RRBs, (A) d-SRB (B) and n-SRB (C), immunofluorescence labeled for μ-ΔCh1 (Cy3). Insets, segmented images obtained by WAT_MicroSCoBiOJ. D–F) TEM images of the RBs shown in (A–C). Insets represent the segmented images (manual membrane contouring). G–I) CLSM simulation images of (D–F) obtained convolving segmented TEM images with a point spread function (see Image process formation in File S1). Simulation takes into account all imaging conditions used for the original CLSM imaging in (A–C). Insets, segmented images obtained by WAT MicroSCoBiOJ. Bars: 2 μm.