
Figure 1.
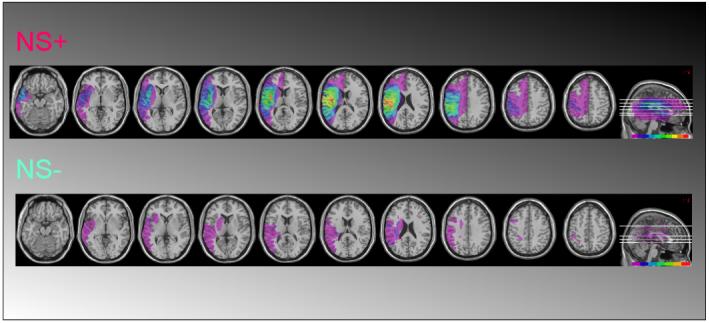
Summary of lesions and overlap in our sample of right-hemisphere stroke patients with neglect (NS+, top row) and those without neglect (NS-) participating in the study. The color-scale at bottom-right of each row indicates the proportion of patients (higher for colors further to the right in the scale).