

Abstract
Objective
To ascertain the reliability of applying the WHO Cardiovascular Risk Management Package by non-physician health-care workers (NPHWs) in typical primary health-care settings.
Methods
Based on an a priori 80% agreement level between the NPHWs and the “expert” physicians (gold standard), 649 paired (matched) applications of the protocol were obtained for analysis using Kappa statistic and multivariate logit regression.
Findings
Results indicate over 80% agreement between raters, from moderate to perfect levels of agreement in almost all of the sections in the package. The odds of obtaining a difference between raters and a benchmark are not statistically significant.
Conclusion
Applying the WHO Cardiovascular Risk Management Package, NPHWs can be retrained to reliably and effectively assess and manage cardiovascular risks in primary health-care settings where there are no attending physicians. The package could be a useful tool for scaling up the management of cardiovascular diseases in primary health care.
Résumé
Objectif
S’assurer de la fiabilité de l’utilisation du module de prise en charge du risque cardiovasculaire de l’OMS par des agents de santé non médecins, dans le cadre d’établissements de soins de santé primaire ordinaires.
Méthodes
Sur la base d’un accord de 80% entre les résultats de l’utilisation du module par des agents de santé non médecins et par des médecins compétents (référence), on a obtenu 649 paires d’applications (applications appariées) du protocole par analyse statistique Kappa et régression logistique multivariée (logit).
Résultats
L’étude indique un accord global de plus de 80% entre les évaluateurs, la concordance allant d’un niveau moyen à celui de la perfection pour presque tous les volets du module. La différence entre les évaluateurs et une évaluation de référence n’était pas statistiquement significative.
Conclusion
Il est possible de renforcer la formation des agents de santé de manière à ce qu’ils soient en mesure, en utilisant le module OMS, d’évaluer et de prendre en charge de manière fiable et efficace le risque cardiovasculaire dans les établissements de soins de santé primaire en l’absence de médecin. Ce module pourrait être utile au développement de la prise en charge des maladies cardiovasculaires dans le contexte des soins de santé primaire.
Resumen
Objetivo
Determinar la fiabilidad de la aplicación del Módulo de Gestión del Riesgo Cardiovascular de la OMS por personal sanitario no médico (PSNM) en los entornos de atención primaria habituales.
Métodos
Partiendo de un nivel de concordancia a priori del 80% entre el PSNM y los médicos «expertos» (criterio de referencia), se reunieron 649 aplicaciones del protocolo emparejadas para analizarlas mediante el estadístico Kappa y un modelo de regresión logit multifactorial.
Resultados
Los resultados muestran una concordancia de más del 80% entre los evaluadores, con niveles de coincidencia entre moderados y perfectos en casi todas las secciones del módulo. Las diferencias entre los evaluadores y la referencia utilizada no son estadísticamente significativas.
Conclusión
Aplicando el Módulo de Gestión del Riesgo Cardiovascular de la OMS, es posible formar al PSNM para que evalúe y controle de manera fiable y eficaz el riesgo cardiovascular en entornos de atención primaria en los que no hay ningún médico. El módulo podría ser un valioso instrumento para expandir el manejo de las enfermedades cardiovasculares en los entornos de atención primaria.
ملخص
الەدف
التأكُّد من مدى موثوقية تطبيق العاملين في الرعاية الصحية من غير الأطباء للحزمة التي أَعَدَّتەا منظمة الصحة العالمية لتدبير الأخطار القلبية الوعائية في المواقع النموذجية للرعاية الصحية الأولية.
الطريقة
استناداً إلى مستوى الاتفاق المبدئي الذي تبلغ نسبتە 80% بين العاملين في الرعاية الصحية من غير الأطباء وبين الأطباء الخبراء (الذين يعدّون بمثابة المعيار الذەبي)، جمعت الدراسة 649 من الاستمارات المزدوجة (المتقارنة التي أعدەا الفريقان من العاملين الصحيين من غير الأطباء ومن الأطباء) حول البروتوكول المطبق لتقيـيم وتدبير الأخطار القلبية والوعائية، ثم حلَّلتەا باستخدام التحوُّف اللوغاريتمي المتعدِّد المتغيرات والتحوُّف الإحصائي كابا.
الموجودات
أشارت النتائج إلى وجود ما يزيد على 80 بالمئة من التـوافق بين واضعي المعدلات، ويتـراوح ەذا التوافق بين مستوى التوافق الكامل في جميع الفقرات المندرجة ضمن حزمة المعلومات وبين التوافق المتوسط. ولم تكن قيمة الأرجحية التي حصلنا عليەا من الفروق بين واضعي المعدلات من جەة وبين العلامات المميزة ذات اعتداد إحصائي.
الاستنتاج
يمكن إعادة تدريب العاملين في الرعاية الصحية من غير الأطباء على تطبيق حزمة معلومات منظمة الصحة العالمية حول تدبير الأخطار القلبية الوعائية وعلى تقيـيم وتدبير الأخطار القلبية الوعائية بشكل فعَّال وموثوق بە في مواقع تقديم الرعاية الصحية الأولية التي تفتقد الأطباء. ويمكن لحزمة معلومات منظمة الصحة العالمية حول تدبير الأخطار القلبية الوعائية أن تكون أداة مفيدة للنەوض بتدبير الأمراض القلبية الوعائية في الرعاية الصحية الأولية.
Introduction
Chronic noncommunicable diseases, especially cardiovascular diseases, are a major and increasing cause of death and disability worldwide, and may have retarding effects on the economies of affected individuals, households and countries.1,2 The epidemiological and economic effects of cardiovascular diseases (specifically stroke and heart diseases) and diabetes, are especially pervasive in low- and middle-income countries1–3 where health systems are less likely to adequately respond to the challenges of the increasing burden. Socioeconomic barriers and inequalities in access to treatment, suboptimal staffing of health-care facilities and limited capacity for ancillary investigations that complement cardiovascular risk profiling are some of the common problems limiting these countries’ control of chronic diseases, especially at the primary health-care level.4 This situation is worsened by the brain-drain syndrome5–9 resulting in shortages of skilled workers.
The absolute-risk approach for the clinical management of cardiovascular diseases has been advocated10–14 as a cost-effective approach to cardiovascular disease (CVD) management with improved patient outcomes as compared to the treatment of individual risk factors. The Framingham and other similar studies (e.g. PROCAM [Munster],15 Seven Countries Study, SCORE16 and Progetto CUORE17 studies) provide the basis for the equations upon which many of the existing cardiovascular risk-profiling packages11,18–28 have been developed.29 However, such risk profiling protocols lack universal applicability11,13,14,29–42 and may be of limited applicability in developing countries, whose populations were not sampled for the Framingham31,32 and other studies. Uncritical adoption of such protocols may result in negative clinical and economic consequences.43
To address the absence of a CVD risk profiling tool for developing countries, WHO in 2000 developed a package for the assessment and management of cardiovascular risk in low-resource settings.44 The package, developed through consultations with experts from all WHO regions, was designed as an adaptable, cost-effective tool for systematic case management at all health-care levels, and consequently for scaling up countries’ health systems. The expert panel based the design of the package on the graded evidence available.
The package includes three scenarios that reflect commonly encountered resource availability strata in low- and medium-resource settings. While the basic elements remain the same across the three scenarios, the specific thresholds for clinical intervention differ according to the level of personnel and facilities available. Each scenario begins with cardiovascular risk screening using hypertension as an entry point, though each can be adapted for use with diabetes or smoking as entry points. The protocols in each scenario consist of algorithms for patient history (of heart attack, angina, stroke, transient ischaemic attack (TIA), diabetes and patients’ lifestyle); examination (particularly two systolic blood pressure measurements at 5–10 minute intervals); and resultant systematic treatment and follow-up (Fig. 1). Patients are stratified into one of five possible treatment tracks according to their levels of cardiovascular risk. The decisions in each of the treatment tracks include one or more of the following: referral to the next care level; counselling on diet, physical activity and ceasing tobacco use; prescription of low-dose thiazides; and follow-up. High-risk patients are immediately referred to the next level of care, leaving only patients who can be managed appropriately at the primary health-care level. The decision algorithms extend to the second and third follow-up visits, spaced at 1–3, 2–3, or 4–6 month intervals depending on the patients’ risk state.
Fig. 1.
Patient management algorithm in Scenario I: WHO CVD-Risk Management Package
CVD, cardiovascular disease; BMI, body mass index; BP, blood pressure; SBP, systolic blood pressure, TIA, transient ischaemic attack.
a In areas where coronary artery diseases rates exceed stroke rates.
b Thiazide diuretic: Hydrochlorothiazide starting dose 12.5 mg (low-dose) to be increased up to 25 mg (maximum dose).
c Second drug option: use the cheapest out of beta-blockers or calcium-channel blockers or ACE-inhibitors.
If drugs given in footnotes (b) and (c) are not available: use methyldopa or reserpine or fixed dose combination.
Source: WHO CVD-Risk Management Package for low- and medium-resource settings.

Scenario I (Fig. 1) is applicable to the least-resourced section of health systems, which is usually staffed by non-physician health-care workers (NPHWs) in low- and middle-income countries. The algorithms of Scenario I are therefore designed to assist scientifically sound case-by-case decisions by NPHWs. They should guide the NPHW to make evidence-based and cost-effective patient management decisions comparable to those that would be made by skilled physicians. The overall patient management goal is to improve the patient’s absolute cardiovascular risk profile in addition to aiding timely and appropriate referral decisions in high-risk cases.
A necessary precondition for adoption is proof of reliability when applied by non-physicians. We assumed face, construct and content validity for the package, since it was developed through a rigorous WHO-supervised expert consultation process. However, it would be necessary to establish criterion validity (application of the package by the NPHW correlating with a criterion of “true” value). The objective of this study was to ascertain the reliability of applying Scenario I of the package by NPHW when compared to “expert” physicians in typical primary health-care settings (primary health-care centres in Bangalore, India, and Islamabad, Pakistan). As is sometimes the case where the “true values” against which to test such protocols are not clearly established such that a strict standard of expert care is available, correlating raters’ estimates with surrogate endpoints could reasonably approximate a test of accuracy. A second stage to test the effectiveness of the package is under way in 11 countries.
Methods
The study’s sample size was based on an assumption that the NPHW’s application of each component of the Scenario I protocol must agree or correlate up to 80% with those of the physicians when compared. NPHWs applied the algorithm on patients attending sampled clinics; this was followed by an independent application of the same algorithm on the same patient by a physician, thereby matching the observations. There were 111 paired observations from sampled NPHW-staffed primary health-care centres from the Bangalore region of India, and 538 pairs of observations from similar centres in Islamabad, Pakistan. All observations from the NPHWs and the physicians were recorded on standardized visit record forms. Observers were blinded to each other. An investigating physician conducted exit interviews on the patients after they had received treatment. Data were converted to electronic format using the Enter suite of EPI INFO version 6.04b, and analysed with STATA software intercooled version 8.45
The NPHWs and physicians participated jointly in an initial three-day training exercise to acquaint participants with the CVD-Risk Management Package and its mode of application. Participants learned how the package should assist in improving and standardizing patient management in a primary health-care environment. The training materials consisted of a protocol application guide and information materials designed to increase knowledge of CVD risk assessment and management. This training cost US$ 88.30 per participant (30 in all) in Pakistan including transportation, training materials, per diem and trainers’ fee.
Analysis
Our data consisted primarily of dichotomous choices with a few continuous biometric measurements; therefore analysis was two-pronged. The first was a pairwise comparison of each variable of interest in the protocol; this enabled the detection of variables that were problematic for the NPHW to elucidate. To observe the inter-rater agreement in their choices on the six possible decisions points, we employed Kappa statistic (see Box 1), scaled to zero when the amount of agreement is less that what would be expected by chance, and scaled to one when there is perfect agreement. Intermediate values which are possible, are usually (as we have done) interpreted as follows: K < 0, poor; 0.0 < K < 0.20, slight; 0.21 < K < 0.40, fair; 0.41 < K < 0.60, moderate; 0.61 < K < 0.80, substantial; and 0.81 < K < 1.00, almost perfect.46 Correlation analysis was employed to compare agreement in the continuous numeric variables in the data: age, blood pressure, weight, body mass index (BMI) and waist circumference, setting the least acceptable level of agreement to 80%.
Box 1. Description of Kappa statistic.
If r = number of raters (in this case 2), the observed proportion of agreement (Po) is given as
 |
where pij is the fraction of ratings i (by the non-physician health-care worker) and j (by the expert physician), and wij is the weight assigned to the raters. The expected proportion of the agreement (Pe) if the raters agree at random is also given by
 |
Where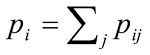 and
and 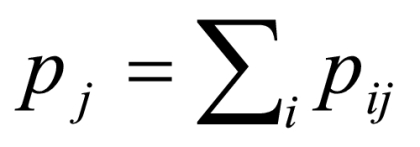
Kappa (K) is given by
 |
The second analysis was multivariate, in which the agreement between raters in applying the treatment decision section of the protocol was tested. This analysis was conducted because it was possible that the NPHWs reliably and accurately elucidated the decision section, but performed less well in the treatment section. There could also be several other possibilities, such as the expert physicians’ (EPs’) and the NPHWs’ estimates erroneously agreeing in some cases, and/or systematic errors in the ratings of both raters. Further, the EPs may have been less than fully accurate, or as easily prone to errors in the protocol application as the NPHWs. It is also possible that NPHWs applied the protocol more precisely and accurately than did the EPs, for instance, if the NPHWs followed the decision and treatment logic of the protocol more thoroughly. To account for possible imprecision and inaccuracy in the gold standard, we compared the decisions taken by the NPHW and the EP with what the decision should have been if both raters had accurately applied the protocol. To this end, a third unbiased rater (the benchmark) was constructed by programming what the treatment decision should be (given the design of the Scenario I treatment protocol) for all observations in the history and examination sections where the EP and the NPHW agreed perfectly. This eliminated the outliers. Similarly to the analysis of matched multirater case control studies,47,48 we estimated the odds of differences in following the correct treatment track of the protocol for each rater when compared with the benchmark. We used multinomial (conditional) logit regression for matched case control groups,47–50 with the raters as the nominal dependent variable, and the choices they made in the treatment track as the independent variables. For each ith rater and j choices, the probability (Prob(Yj = j)) of choice j is modelled as:
 |
where Z represents the attributes of the treatment choices and raters’ characteristics.48,49 Though our data did not contain background information on the raters, we assumed that the administration of the instrument within the same visit period and location mitigates the potential impact of possible maturation (actual and time-related changes in patients’ conditions). In addition, we assumed that the initial training reduced the possible impact of inter-rater differences. The model estimated the propensity for change (β: difference or slope coefficient) in raters’ choices. The purpose was to assess which aspects of the treatment algorithm have valuations between the three raters (NPHW, EP or the benchmark) tended to differ with respect to the benchmark. That is, when all the choices were jointly correlated, if the odds of observing a difference in a particular value are not statistically significant, then all three rater groups largely agreed. A stepwise regression analysis was conducted to eliminate the variables where raters’ agreement was perfect, setting P-values to 0.05. All statistics were implemented using the routines in STATA45 statistical software.
Results
Correlation between rates: age, blood pressure, weight, BMI and waist circumference
We report the results of combined data from the two study sites because there were no significant differences in the results for India and Pakistan when analysed independently. The similarity may be largely due to the simplicity of the algorithms and the initial training. Pooling the data also appeals to the aim of universal application of the package in situations where there are no physicians.
Patients’ ages as elicited by the NPHWs correlated strongly with those of the EPs (correlation coefficient: 0.9146). Similarly, raters’ measurements of blood pressure (correlation coefficient: 0.8836) and body weight (correlation coefficient: 0.8912) correlated beyond the a priori 80% level (Fig. 2, Fig. 3 and Fig. 4). Similar correlations are observable for waist circumference and BMI, except for a few outlying and omitted measurements on the part of both the EPs and the NPHWs (Figs. 5 and 6). In the Pakistan data, there were two BMI outliers of over 150 kg/m² from the EP, and one BMI value of over 80 kg/m² from the NPHW (Fig. 5). In addition, the EP in Pakistan and the NPHW in India each had an outlying value for waist circumference of > 600 cm and > 150 cm, respectively (Fig. 6). These outliers are likely due to computational, recording or data entry errors. There were also missing entries in a few cases. All of these, in addition to the inherent problems with measuring waist circumference in a culturally sensitive environment, will affect the true levels of correlation, particularly for the waist circumference measurements. Overall, correlation coefficients of over 0.80 were obtained by excluding these outliers.
Fig. 2.
Correlations between estimates of NPHWs and EPs for age
EPs, expert physicians; NPHWs, non-physician health-care workers.
Source: WHO Cardiovascular Disease Unit.

Fig. 3.
Correlations between estimates of NPHWs and EPs for blood pressure
EPs, expert physicians; NPHWs, non-physician health-care workers.
Source: WHO Cardiovascular Disease Unit.

Fig. 4.
Correlations between estimates of NPHWs and EPs for body weight
EPs, expert physicians; NPHWs, non-physician health-care workers.
Source: WHO Cardiovascular Disease Unit.

Fig. 5.
Correlations between estimates of NPHWs and EPs for BMI
BMI, body mass index; EPs, expert physicians; NPHWs, non-physician health-care workers; Pak, Pakistan.
Source: WHO Cardiovascular Disease Unit.

Fig. 6.
Correlations between estimates of NPHWs and EPs for waist circumference
EPs, expert physicians; Ind, India; NPHWs, non-physician health-care workers; Pak, Pakistan.
Source: WHO Cardiovascular Disease Unit.

Inter-rater agreement (Kappa statistic)
I. The history and risk mapping section
Over 80% agreement levels were obtained in all the variables in the history section of the protocol (Table 1). Kappa values varied from fair (history of stroke), moderate (history of TIA), substantial (history of heart attack and angina) to perfect agreement (sex of patient and history of diabetes).
Table 1. Level of agreement (Kappa statistic) between EPs and NPHWs on past medical history and health behaviour sections of the WHO CVD-Risk Management Package.
| Variable | Inter-rater agreement, Po (%) | Kappa statistic |
Comments | |||
|---|---|---|---|---|---|---|
| (Po – Pe)/(1 – Pe) Kappa | Prob > z | |||||
| Patient’s cardiovascular history | ||||||
| Sex | 97.75 | 0.9023 | 0.000 | Perfect | ||
| Heart attack | 99.53 | 0.7977 | 0.000 | Substantial | ||
| Angina | 90.22 | 0.6182 | 0.000 | Substantial | ||
| Diabetes | 97.67 | 0.8328 | 0.000 | Perfect | ||
| Transient ischaemic attack | 98.44 | 0.5376 | 0.000 | Moderate | ||
| Stroke | 99.38 | 0.3306 | 0.000 | Fair | ||
| Health/risk behaviour | ||||||
| Tobacco | 89.88 | 0.7480 | 0.000 | Substantial | ||
| Physical activity | 78.90 | 0.5744 | 0.000 | Moderate | ||
| Eating less salt | 83.13 | 0.6624 | 0.000 | Substantial | ||
| Fruits | 92.50 | 0.3287 | 0.000 | Fair | ||
| Fish | 97.97 | 0.2294 | 0.000 | Fair | ||
| Fatty foods | 74.14 | 0.4560 | 0.000 | Moderate | ||
| Alcohol | 93.69 | 0.7733 | 0.000 | Substantial | ||
CVD, cardiovascular disease; EPs, expert physicians; NPHWs, non-physician health-care workers.
II. The health behaviour section (Table 1)
Although elucidating lifestyle history could be characterized as imprecise, inter-rater agreement of over 80% between the EP and the NPHW was obtained for all the questions except that of physical activity (78.90% inter-rater agreement) though a moderate degree of agreement above chance was achieved. Overall, the degree to which the agreement levels were not due to chance varied from fair to substantial.
III. The “treatment tracks” section of the algorithm (Table 2)
Table 2. Level of agreement (Kappa statistic) between EPs and NPHWs on counselling, drug treatment and referral sections of the WHO CVD-Risk Management Package.
| Variable | Inter-rater agreement, Po (%) | Kappa statistic |
Comments | ||
|---|---|---|---|---|---|
| (Po – Pe)/(1 – Pe) Kappa | Prob > z | ||||
| Track A | 96.14 | 0.7537 | 0.000 | Substantial | |
| Counselling | 96.30 | 0.6560 | 0.000 | Substantial | |
| Prescription | 95.99 | 0.4796 | 0.000 | Moderate | |
| Referral | 96.14 | 0.6984 | 0.000 | Substantial | |
| Track B | 99.54 | 0.9067 | 0.000 | Perfect | |
| Counselling | 96.14 | 0.7215 | 0.000 | Substantial | |
| Prescription | 97.22 | 0.7484 | 0.000 | Substantial | |
| Referral | 96.30 | 0.5940 | 0.000 | Moderate | |
| Track C | 94.91 | 0.7470 | 0.000 | Substantial | |
| Counselling | 94.19 | 0.7470 | 0.000 | Substantial | |
| Prescription | 95.83 | 0.7152 | 0.000 | Substantial | |
| Referral | 92.44 | 0.4877 | 0.000 | Moderate | |
| Track D | 93.21 | 0.7861 | 0.000 | Substantial | |
| Counselling | 92.90 | 0.7736 | 0.000 | Substantial | |
| Prescription | 95.37 | 0.6976 | 0.000 | Substantial | |
| Referral | 94.44 | 0.4300 | 0.000 | Moderate | |
| Track E | 96.60 | 0.6680 | 0.000 | Substantial | |
| Counselling | 96.60 | 0.6680 | 0.000 | Substantial | |
| Prescription | 97.07 | 0.5215 | 0.000 | Moderate | |
| Referral | 96.91 | 0.5317 | 0.000 | Moderate | |
| Track F | 94.60 | 0.8914 | 0.000 | Perfect | |
| Counselling | 94.14 | 0.8820 | 0.000 | Perfect | |
| Prescription | 87.65 | 0.7145 | 0.000 | Substantial | |
| Referral | 98.61 | 0.8452 | 0.000 | Perfect | |
CVD, cardiovascular disease; EPs, expert physicians; NPHWs, non-physician health-care workers.
Not surprisingly, given the high agreement in the history and examination sections, the inter-rater agreement achieved for treatment decisions taken ranged from 88% (prescription in track F) to 99.5% (referral in track F). Compared to other sections of the protocol, inter-rater agreements were highest for the treatments tracks. Raters’ agreement ranged from 93% to 99.5% for the six treatment tracks (A–F). Of the three treatment choices, agreements on prescription were the highest in each of the treatment tracks except track F, where according to the protocol there should have been no prescription but only referral to a higher level of care. Kappa levels range from moderate to perfect agreement, indicating that the levels of agreement were far beyond those that are possible by chance.
Multivariate analysis result
The results indicate an overall agreement in almost all of the treatment decision tracks, with the exception of counselling decisions in tracks D and C, and referral decisions in tracks A and E (see Table 3). These differences suggest that both the EPs and the NPHWs, when compared to the independent benchmark, may have rendered more counselling and less referral than was necessary. This observation may be related to some omitted values as noted previously, or to the influence of local practice.
Table 3. Result of matched (stepwise) logistic regressiona.
| Variable | Odds ratio | Standard error |
|---|---|---|
| Counselling in track C | 2.469 | 1.032 |
| Counselling in track D | 66.770 | 48.339 |
| Referral in track A | 0.042 | 0.015 |
| Referral in track E | 0.075 | 0.031 |
| Log likelihood | –238.13 | |
| Log likelihood ratio chi2 | 422.07 | |
| Prob > chi2 | 0 | |
| Pseudo R2 | 0.4698 |
a Expert physicians and non-physician health-care workers compared with independent benchmark.
Discussion
With respect to the primary objective of this study, results indicate that NPHWs employed Scenario I of the WHO CVD-Risk Management Package comparably to physicians, who are arguably better skilled. Over 80% agreement was achieved for almost all of the items in the protocol and Kappa statistics indicate that the agreements were largely not due to chance.
A view often held is that stepping up specialist training and investing in diagnostic technologies are a panacea for the increasing burden of cardiovascular diseases, even in low- to middle-income countries. However, in these settings such strategies may be neither affordable nor cost-effective. An alternative viewpoint is that currently available resources and skills could be readapted to respond sufficiently and efficiently to the changing health needs in many of these countries. The results of this exercise indicate that NPHWs could be retrained and assisted to be more effective in assuming primary roles in the care of patients with chronic noncommunicable diseases, especially where there are no physicians. This could be an initial step in incorporating the management of chronic diseases into the health-care setting in developing countries, which has traditionally focused mainly on the management of acute communicable diseases.
Though engaging low-skilled workers in the management of chronic disease risk may raise some ethical concerns, the reality in many countries is that NPWHs may have the only health-care skills available to a large proportion of the population. It could be that NPHWs are already compelled to care for cardiovascular diseases, though they may not be trained to recognize them or make robust, timely and life-saving treatment decisions. This is due, in part, to the “brain drain” of skilled health-care workers, which has compounded skill shortages and impacted negatively on health care.5–9 Although brain drain has recently attracted international attention and concern from policy-makers, there are yet to be clear solutions to mitigate its impact on health care. It is therefore reasonable that available skills be re-adapted to the challenges on the ground. This package could aid such adaptation aimed at scaling up the health system response to chronic diseases. The package incorporates the principle of triage in its design, does not allow the NPHW to treat high-risk cases, and allows only the prescription of low-dose thiazide, mitigating ethical concerns.
The results of this study have implications for the country-level policy response to the increasing burden of cardiovascular disease in low-resource settings. For instance, one of the main problems encountered in these settings is that, for reasons that include cost and busy schedules, opportunities for health workers to attend lengthy retraining programmes are limited. In this protocol test, the NPHW only underwent three days of training to achieve the observed high level of agreement with the EP in the application of the risk management protocol. Health-care managers may find such three-day training acceptable to enable systematic, phased programming of regional or even countrywide retraining programmes. In general, readapting available health human resources to address the emerging chronic disease problem could result in health-care cost savings (apart from the motivational value for the workforce of retraining). Increased management of patients with cardiovascular risk in primary health-care settings could avoid more costly trips to higher care levels. Further, the use of NPHWs in managing CVD patients will free physicians to focus on high-risk cases, thereby resulting in increased efficiency of primary health-care resources. Low-resource countries could avoid unaffordable health-care costs and capital flight that would be incurred by investing in capital-intensive care and unaffordable medical equipment.
Conclusion
From this study, we conclude that NPHWs can easily be retrained to make reasonably safe and appropriate treatment decisions with the aid of the WHO CVD-Risk Management Package within the scope of their available skills. Work is under way to test the impact of the package on population cardiovascular well-being in several countries. ■
Footnotes
Competing interests: None declared.
References
- 1.Preventing chronic diseases: a vital investment. Geneva, WHO, 2005.
- 2.Liu T. The Lancet’s chronic diseases series. Lancet. 2006;367:565–6. doi: 10.1016/S0140-6736(06)68216-0. [DOI] [PubMed] [Google Scholar]
- 3.Strong K, et al. Preventing chronic diseases: how many lives can we save? Lancet. 2005;366:1578–82. doi: 10.1016/S0140-6736(05)67341-2. [DOI] [PubMed] [Google Scholar]
- 4.Mendis S, et al. Barriers to management of cardiovascular risk in a low-resource setting using hypertension as an entry point. J Hypertens. 2004;22:59–64. doi: 10.1097/00004872-200401000-00013. [DOI] [PubMed] [Google Scholar]
- 5.Oberoi SS, Lin V. Brain drain of doctors from southern Africa: brain gain for Australia. Aust Health Rev. 2006;30:25–33. [PubMed] [Google Scholar]
- 6.Muula AS. Is there any solution to the “brain drain” of health professionals and knowledge from Africa? Croat Med J. 2005;46:21–9. [PubMed] [Google Scholar]
- 7.Martineau T, et al. “Brain drain” of health professionals: from rhetoric to responsible action. Health Policy. 2004;70:1–10. doi: 10.1016/j.healthpol.2004.01.006. [DOI] [PubMed] [Google Scholar]
- 8.Scott ML, et al. “Brain drain” or ethical recruitment? Med J Aust. 2004;180:174–6. doi: 10.5694/j.1326-5377.2004.tb05862.x. [DOI] [PubMed] [Google Scholar]
- 9.Marchal B, Kegels G. Health workforce imbalances in times of globalization: brain drain or professional mobility? Int J Health Plann Manage. 2003;18:S89–101. doi: 10.1002/hpm.720. [DOI] [PubMed] [Google Scholar]
- 10.Whitworth JA. 2003 World Health Organization (WHO)/International Society of Hypertension (ISH) statement on management of hypertension. J Hypertens. 2003;21:1983–92. doi: 10.1097/00004872-200311000-00002. [DOI] [PubMed] [Google Scholar]
- 11.Menotti A, et al. The estimate of cardiovascular risk. Theory, tools and problems. Ann Ital Med Int. 2002;17:81–94. [PubMed] [Google Scholar]
- 12.2003 European Society of Hypertension-European Society of Cardiology guidelines for the management of arterial hypertension. J Hypertens. 2003;21:1011–53. doi: 10.1097/00004872-200306000-00001. [DOI] [PubMed] [Google Scholar]
- 13.Lenz M, Muhlhauser I. Med Klin (Munich) 2004;99:651–61. doi: 10.1007/s00063-004-1097-3. [Cardiovascular risk assessment for informed decision making. Validity of prediction tools] [DOI] [PubMed] [Google Scholar]
- 14.Neuhauser HK, et al. A comparison of Framingham and SCORE-based cardiovascular risk estimates in participants of the German National Health Interview and Examination Survey 1998. Eur J Cardiovasc Prev Rehabil. 2005;12:442–50. doi: 10.1097/01.hjr.0000183909.52118.9f. [DOI] [PubMed] [Google Scholar]
- 15.Assmann G, et al. Simple scoring scheme for calculating the risk of acute coronary events based on the 10-year follow-up of the prospective cardiovascular Munster (PROCAM) study. Circulation. 2002;105:310–5. doi: 10.1161/hc0302.102575. [DOI] [PubMed] [Google Scholar]
- 16.Conroy RM, et al. Estimation of ten-year risk of fatal cardiovascular disease in Europe: the SCORE project. Eur Heart J. 2003;24:987–1003. doi: 10.1016/S0195-668X(03)00114-3. [DOI] [PubMed] [Google Scholar]
- 17.Ferrario M, et al. Prediction of coronary events in a low incidence population. Assessing accuracy of the CUORE Cohort Study prediction equation. Int J Epidemiol. 2005;34:413–21. doi: 10.1093/ije/dyh405. [DOI] [PubMed] [Google Scholar]
- 18.May M, et al. Cardiovascular disease risk assessment in older women - can we improve on Framingham?: British Women’s Heart and Health prospective cohort study. Heart 2006. [DOI] [PMC free article] [PubMed] [Google Scholar]
- 19.Yip YB, et al. Cardiovascular disease: application of a composite risk index from the Telehealth System in a district community. Public Health Nurs. 2004;21:524–32. doi: 10.1111/j.0737-1209.2004.21604.x. [DOI] [PubMed] [Google Scholar]
- 20.Milne R, et al. Discriminative ability of a risk-prediction tool derived from the Framingham Heart Study compared with single risk factors. N Z Med J. 2003;116:U663. [PubMed] [Google Scholar]
- 21.Marchioli R, et al. Assessment of absolute risk of death after myocardial infarction by use of multiple-risk-factor assessment equations: GISSI-Prevenzione mortality risk chart. Eur Heart J. 2001;22:2085–103. doi: 10.1053/euhj.2000.2544. [DOI] [PubMed] [Google Scholar]
- 22.Menotti A, et al. Riskard 2005. New tools for prediction of cardiovascular disease risk derived from Italian population studies. Nutr Metab Cardiovasc Dis. 2005;15:426–40. doi: 10.1016/j.numecd.2005.07.007. [DOI] [PubMed] [Google Scholar]
- 23.Stephens JW, et al. Cardiovascular risk and diabetes. Are the methods of risk prediction satisfactory? Eur J Cardiovasc Prev Rehabil. 2004;11:521–8. doi: 10.1097/00149831-200412000-00013. [DOI] [PubMed] [Google Scholar]
- 24.Menotti A, et al. An Italian chart for cardiovascular risk prediction. Its scientific basis. Ann Ital Med Int. 2001;16:240–51. [PubMed] [Google Scholar]
- 25.Mehta RH, et al. Elderly patients at highest risk with acute myocardial infarction are more frequently transferred from community hospitals to tertiary centers: reality or myth? Am Heart J. 1999;138:688–95. doi: 10.1016/S0002-8703(99)70184-5. [DOI] [PubMed] [Google Scholar]
- 26.Krumholz HM, et al. Validation of a clinical prediction rule for left ventricular ejection fraction after myocardial infarction in patients > or = 65 years old. Am J Cardiol. 1997;80:11–5. doi: 10.1016/S0002-9149(97)00299-3. [DOI] [PubMed] [Google Scholar]
- 27.Haq IU, et al. Prediction of coronary risk for primary prevention of coronary heart disease: a comparison of methods. QJM. 1999;92:379–85. doi: 10.1093/qjmed/92.7.379. [DOI] [PubMed] [Google Scholar]
- 28.Rabindranath KS, et al. Comparative evaluation of the new Sheffield table and the modified joint British societies coronary risk prediction chart against a laboratory based risk score calculation. Postgrad Med J. 2002;78:269–72. doi: 10.1136/pmj.78.919.269. [DOI] [PMC free article] [PubMed] [Google Scholar]
- 29.Jurgensen JS. The value of risk scoring. Heart 2006. [Google Scholar]
- 30.Liu J, et al. Predictive value for the Chinese population of the Framingham CHD risk assessment tool compared with the Chinese Multi-Provincial Cohort Study. JAMA. 2004;291:2591–9. doi: 10.1001/jama.291.21.2591. [DOI] [PubMed] [Google Scholar]
- 31.Brindle PM, et al. The accuracy and impact of risk assessment in the primary prevention of cardiovascular disease: A systematic review. Heart (2006). [DOI] [PMC free article] [PubMed] [Google Scholar]
- 32.Stork S, et al. Prediction of mortality risk in the elderly. Am J Med. 2006;119:519–25. doi: 10.1016/j.amjmed.2005.10.062. [DOI] [PubMed] [Google Scholar]
- 33.Bhopal R, et al. Predicted and observed cardiovascular disease in South Asians: application of FINRISK, Framingham and SCORE models to Newcastle Heart Project data. J Public Health (Oxf) 2005;27:93–100. doi: 10.1093/pubmed/fdh202. [DOI] [PubMed] [Google Scholar]
- 34.Hense HW, et al. Framingham risk function overestimates risk of coronary heart disease in men and women from Germany — results from the MONICA Augsburg and the PROCAM cohorts. Eur Heart J. 2003;24:937–45. doi: 10.1016/S0195-668X(03)00081-2. [DOI] [PubMed] [Google Scholar]
- 35.Liao Y, et al. How generalizable are coronary risk prediction models? Comparison of Framingham and two national cohorts. Am Heart J. 1999;137:837–45. doi: 10.1016/S0002-8703(99)70407-2. [DOI] [PubMed] [Google Scholar]
- 36.Bastuji-Garin S, et al. The Framingham prediction rule is not valid in a European population of treated hypertensive patients. J Hypertens. 2002;20:1973–80. doi: 10.1097/00004872-200210000-00016. [DOI] [PubMed] [Google Scholar]
- 37.Marrugat J, et al. An adaptation of the Framingham coronary heart disease risk function to European Mediterranean areas. J Epidemiol Community Health. 2003;57:634–8. doi: 10.1136/jech.57.8.634. [DOI] [PMC free article] [PubMed] [Google Scholar]
- 38.D’Agostino RB, Sr, et al. Validation of the Framingham coronary heart disease prediction scores: results of a multiple ethnic groups investigation. JAMA. 2001;286:180–7. doi: 10.1001/jama.286.2.180. [DOI] [PubMed] [Google Scholar]
- 39.Brindle PM, et al. The accuracy of the Framingham risk-score in different socioeconomic groups: a prospective study. Br J Gen Pract. 2005;55:838–45. [PMC free article] [PubMed] [Google Scholar]
- 40.Brindle P, et al. Predictive accuracy of the Framingham coronary risk score in British men: prospective cohort study. BMJ. 2003;327:1267. doi: 10.1136/bmj.327.7426.1267. [DOI] [PMC free article] [PubMed] [Google Scholar]
- 41.Empana JP, et al. Are the Framingham and PROCAM coronary heart disease risk functions applicable to different European populations? The PRIME Study. Eur Heart J. 2003;24:1903–11. doi: 10.1016/j.ehj.2003.09.002. [DOI] [PubMed] [Google Scholar]
- 42.Menotti A, et al. Comparison of the Framingham risk function-based coronary chart with risk function from an Italian population study. Eur Heart J. 2000;21:365–70. doi: 10.1053/euhj.1999.1864. [DOI] [PubMed] [Google Scholar]
- 43.Fornasini M, et al. Consequences of using different methods to assess cardiovascular risk in primary care. Fam Pract. 2006;23:28–33. doi: 10.1093/fampra/cmi092. [DOI] [PubMed] [Google Scholar]
- 44.WHO CVD-Risk Management Package for low- and medium-resource settings. Geneva: WHO; 2002. [DOI] [PMC free article] [PubMed]
- 45.Stata Statistical Software. Release 8.0. College Station: Stata Corp.; 2003. [Google Scholar]
- 46.Lindis JR, Kock GG. The measurement of observer agreement for categorical data. Biometrics. 1977;33:159–74. doi: 10.2307/2529310. [DOI] [PubMed] [Google Scholar]
- 47.Cook RJ, Farewell VT. Conditional inference for subject-specific and marginal agreement: two families of agreement measures. Can J Stat. 1995;23:333–44. doi: 10.2307/3315378. [DOI] [Google Scholar]
- 48.Hosmer DW, Lemeshow S. Applied Logistic Regression. John Wiley & Sons, 1989. [Google Scholar]
- 49.Greene W. Econometric Analysis. New Jersey, Prentice Hall, 2003. [Google Scholar]
- 50.Bishop YMM, et al. Discrete multivariate analysis: theory and practice. Cambridge, MIT Press, 1975. [Google Scholar]