

Abstract
We studied single molecular interactions between surface-attached rat CD2, a T-lymphocyte adhesion receptor, and CD48, a CD2 ligand found on antigen-presenting cells. Spherical particles were coated with decreasing densities of CD48–CD4 chimeric molecules then driven along CD2-derivatized glass surfaces under a low hydrodynamic shear rate. Particles exhibited multiple arrests of varying duration. By analyzing the dependence of arrest frequency and duration on the surface density of CD48 sites, it was concluded that (i) arrests were generated by single molecular bonds and (ii) the initial bond dissociation rate was about 7.8 s−1. The force exerted on bonds was increased from about 11 to 22 pN; the detachment rate exhibited a twofold increase. These results agree with and extend studies on the CD2–CD48 interaction by surface plasmon resonance technology, which yielded an affinity constant of ≈104 M−1 and a dissociation rate of ≥6 s−1. It is concluded that the flow chamber technology can be an useful complement to atomic force microscopy for studying interactions between isolated biomolecules, with a resolution of about 20 ms and sensitivity of a few piconewtons. Further, this technology might be extended to actual cells.
Keywords: flow chamber, dissociation rate
The outcome of cell interactions is highly dependent on the rate of bond formation and dissociation between membrane adhesion molecules. This has led several authors to study the lifetime of single associations between surface-bound biomolecules. The basic approach has been to make cells or model surfaces adhere through a few or even isolated molecular bonds by means of high receptor dilution (1–6) and/or very short contact time (7–9). Bond rupture is monitored by subjecting adherent particles to a small distractive force ranging between 1 and about 20 pN. This was low enough to affect bond lifetime only minimally but high enough to impart a substantial velocity on bound particles, a velocity that is necessary to enable rapid detection of detachment events.
Using such methods, it was possible to demonstrate that the lifetime of interactions between endothelial cell selectins and their ligands on leukocytes was of the order of 1 s (5, 8), and it was suggested that a single molecular bond efficiently resisted the hydrodynamic drag experienced by leukocytes in flowing blood (5). This might account for the peculiar leukocyte capacity to roll along inflamed blood vessels with a velocity of several micrometers per second in presence of a wall shear rate of several hundreds per second (10, 11). When the same approach was applied to other biological systems, it was found that the formation of high affinity antigen–antibody interactions might involve the occurrence of intermediate binding steps lasting about 1 s (4, 7) and that lymphoid cells interacting with immunoglobulin-coated surfaces displayed transient adhesions of similar lifetime (9). It was therefore of obvious interest to determine whether still shorter interactions might be detected between cell adhesion receptors, leading to the hypothesis that bond formation between many biomolecules might involve the appearance of numerous intermediate binding steps spanning a wide spectrum of lifetime durations, with possible functional significance.
The interaction of the T-lymphocyte adhesion molecule CD2 with its ligand CD48 on antigen-presenting cells enhances antigen recognition by the T-cell antigen receptor, possibly by enhancing the physical interaction between the T-cell receptor and the peptide antigen bound to major histocompatibility complex molecules (12). Recent data indicate that antigen recognition by the T-cell receptor is highly dynamic, suggesting that it will depend critically on the kinetics of receptor–ligand interactions (13–15). The CD2–CD48 interaction is among the best-characterized cell-adhesion systems, interacting in solution with a very low affinity (≈10−4 M−1) and a dissociation rate constant of at least 6 s−1. A model outlining the relationship between the binding kinetics of surface-attached molecules and soluble molecules was proposed in 1978 by Bell (16), but it has not been possible to verify this model experimentally. In this report, we describe an improved methodology that allows a quantitative kinetic study of the interaction between surface bound forms of CD2 and CD48.
METHODS
Molecules and Surfaces.
Streptavidin-coated spheres of 2.8 μm diameter (Dynabeads M280, Dynal France, Compiègne) were coated with a soluble chimera including two extracellular immunoglobulin-like domains of rat CD48 linked to two immunoglobulin domains (domains 3 and 4) of rat CD4 (17) by means of the biotinylated anti-rat CD4 murine monoclonal antibody OX68 (18), yielding a surface density of about 3,460 antibody binding sites per square micrometer (7). Site dilution was performed by diluting anti-CD4 antibodies with an irrelevant biotinylated anti-HLA-DR (Immunotech, Marseille, France). Glass surfaces were coated with recombinant soluble rat CD2 (residues 1–177; ref. 19) as previously described (7) by sequential treatment with polylysine, glutaraldehyde, 40 μg/ml soluble CD2 in phosphate buffer (pH 7.2), and glycine. The surface density of CD2 reactive sites was measured with confocal laser microscopy (9) after labeling with excess anti-CD2 monoclonal antibody (OX34; ref. 20) and fluorescent anti-mouse kappa chain antibodies (clone H139.52.1, supplied by Immunotech). Treated surfaces displayed about 400 sites per square micrometer.
Flow Chamber.
Our apparatus has been previously described (7, 8). A rectangular cavity of 6 × 17 × 0.16 mm3 was formed with a drilled plexiglas block and CD2-coated glass coverslips that were stuck with silicon glue. The flow was generated by a 1-ml syringe mounted on an electric syringe pump (Razel, Stamford, CT, supplied by Bioblock, Illkirch, France). The chamber was set on the stage of an inverted microscope (IM, Olympus, New Hyde Park, NY) and monitored with a ×100 oil objective (n.a. 1.25). The microscope was equipped with a high sensitivity silicium intensified target camera (Model 4015, Lhesa, Cergy Pontoise, France), and all experiments were recorded on a videotape recorder for delayed analysis. In a typical experiment, 2 ml of bead suspension (3 × 10⁶/ml) was driven through the chamber with a wall shear rate ranging between about 11 and 44 s−1. The suspending medium was phosphate buffer (pH 7.2) supplemented with 1 mg/ml bovine albumin (Sigma).
Determination of Particle Trajectories.
We used an improved methodology that was validated in recent reports (21, 22). The video signal was subjected to real-time digitization with a PCVision+ card (Imaging Technology, Bedford, MA, supplied by Imasys, Suresnes, France) mounted on a personal computer (80486 Intel microprocessor, 25 MHz frequency). The pixel size was 0.17 μm along the direction of particle motion. The odd and even frame of each video image were analyzed separately, yielding a time resolution of 0.02 s. A custom-made assembly language software was devised to determine the particle position in each frame by determining the sphere boundary and calculating its area and the coordinates of the center of gravity. This procedure allowed about 0.02 μm accuracy in position determination (22). Continuous recording of particle area allowed easy detection of artifactual events such as collision between a moving and a bound sphere. High rapidity was achieved by transferring to the host computer memory only a small (32 × 32 pixel) image surrounding the particle. All trajectories were recorded on the computer hard disk for delayed analysis. The analysis performed in this report was based on the monitoring of 3791 particles, yielding 507,776 positions. For a typical trajectory, see Fig. 1.
Figure 1.
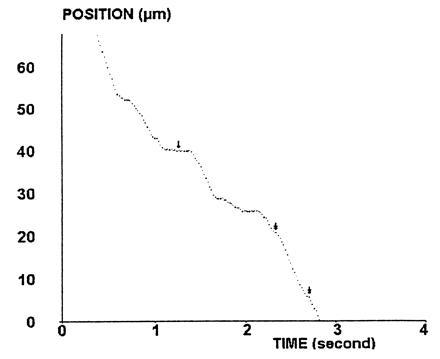
Typical trajectory. The position of a CD48-coated bead driven along a CD2-derivatized surface by a wall shear rate of 22 s−1 is shown. Periods of regular motion with constant velocity (of order of 20 μm/s) are interspersed by arrests of variable duration ranging from a few tens of milliseconds (double arrows) to several hundreds of milliseconds (simple arrow) or more (not shown).
Data Analysis.
Because of the high number of recorded positions, it was necessary to develop a dedicated software for data processing. The choice of a threshold for arrest detection was obtained after several trials and errors, because this choice depended on the regularity of particle motion and the maximum amplitude of the error created in determining the position of a given particle. With a standard wall shear rate of 22 s−1, it was convenient to define as arrested a particle moving by less than 0.34 μm (i.e., two pixel units) during an interval of 60 ms. An arrested particle was defined as departing when it moved by more than 0.68 μm during a similar interval of 60 ms (this was required to exclude artifactual splitting of long-term arrests due to isolated fluctuations of position). In any case, all detected arrests were checked by visual examination of the trajectory.
The binding probability (expressed in s−1) was calculated in a given experiment as the ratio between the number of detected arrests and the duration of particle monitoring (8). It was repeatedly found that a particle resuming its motion after a stop had higher probability to display another binding event than particles having exhibited no arrest, probably because of a decreased particle-to-surface distance immediately after departure. Therefore, the binding probability was calculated by considering only first arrests of individual particles and by defining as monitoring duration only the period of time preceding the first arrest. A criterion for deciding that our methodology allowed the detection of arrests mediated by single molecular bonds would be that the binding probability be proportional to the first power of the surface density of binding sites on beads or surface (4, 5, 7, 23).
The lifetime of interactions under given experimental conditions was determined by ordering the durations of measured arrests (8) and plotting the percent of cells remaining bound at time t after an arrest versus t (4) with a semilogarithmic scale. If arrests were mediated by single bonds, the detachment curves (see Fig. 2) were expected to be straight lines, with a slope equal to the bond dissociation rate k−. However, as previously discussed (4), if bond formation could occur (with association rate k+) after a first binding event, dissociation curves might also appear as straight lines if the sampling frequency of position determinations was less than k+. However, the initial slope of detachment curves would depend on binding site concentration. A simple model was used to derive k+ from the dependence of initial detachment rate of binding site density, assuming that the number of particle-to-surface bonds was equal to or less than two, and dissociation rate was similar when particles were bound by one or two bonds (which seems correct due to the absence of lateral mobility of bound molecules). Defining as P1(t) and P2(t) the probability that a particle bound at time 0 by a single bond remained bound at time t by one or two bonds, respectively, we may write
 |
1 |
 |
2 |
The standard procedure is to look for a combination V of P1 and P2 such that
 |
3 |
 |
4 |
After simple algebraic manipulations, we obtain two solutions for α and λ, namely
 |
5 |
 |
6 |
where r is k+/k−. Eqs. 3 and 4 are readily solved, and the probability Pb(t) that a cell is bound at time t when there is exactly one bond at time 0 is
 |
 |
7 |
where
 |
8 |
Figure 2.
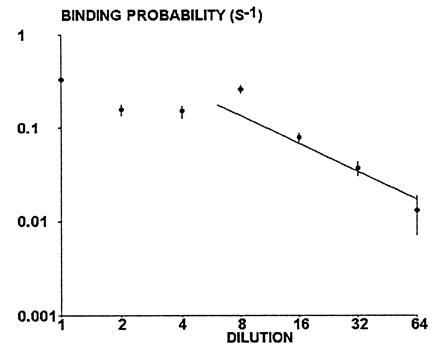
Dependence of binding probability on binding site density. Beads were coated with various densities of CD48 sites and driven along CD2-derivatized surfaces with a wall shear rate of 22 s−1. The binding probability was calculated as the mean number of detectable arrests per second of observation. Each point represents between 32 and 115 arrests, determined on hundreds of beads for each concentration. Each vertical bar represents twice the theoretical standard error calculated as explained. The straight line is a regression line determined on the five highest dilutions. The slope is 0.989 and the correlation coefficient is 0.919.
Statistical Tests.
The deviation from linearity of
experimental curves was quantified with a method based on variance
analysis (24). The principle was to determine the significance of
improvement obtained by approximating the curve with a second order
polynoma as compared with linear regression. The significance of
correlation between dissociation rate and binding site density was
studied by calculating nonparametric rank correlation. The accuracy of
binding probability determination was estimated by ascribing to the
number N of detected arrests a standard error of
 (24) after pooling all data corresponding to a
given experimental condition.
(24) after pooling all data corresponding to a
given experimental condition.
RESULTS
Detection of Specific Molecular Interactions.
When CD48-coated spheres were driven along CD2-derivatized surfaces, their motion consisted of linear displacements with fairly constant velocity separated by apparent arrests with a duration ranging between several tens of milliseconds (Fig. 1, double arrows) and several tens of seconds or more. It was important to demonstrate that these arrests were actually due to CD4–CD48 interactions. In a first series of experiments (not shown), the binding probability was drastically reduced when beads were treated with anti-CD4 alone (without CD4–CD48 chimera) or irrelevant anti-HLADR and CD4–CD48. Second, it was found that the binding probability experienced a more than fourfold decrease when glass coverslips were treated with the anti-CD2 antibody OX34, which blocks CD48 binding (18). Finally, the dependence of binding probability on bead site density was studied. As shown on Fig. 2, when anti-CD4 were diluted between 1/8 and 1/64, the binding probability displayed fairly linear decrease with respect to antibody concentration, since the slope of the regression line was 0.9889 on a double logarithmic plot. This suggested that our apparatus could detect arrests initiated by single molecular binding events.
The Initial Detachment Rate of Bound Particles Exhibits Pseudo-First Order Kinetics.
First, experiments were conducted with a wall shear rate of 22 s−1 with different dilutions of anti-CD4 antibodies on beads. The durations of individual arrests had to be determined. A particle was defined as arrested at some time when it moved by less than two pixel units (i.e., 0.34 μm) during the following N steps of 0.02 s each. Several tentative values of N were tried. Indeed, if the value of N was too high, very transient events might have been missed, thus increasing the mean arrest duration. Conversely, if the value of N was too low, a lumping of two sequential arrests separated by a very short displacement may have resulted, also increasing the mean arrest duration. As exemplified in Fig. 3, the distribution of arrest durations did not strongly depend on the definition of arrests when N comprised between 3 and 6 for a wall shear rate of 22 s−1, although it might be difficult to determine the precise boundaries of arrest periods on individual curves. Therefore, the threshold value of 3 was chosen for all experiments made at a wall shear rate of 22 s−1 or 44 s−1. When the wall shear rate was 11 s−1, a higher value of 6 often yielded more satisfactory definition of particle arrests.
Figure 3.
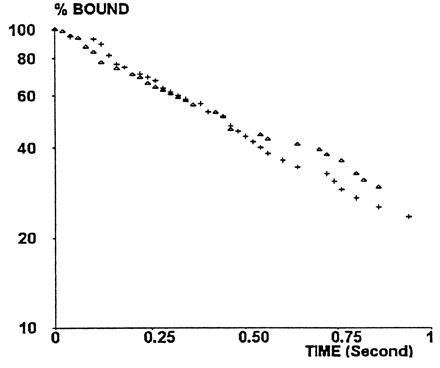
Dependence of the detachment rate on the criteria used for defining arrests. In a representative experiment (with a wall shear rate of 22 s−1), particles were defined as arrested if they moved by less than 0.34 μm during an interval of 60 ms (▵) or 120 ms (+). Distributions of arrest durations were fairly similar.
Detachment curves were determined for six sequential twofold dilutions of anti-CD4 (from 1/1 to 1/32), using a wall shear rate of 22 s−1. Two representative detachment curves (1/1 and 1/8 dilution) are shown in Fig. 4. A general finding was that curves drawn on a semilogarithmic plot were fairly linear during the period of 0.25 s following initial arrest. Indeed, deviation from linearity was significant at the 0.05 level for only two studied dilutions out of six (1/1 and 1/32), and the correlation coefficient between time and log (percent bound particles) ranged between 0.967 and 0.994. Further, the initial detachment rate depended on dilution, as shown in Fig. 5 (this dependence was significant at the 0.05 level, as determined with nonparametric rank test). The simplest interpretation of this finding was that the occurrence of a first molecular bond initiating bead arrest might be followed by the formation of additional bonds with a frequency comparable to or higher than the sampling rate of 50 positions per second (4). The simplest model for this possibility was to assume a on-rate of bond formation k+/d, where d is the antibody dilution, leading to Eqs. 1 and 2 as described above. The aforementioned model was used to fit the initial detachment rate to experimental data. The fitted curve is shown in Fig. 5. The estimated on- and off-rates of bond formation were k− = 7.8 s−1 and k+ = 39.6 s−1, respectively.
Figure 4.
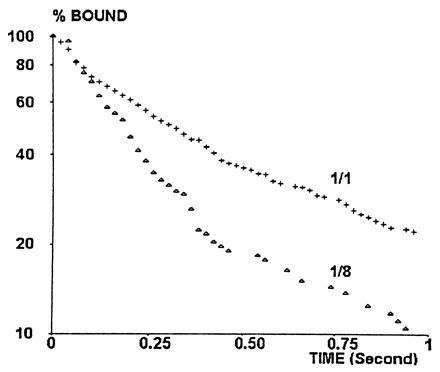
Typical detachment curves. The percent of particles remaining bound at time t after an arrest at time zero was plotted versus t on a semilogarithmic scale. The wall shear rate was 22 s−1. Site dilution was 1/1 (+, 115 arrests) or 1/8 (▵, 94 arrests). Typically, lines were fairly linear during the first 0.25 s, a significant curvature occurred between 0.25 and 0.5 s, and fairly linear aspect was again found during the next 0.5 s.
Figure 5.
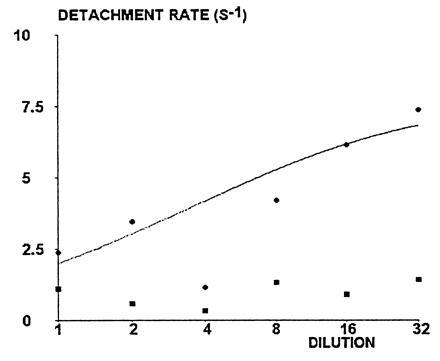
Effect of site dilution on detachment rate. Wall shear rate was 22 s−1. Circles represent the initial detachment rate. The solid line represents a theoretical plot of detachment rate versus dilution. The theoretical detachment rate was defined as the first decay constant of binding probability [i.e., as shown in Eq. 7, (r + 3 - δ)k−/2]; this was calculated assuming that k− was independent of dilution, whereas k+ was inversely proportional to the dilution factor. Fitted values of unknown parameters were k+ = 39.6 s−1 and k− = 7.8 s−1. Squares represent the mean detachment rate between 0.5 and 1 s after arrest.
A Distractive Force of About 22 pN Can Result in Increase of About Twofold in the Initial Detachment Rate.
It was found of interest to determine the dependence of the detachment rate on hydrodynamic force. When beads treated with undiluted anti-CD4 and sCD4–CD48 were exposed to wall shear rates of 11, 22, and 44 s−1, the initial detachment rates were 2.68, 2.37, and 5.27 s−1, respectively (Fig. 6). The force exerted on a single molecular bond about 20 nm long formed between an arrested bead and the surface was previously estimated at about 0.51 × 10⁻¹² × G, where G is the wall shear rate (7). It is therefore concluded that the initial bead detachment rate was approximately doubled when the applied force was raised to about 22 pN. Note that the force experienced per bond is inversely proportional to the square root of the length of binding structure (7); therefore, the calculated force is not strongly dependent on the precise value of estimated length.
Figure 6.
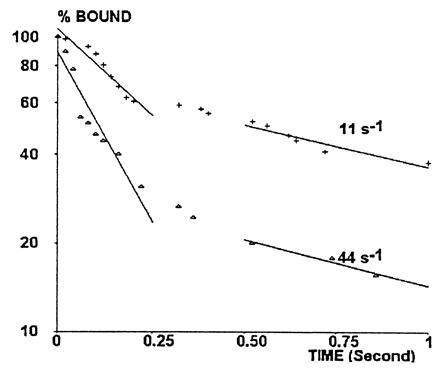
Effect of wall shear rate on detachment rate. Bead motion was followed with a wall shear rate of 11 s−1 (+) or 44 s−1 (▵) with maximum site density. Detachment curves were constructed as described above (see legend of Fig. 4).
Different Molecular Mechanisms May Be Responsible for the Time-Dependent Strengthening of Bead Attachment.
Whereas detachment curves were linear on a semilogarithmic scale during the first 0.25 s following attachment, they displayed significant curvature during the first second following arrest (Fig. 4). Indeed, nonlinearity during the first second was significant at the 0.005 level for all experimental curves. The average slope of detachment curves between times 0.5 and 1 s ranged between 0.32 and 1.11 s−1, as compared with about four- to eightfold higher values measured during the first 0.25 s (Fig. 5). Interestingly, the average detachment rate during times 0.5 and 1 s was not altered when the shear rate varied between 11 and 44 s−1 (Fig. 6).
DISCUSSION
First, we demonstrated the feasibility of studying low affinity interactions (dissociation constant of order of 10−4 M) with high dissociation rate (≥6 s−1). Two key features of our methodology were the use of spherical particles, thus allowing accurate position measurement with a simple algorithm, and low particle size, allowing adequate particle velocity with minimal hydrodynamic force exerted on molecular bonds. This is possible because, as previously shown, for a given shear rate, the sphere velocity is proportional to the first power of radius a, whereas the force exerted on a single bond maintaining a particle at rest is proportional to a2.5 (7). Thus, under our experimental conditions, bonds were subjected to a stress ranging between about 5.5 and 22 pN, whereas free particles moved with a velocity between 10 and 40 μm/s, allowing in principle clear-cut detection of arrests lasting 20 ms. Thus, the flow approach can prove an useful complement to atomic force microscopy (25–29) as well as recently described ultrasensitive methods of studying weak interactions between particles (30, 31).
Second, the calculated rate of bond dissociation (i.e., about 8 s−1) between surface-attached CD2 and CD48 was consistent with the estimate obtained with the BIAcore™ or BIAcore for the off-rate of interaction between immobilized CD2 and soluble CD4–CD48 (14).
Third, the value of the force required to reduce bond lifetime significantly was consistent with previous findings, because the strength of the avidin–biotin bond was found to be about 160 pN (25), whereas a force of 110 pN increased by a factor of 3.5 the dissociation rate of selectin–ligand interactions (5).
Fourth, dissociation curves (Fig. 4) unambiguously revealed a marked bond strengthening during the first second following arrest. In view of the estimated value of the rate of formation of a first additional bond (i.e., about 40 s−1), three nonexclusive hypotheses might be considered to account for our findings. (i) Additional bonds might appear between particle-bound CD48 and immobilized CD2. This process might be significantly slower than the formation of the second bond because of geometrical constraints, e.g., slower motion of a sphere attached by two bonds. (ii) The high k− value might reflect the existence of an intermediate state with incomplete binding, as previously described (7). This would imply that the off-rate of the completely bound state be much lower under our experimental conditions than in a BIAcore apparatus. This possibility would be in line with a previously reported theoretical model (16), if the mobility of bound molecules is considered as severely restricted in our model. However, there is no direct experimental evidence for an intermediate binding state at the present time. (iii) Finally, nonspecific interactions between particles and coverslips might be enhanced after the formation of a first bond. Experimental data cannot discriminate between the above three hypotheses, and additional studies are required to achieve a safe interpretation of our results.
Finally, our results indicate that, as suggested by the solution studies (32), the CD2–CD48 interaction is indeed very unstable, dissociating in about 0.1 s. This is compatible with a highly dynamic interaction between T cells and antigen-presenting cells, which could allow contacts to be broken and reformed rapidly and would also facilitate lateral diffusion of cell-surface molecules within existing contacts. Such properties would facilitate identification by T cells of rare peptide antigen/major histocompatibility complexes.
Acknowledgments
This work was supported by grants from the Association pour la Recherche sur le Cancer and the Medical Research Council.
References
- 1.Tha S P, Shuster J, Goldsmith H L. Biophys J. 1986;50:1117–1126. doi: 10.1016/S0006-3495(86)83556-1. [DOI] [PMC free article] [PubMed] [Google Scholar]
- 2.Evans E, Berk D, Leung A. Biophys J. 1991;59:838–848. doi: 10.1016/S0006-3495(91)82296-2. [DOI] [PMC free article] [PubMed] [Google Scholar]
- 3.Tees D F, Coenen O, Goldsmith H L. Biophys J. 1993;65:1318–1334. doi: 10.1016/S0006-3495(93)81180-9. [DOI] [PMC free article] [PubMed] [Google Scholar]
- 4.Pierres A, Benoliel A M, Bongrand P. In: Cell Mechanics and Cellular Engineering. Mow V C, Guilak F, Tran-Son-Tay R, Hochmuth R, editors. New York: Springer; 1994. pp. 145–159. [Google Scholar]
- 5.Alon R, Hammer D A, Springer T. Nature (London) 1995;374:539–542. doi: 10.1038/374539a0. [DOI] [PubMed] [Google Scholar]
- 6.Hinterdorfer P, Baumgartner W, Gruber H J, Schilcher K, Schindler H. Proc Natl Acad Sci USA. 1996;93:3477–3481. doi: 10.1073/pnas.93.8.3477. [DOI] [PMC free article] [PubMed] [Google Scholar]
- 7.Pierres A, Benoliel A M, Bongrand P. J Biol Chem. 1995;270:26586–26592. doi: 10.1074/jbc.270.44.26586. [DOI] [PubMed] [Google Scholar]
- 8.Kaplanski G, Farnarier C, Tissot O, Pierres A M, Benoliel A M, Alessi M C, Kaplanski S, Bongrand P. Biophys J. 1993;64:1922–1933. doi: 10.1016/S0006-3495(93)81563-7. [DOI] [PMC free article] [PubMed] [Google Scholar]
- 9.Pierres A M, Tissot O, Malissen B, Bongrand P. J Cell Biol. 1994;125:945–953. doi: 10.1083/jcb.125.4.945. [DOI] [PMC free article] [PubMed] [Google Scholar]
- 10.Von Andrian U H, Chambers J D, McEvoy L M, Bargatze R F, Arfors K E, Butcher E C. Proc Natl Acad Sci USA. 1991;88:7538–7542. doi: 10.1073/pnas.88.17.7538. [DOI] [PMC free article] [PubMed] [Google Scholar]
- 11.Lawrence M B, Springer T A. Cell. 1991;65:859–873. doi: 10.1016/0092-8674(91)90393-d. [DOI] [PubMed] [Google Scholar]
- 12.Davis S J, van der Merwe P A. Immunol Today. 1996;17:177–187. doi: 10.1016/0167-5699(96)80617-7. [DOI] [PubMed] [Google Scholar]
- 13.Valitutti S, Dessing M, Aktories K, Gallati H, Lanzavecchia A. J Exp Med. 1995;181:577–584. doi: 10.1084/jem.181.2.577. [DOI] [PMC free article] [PubMed] [Google Scholar]
- 14.Valitutti S, Müller S, Cella M, Padovan E, Lanzavecchia A. Nature (London) 1995;375:148–151. doi: 10.1038/375148a0. [DOI] [PubMed] [Google Scholar]
- 15.Alam S M, Travers P J, Wung J L, Nasholds W, Redpath S, Jameson S C, Gascoigne N R. Nature (London) 1996;381:616–619. doi: 10.1038/381616a0. [DOI] [PubMed] [Google Scholar]
- 16.Bell G I. Science. 1978;200:618–627. doi: 10.1126/science.347575. [DOI] [PubMed] [Google Scholar]
- 17.Brown M H, Barclay A N. Protein Eng. 1994;7:515–521. doi: 10.1093/protein/7.4.515. [DOI] [PubMed] [Google Scholar]
- 18.van der Merwe P A, Brown M H, Davis S J, Barclay A N. EMBO J. 1993;12:4945–4954. doi: 10.1002/j.1460-2075.1993.tb06188.x. [DOI] [PMC free article] [PubMed] [Google Scholar]
- 19.Gray F, Cyster J G, Willis A C, Barclay A N, Williams A F. Protein Eng. 1993;6:965–970. doi: 10.1093/protein/6.8.965. [DOI] [PubMed] [Google Scholar]
- 20.Williams A F, Barclay A N, Clarle S J, Paterson D J, Willis A C. J Exp Med. 1987;165:368–380. doi: 10.1084/jem.165.2.368. [DOI] [PMC free article] [PubMed] [Google Scholar]
- 21.Pierres A, Benoliel A M, Bongrand P. C R Acad Sci Ser III. 1995;318:1191–1196. [PubMed] [Google Scholar]
- 22.Pierres A, Benoliel A M, Bongrand P. J Phys III. 1996;6:807–824. [Google Scholar]
- 23.Capo C, Garrouste F, Benoliel A M, Bongrand P, Ryter A, Bell G I. J Cell Sci. 1982;56:21–48. doi: 10.1242/jcs.56.1.21. [DOI] [PubMed] [Google Scholar]
- 24.Snedecor G W, Cochran W G. Statistical Methods. Ames, IA: Iowa State Univ. Press; 1980. pp. 398–401. [Google Scholar]
- 25.Moy V T, Florin E L, Gaub H E. Science. 1994;266:257–259. doi: 10.1126/science.7939660. [DOI] [PubMed] [Google Scholar]
- 26.Lee G U, Kidwell D A, Colton R J. Langmuir. 1994;10:354–357. [Google Scholar]
- 27.Danmer U, Popescu O, Wagner P, Anselmetti D, Güntherodt H J, Misevic G N. Science. 1995;267:1173–1175. doi: 10.1126/science.7855599. [DOI] [PubMed] [Google Scholar]
- 28.Boland T, Ratner D. Proc Natl Acad Sci USA. 1995;92:5297–5301. doi: 10.1073/pnas.92.12.5297. [DOI] [PMC free article] [PubMed] [Google Scholar]
- 29.Hinterdorfer P, Baumgartner W, Gruber H J, Schilcher K, Schindler H. Proc Natl Acad Sci USA. 1996;93:3477–3481. doi: 10.1073/pnas.93.8.3477. [DOI] [PMC free article] [PubMed] [Google Scholar]
- 30.Evans E, Ritchie K, Merkel R. Biophys J. 1995;68:2580–2587. doi: 10.1016/S0006-3495(95)80441-8. [DOI] [PMC free article] [PubMed] [Google Scholar]
- 31.Liebert R B, Prieve D C. Biophys J. 1995;69:66–73. doi: 10.1016/S0006-3495(95)79876-9. [DOI] [PMC free article] [PubMed] [Google Scholar]
- 32.van der Merwe P A, Brown M H, Davis S J, Barclay A N. Biochem Soc Trans. 1993;21:340–340. doi: 10.1042/bst021340s. [DOI] [PubMed] [Google Scholar]