

Abstract
Exogenous 20-hydroxyeicosatetraenoic acid (20-HETE) increases the growth of human glioma cells in vitro. However, glioma cells in culture show negligible 20-HETE synthesis. We examined whether inducing the expression of a 20-HETE synthase in a human glioma U251 cell line would increase proliferation. U251 cells transfected with CYP4A1 cDNA (termed U251 O) increased the formation of 20-HETE from less than 1 to over 60 pmol/min/mg proteins and increased their proliferation rate by 2-fold (p < 0.01). Compared with control U251, U251 O cells were rounded, smaller, showed a disorganized cytoskeleton, exhibited reduced vinculin staining, and were easily detached from the growing surface. They showed a marked increase in dihydroethidium staining, suggesting increased oxidative stress. The expression of phosphorylated extracellular signal-regulated kinase 1/2, cyclin D1/2, and vascular endothelial growth factor was markedly elevated in U251 O. The hyperproliferative and signaling effects seen in U251 O cells are abolished by selective CYP4A inhibition of 20-HETE formation with HET0016 [N-hydroxy-N′-(4-butyl-2-methylphenyl)-formamidine], by small interfering RNA against the enzyme, and by the putative 20-HETE antagonist, 20-hydroxyeicosa-6(Z), 15(Z)-dienoic acid. In vivo, implantation of U251O cells in the brain of nude rats resulted in a ∼10-fold larger tumor volume (10 days postimplantation) compared with animals receiving mock-transfected U251 cells. These data show that elevations in 20-HETE synthesis in U251 cells lead to an increased growth both in vitro and in vivo. This suggests that 20-HETE may have proto-oncogenic properties in U251 human gliomas. Further studies are needed to determine whether 20-HETE plays a role promoting growth of some human gliomas.
Products derived from the metabolism of arachidonic acid (AA) by members of the cytochrome P450 (450) family play an important role in the control of a number of cellular responses, including alterations in vascular tone and the growth responses, inhibition of sodium transport, platelet aggregation, cell proliferation, and angiogenesis (Capdevila and Falck, 2002; Roman, 2002; Sacerdoti et al., 2003; Zhao and Imig, 2003; Liang et al., 2008). The major isoforms involved in ω-hydroxylation of AA to 20-HETE are enzymes of the 450 4A (CYP4A) and CYP4F families. 20-HETE is a potent mitogen in a variety of cell types and has also been reported to serve as a second messenger in the mitogenic actions of a number of growth factors (Sun et al., 1999). However, the signal transduction pathways that mediate the effects of 20-HETE on cellular proliferation remain to be fully elucidated.
Cancer cells produce a wide variety of growth factors that contribute to their abnormal growth phenotype both in vitro and in vivo (Hoelzinger et al., 2007). Gliomas are the most common primary brain tumor in humans. Treatment of brain tumors, particularly glioblastoma, represents a considerable clinical challenge because they are resistant to conventional treatments, such as radiation and chemotherapy. Very little is known about the molecular pathways involved in glioma cell proliferation and survival. It would be important to understand which factors can regulate glioma cells growth. Brain vascular cells generate 20-HETE (Gebremedhin et al., 2000); in a recent study, we reported that the brain parenchyma tissue also produces substantial amounts of 20-HETE when incubated with AA (Guo et al., 2005b). Astrocytes are capable of playing a part in glioblastoma multiform invasion and are now known to generate 20-HETE, which contributes to neurovascular regulation (Metea and Newman, 2006, 2007; Gordon et al., 2007). Thus, tumors are normally exposed to 20-HETE generated from multiple sources in the brain. The National Cancer Institute database, named REMBRANDT (REpository for Molecular BRAin Neoplasia DaTa) (https://caintegrator.nci.nih.gov/rembrandt), indicates that a subpopulation of brain tumors taken from patients express enzymes known to produce 20-HETE.
We previously reported that 20-HETE induces proliferation in U251 cells and in 9L rat gliosarcoma cells in vitro. These data suggest that 20-HETE and/or its metabolic products are capable of regulating growth in human glioma cancer cells. However, exogenous addition of a compound as a single high dose is unlikely to reflect in vivo conditions, in which growth factors may be present as a continuous supply. Furthermore, exogenous addition of 20-HETE may mimic paracrine or autocrine effects. However, 20-HETE synthases are microsomal; thus, the bulk of the effects of 20-HETE may be intracrine.
We hypothesized that inducing stable expression of a 20-HETE synthase enzyme and thus 20-HETE in a human glioma cell line, U251, would alter the growth rate of these cancer cells both in vitro and in vivo. To test this hypothesis, we established a U251 cell line, termed U251 O, which stably expresses CYP4A1, a potent 450 isoform that selectively metabolizes AA to 20-HETE (Nguyen et al., 1999). We found that CYP4A1−20-HETE expression resulted in marked up-regulation of proliferation, increase in oxidative stress, marked changes in cell morphology, increases in VEGF in vitro, and marked acceleration of the growth of tumors derived from these cells in vivo.
Materials and Methods
Expression of CYP4A1 in U251
U251 human glioma cells were provided by Dr. Stephen Brown (Henry Ford Health System, Detroit, MI). The U251 cells were maintained in Dulbecco's modified Eagle's medium (DMEM) supplemented with 10% heat-inactivated fetal bovine serum, penicillin (10 IU/ml), streptomycin (10 μg/ml), and 10% nonessential amino acids (all purchased from Invitrogen, Carlsbad, CA) at 37°C in a humidified incubator containing 5% CO2. U251 cells plated onto 60-mm dishes were transfected with 10 μg of a pcDNA3.0 plasmid containing a full-length CYP4A1 cDNA (provided by Dr. David Stec, University of Mississippi, Jackson, MS) or an empty control pcDNA3.0 in 200 μl of Lipofectamine 2000 reagent (both from Invitrogen). pcDNA3.0−4A1 is a plasmid in which the 4A1 isoform is expressed under the control of the cytomegalovirus promoter. This plasmid also contains a neomycin-resistant gene. After overnight transfection, the transfected cells were selected by adding 500 μg/ml G-418 (Geneticin; Invitrogen) for up to 72 h to select cells that express the neomycin-resistant gene. Next, the cultures were maintained in the same media containing 250 μg/ml G-418 and expanded. The cells transfected with CYP4A1 were labeled as U251O and the ones transfected with the empty pcDNA3 plasmid as U251 controls.
CYP4A1 expression was confirmed by Western blot analysis and by measuring the production of 20-HETE in the cell homogenates. To measure 20-HETE synthase activity, control and transfected cells were harvested, homogenized in 0.1 M phosphate buffer, and the protein concentrations were measured. One milligram of homogenate protein was incubated with a saturating concentration of arachidonic acid for 1 h in the presence of 1 mM NADPH. The incubations were stopped by acidification to pH 3.5 with formic acid, homogenized, and the homogenate was extracted twice with 3 ml of ethyl acetate after the addition of 2 ng of an internal standard, d6-20-hydroxyeicosatetraenoic acid. The organic phase was collected and dried under nitrogen. The samples were reconstituted with 50% methanol and water, and the metabolites were separated by high-performance liquid chromatography on a Betabasic C18 column (150 × 2.1 mm, 3 μm; Thermo Electron Corporation, Belletonte, PA) at a flow rate of 0.2 ml/min using an isocratic elution starting from a 51:9:40:0.01 mixture of acetonitrile/methanol/water/acetic acid for 30 min followed by a step change to 68:13:19:0.01 acetonitrile/methanol/water/acetic acid and water for 15 min. The effluent was ionized using a negative ion electrospray and the peaks eluting with a mass/charge ratio of 319 > 301 (HETEs and epoxyeicosatrienoic acids), 337 > 319 (DiHETEs), or 323 > 270 (internal standard) were monitored using an Applied Biosystems 3000 triple quadrupole mass spectrometer (Foster City, CA). The ratios of ion abundance amount in the peaks of interest versus those seen in the internal standard were determined and compared with standard curves generated over a range from 0.1 to 2.0 ng for 20-HETE and from 1.0 to 10 ng for the other metabolites. Values are expressed as picomoles of product formed per minute per milligram of protein.
siRNA Silencing of CYP4A1 in U251 Cells Overexpressing CYP4A1
CYP4A1 overexpression in U251 O was silenced using two sets of Silencer select predesigned CYP4A1 siRNA sequence primers (s139246 and s139248; Ambion, Austin, TX). Cells were transfected using Lipofectamine 2000 (Invitrogen) according to the manufacturer's instructions. In brief, CYP4A1 targeted and control siRNA sequences were mixed with Lipofectamine 2000 reagent and added to U251 O cells at a final concentration of 10 nM for 8 h at 37°C. Cultures were then incubated for an additional 48 h before the proliferation experiments were performed.
Cell Proliferation Assays
Cell proliferation studies were performed as described previously (Guo et al., 2005a,b). The cells were plated at a density that ensured exponential growth for at least 5 days (5.0 × 10⁴ cells) and grown in DMEM containing 10% heat-inactivated fetal bovine serum plus 1% streptomycin/penicillin and 1% nonessential amino acids (Invitrogen). Two highly selective inhibitors of the synthesis of 20-HETE, HET0016 (10 μM), and N-methylsulfonyl-12,12-dibromododec-11-enamide (DDMS; 20 μM) siRNA against CYP4A1 or a 20-HETE antagonist, 20-HEDE (10 μM), which has been reported to antagonize the vasoconstrictory, and other actions of 20-HETE or vehicle (ethanol) were added separately to the cultures. The concentration of ethanol added never exceeded 0.1%. After 48 h, the cells were harvested by exposure to 0.25% trypsin/EDTA and counted in triplicate using a hemocytometer.
Cell Detachment Assay
Cells were plated in 60-mm dishes, exposed to 0.005% trypsin/EDTA, and then the cultures were observed every minute. The time in minutes needed to observe complete detachment of the cells from the plate surface was recorded.
Flow Cytometry
U251 and U251 O were cultured in 100-mm dishes at densities that ensured exponential growth at the time of harvest. The harvesting and processing protocols used to detect DNA by flow cytometry with propidium iodide have been described by Reiners et al. (1999). Cells were analyzed with a BD Biosciences FACScan (BD Biosciences, San Jose, CA) at the Institute of Environmental Health Sciences Flow Cytometry Core Facility (Wayne State University, Detroit, MI). The percentages of cells in the G0/G1, S, and G2/M stages of the cell cycle were determined with a DNA histogram-fitting program (ModFit; Verity Software House, Topsham, ME). A minimum of 104 events/sample was collected.
Western Blotting
Protein extracts were harvested from U251 and U251 O. Western blot was performed as described previously (Guo et al., 2005a,b). In brief, cells were lysed using radioimmuno-precipitation assay buffer [20 mM HEPES, pH 7.4, 100 mM NaCl, 1% Nonidet P-40, 0.1% SDS, 1% deoxycholic acid, 10% glycerol, 1 mM EDTA, 1 mM NaVO3, 50 mM NaF, and protease inhibitors set 1 (Calbiochem, San Diego, CA)]. The cell lysates were centrifuged for 10 min at 14,000g at 4°C. The protein concentration of the supernatant was determined, and protein lysate (15−20 μg) was separated on 8 to 16% Tris-glycine gel and transferred to a polyvinylidene difluoride membrane. The membranes were incubated with primary antibodies in blocking buffer overnight at 4°C, washed, and incubated for 1 h at room temperature with a peroxidase-conjugated secondary antibody and developed using an enhanced chemiluminescence kit (Pierce Chemical, Rockford, IL) and Bio-Rad Gel Documentation system (Bio-Rad, Hercules, CA). The primary antibodies were anti-CYP4A1 (Daichi), anti-extracellular signal-regulated kinase (ERK) 1/2, anti-cyclin D1/2 (Millipore, Billerica, MA), and anti-VEGF165 (Millipore Bioscience Research Reagents, Temecula, CA). The membranes were stripped and reprobed with actin primary antibody (Santa Cruz Biochemicals, Santa Cruz, CA) that served as a loading control.
Assessment of Superoxide Production
The production of superoxide in U251 O and control cells was determined qualitatively by dihydroethidium (DHE) fluorescence, a specific probe for intracellular as described previously (Guo et al., 2007). Equal numbers of cells were plated in 12-well plates and allowed to grow overnight. Cultures were then placed in sterile Dulbecco's phosphate-buffered saline (Mediatech, Herndon, VA) containing 100 mg/l Ca2+ and Mg2+, 0.1% d-glucose, 50 μM l-arginine, and 100 μM NADPH for 20 min followed by the addition of 2 μM DHE. After an additional 30-min incubation, fluorescent images were obtained with a 20× objective using identical exposure times (2 s) with an inverted Leica immunofluorescence microscope (Leica, Wetzlar, Germany) with an excitation filter of 535 ± 25 nm and an emission filter of 610 ± 25 nm. The images were acquired for an average of 1 s using a spot digital camera and software.
Focal Adhesion and Morphological Assessment
U251 and U251 O cells plated in 12-well culture plates were double stained for focal adhesion and F-actin according to the manufacturer's recommended protocol. In brief, cells were fixed with 4% paraformaldehyde in phosphate-buffered saline for 15 min and then permeabilized with 0.1% Triton X-100 for 5 min. Cells were washed and blocked with 1% bovine serum albumin in phosphate-buffered saline. Cells were incubated with anti-vinculin antibody (1:1000; Millipore Corporation, Billerica, MA), followed by incubation with goat-anti-rabbit horse-radish peroxidase-conjugated secondary antibody (1:3000) and tetramethylrhodamine B isothiocyanate-conjugated phalloidin (1:500) for 30 min at room temperature. The cells were stained for α-tubulin as we have previously described using FITC-conjugated anti-α-tubulin IgG (Guo et al., 2005a,b). The nuclei were counterstained by incubating the cells with DAPI for 2 min at room temperature and mounted on a slide with antifade mounting solution source. Cytoskeletal elements were visualized with a Leica fluorescence inverted microscope using an excitation/emission of 480 ± 20/535 ± 25 nm. The images were acquired using a spot digital camera and overlaid using Image-Pro Express 6.0 software (Media Cybernetics, Inc., Bethesda, MD).
Growth of U251 and U251 O Tumors in Vivo
Experimentally induced brain tumors were established by injecting mock-transfected U251 and U251 O cell suspensions into the cerebral cortex of nude rats. All animal studies were approved by an institutional animal care and user committee. Adult female nude rats (rnu/rnu), purchased from the National Institutes of Health, were anesthetized with an i.p. injection of 0.5 ml of 0.9% NaCl containing 100 mg/kg ketamine and 15 mg/kg xylazine. The surgical zone was swabbed with Betadine solution, the eyes were coated with Lacri-lube, and the animal was immobilized in a small animal stereotactic device (David Kopf Instruments, Tujunga, CA). After draping, a 1-cm incision was made 2 mm to the right of the midline 1 mm retro-orbitally, the skull was exposed with cotton-tip applicators, and an HP-4 dental drill bit was used with a micromanipulator to drill a hole (1 mm in diameter), 3 mm to the right and 2.5 mm anterior of the bregma, taking care not to penetrate the dura.
Immediately before implantation, the cell cultures were trypsinized and resuspended in serum-free DMEM without additional supplements. A 10-μl Hamilton syringe with a no. 4 point, 26-gauge needle containing tumor cells was inserted 3.5 mm into the cerebral cortex, then raised to a depth of 2.5 mm and 4 × 10⁵ cells in 5 μl of medium (either mock-transfected U251 or U251 O) were injected at a rate of 0.5 μl/30 s until the entire volume was injected. If reflux was noted from the injection site, the animal was discarded. After completing the injection, we waited 2 to 3 min before withdrawing the needle. The hole in the skull was sealed with bone wax, and the skin was sutured over the incision site. The tumors were allowed to grow for 10 days before analyzing tumor volume by MRI.
MRI Imaging of Tumor Volume
The animals were anesthetized with isoflurane (3% for induction, 0.7−1.5% for maintenance mixed with O2). MRI images were obtained with a 3-Tesla clinical system (Signa Excite; GE Healthcare, Chalfont St. Giles, UK) using 50-mm diameter × 108-mm RF rung-length small animal imaging coil (Litzcage small animal imaging system; Doty Scientific Inc., Columbia, SC). Stereotaxic ear bars were used to minimize movement during the imaging procedure. After positioning using a triplanar FLASH sequence, MRI studies were performed using fast spin echo T2- and pre T1-weighted MRI scans. The following parameters were used to acquire MRI: fast spin echo T2-weighted multiecho (30, 60 ms) multilise sequences (1000 ms, 256 × 256 matrix, 13−15 slices, 1 mm thick, 40 × 30-mm field of view, number of excitation = 4), T1-weighted multislice sequence (=700/20 ms, 256 × 256 matrix, 13−15 slices, 1 mm thick, 40- × 30-mm field of view, number of excitation = 4). To delineate the margin of the tumor properly for hand drawn region of interest (ROI) and to determine the enhancement in the tumors, gadolinium contrast agent (Gd-DTPA 0.2 mmol/kg) was injected i.v. at the end, and postcontrast T1-weighted images were acquired using the above-mentioned T1-weighted image parameters. T2-weighted images were used to determine the necrosis within the tumors (tumor necrosis usually shows high signal intensity on T2-weighted images). Postcontrast T1-weighted images were used to determine the volume and enhancement (signal intensity) of the tumors.
MRI Image Analysis
Signal intensities (SIs) of the tumors and the normal brains were determined by hand-drawn ROI around the tumors and the contralateral hemispheres from T1-weighted images using image analysis software (Eigentool image analysis software developed at the Radiology Image Analysis Laboratory of the Henry Ford Health System; http://www.radiologyresearch.org/eigentool.htm). Signal intensities were determined from consecutive images containing tumors. Percent intensity change in the tumors compared with contralateral hemispheres was calculated as follows: (mean SI of tumor/mean SI of contralateral brain) × 100. The values were calculated for every section that contained tumor and averaged together. An operator blind to the animal groups drew and calculated the values. Likewise, tumor volume was also calculated by drawing ROI around the tumors from all images containing tumors.
Tumor Processing
Tissue was harvested immediately after the MRI analysis from the animals implanted with U251 O (10 days after implantation) and from the animals with mock-transfected U251 (18 days after implantation). The animals were euthanized with 150 to 200 mg/kg pentobarbital and perfused with 100 ml of saline and 100 ml of 2.5% paraformaldehyde intracardiacally, given at 5 ml/min. The brain was collected, and immersion was fixed in 4% paraformaldehyde and 3% sucrose. The brains were sectioned using a cryostat and 20 μm sections stained with hematoxylin and eosin for histological analysis.
Statistical Analysis
The significance of differences in mean values was analyzed using analysis of variance followed by Tukey's post hoc test or a Student's t test when only two groups were compared. A p value < 0.05 was considered to be significant.
Results
Expression of CYP4A1 and 20-HETE Production in Control U251 and U251 Cells Overexpressing CYP4A1
The results of these experiments are presented in Fig. 1. U251 cells transfected with pcDNA3-CYP4A1 (U251 O) express significantly higher immunoreactivity for CYP4A1 compared with U251 cultures that were transfected with empty pcDNA3 vector (Fig. 1A). When incubated with arachidonic acid, U251 O produced substantial amounts of 20-HETE, whereas the production of 20-HETE by control U251 was very low and in half the cultures below the limits of detection (<100 pg/30 min) (Fig. 1B).
Fig. 1.
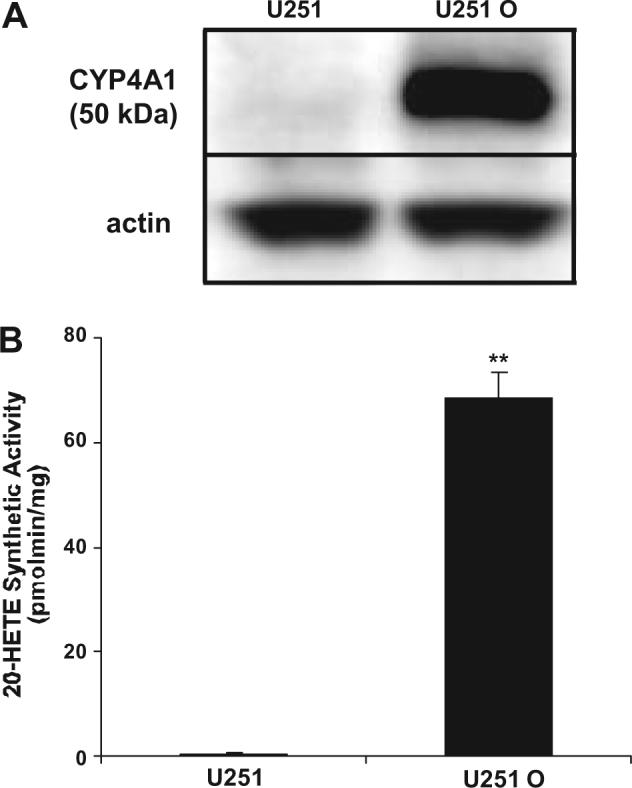
Comparison of the expression of CYP4A protein and the production of 20-HETE in control and human U251 glioma cells transfected with a CYP4A1 plasmid. U251 cells were transfected with either empty pcDNA3 (designated as U251) or pcDNA3 plasmid containing full-length CYP4A1 cDNA (designated U251 O). Stable transfectants were selected by adding G-418 to the culture media. A, Western blot analysis of the expression of CYP4A1 in 20 μg of homogenate protein isolated from control and U251 cells transfected with a CYP4A1 cDNA. The blots were also probed with β-actin as a control for equal loading. B, liquid chromatography/mass spectrometry analysis of the production of 20-HETE in control and human U251 glioma cells transfected with a CYP4A1 plasmid. Mean values ± S.E. from incubations derived from three separate cultures are presented. **, p < 0.01.
Comparison of the Growth of U251 and U251 Cells Overexpressing CYP4A1 in Vitro
We found that expression of CYP4A1 in U251 O cells was associated with a hyperproliferative state. U251 O showed an almost 2-fold higher proliferation rate compared with mock-transfected U251 (p < 0.01) over a 3-day period (Fig. 2A). Flow cytometric analysis of the cell cycle suggested that this was due to an increased number of cells in the S phase (29 ± 1.55 versus 39 ± 1.53%, p < 0.01, U251 versus U251 O) (Fig. 2C). HET0016, a selective inhibitor of the formation of 20-HETE, completely abolished the increased S phase in the cell cycle and the increased proliferation of the U251 O (Fig. 2, B and C). Likewise, DDMS, a structurally different CYP4A1 inhibitor, also markedly decreased the proliferation of U251 O (Fig. 2B), whereas administration of 20-HEDE, a potent putative 20-HETE antagonist, for 48 h had no effects on the growth of U251 cells but completely abolished the hyperproliferation of U251 O (Fig. 2B).
Fig. 2.
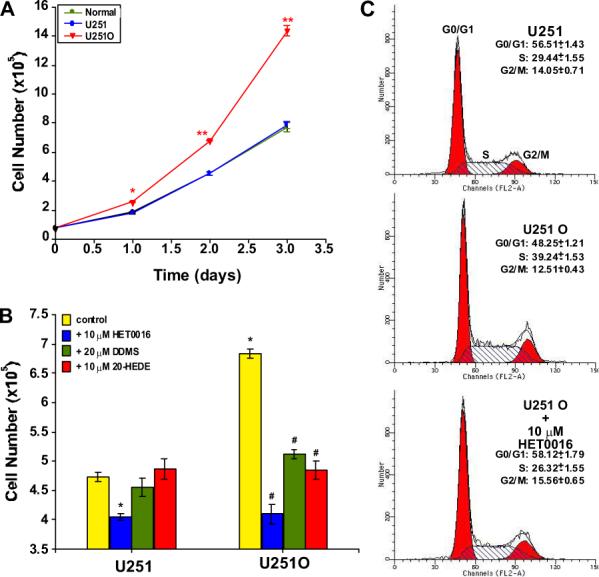
Comparison of the growth of control and U251 cells expressing CYP4A1 in vitro. A, nontransfected U251 (normal), mock-transfected U251, and U251 O were plated at 5 × 10⁴ density, and the number of cells at time 0 (T0) was recorded the next morning. Cell numbers were determined for 3 days. B, effects of selective inhibitors of the synthesis of 20-HETE, HET0016 (10 μM), and DDMS (20 μM) and two 20-HETE antagonists, 20-HEDE (10 μM) and 6,15-HEDGE (10 μM), on the proliferation of U251 O cells after 48 h. C, flow cytometric analysis of cell cycle profiles of U251, U251 O, and U251 O treated with HET0016. Mean values ± S.E.M. from at least three separate experiments are presented. *, p < 0.05; **, p < 0.01; #, p < 0.05 from corresponding value in U251 O.
To further confirm that the hyperproliferation of U251 O is specifically caused by increased CYP4A1 expression, siRNA against CYP4A1 was used to transfect U251 O. We found that CYP4A1 siRNA decreased CYP4A1 protein expression drastically in U251 O (Fig. 3A) and was associated with a significant decrease in the proliferation (Fig. 3B).
Fig. 3.
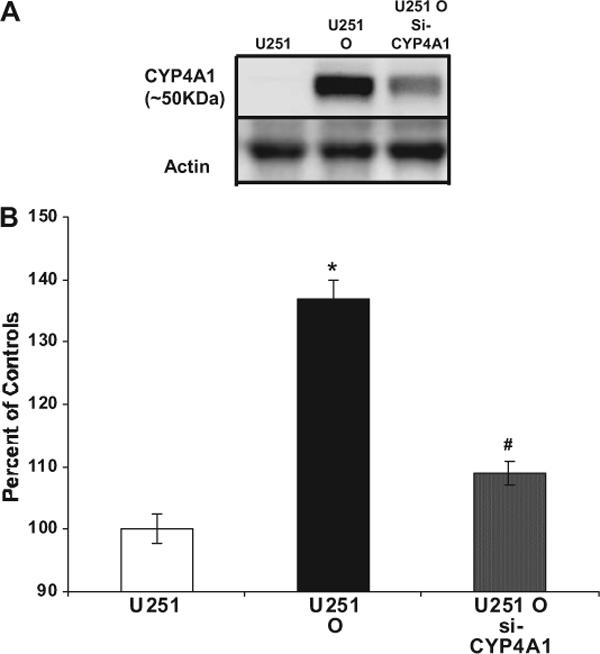
Effects of CYP4A1 siRNA on U251 cells overexpressing CYP4A1 and its proliferation. A, CYP4A1 siRNA sequences were used to transfect U251 overexpressing cells as described under Materials and Methods. Protein extracts were obtained, and Western blot analyses (10 μg/well) were performed to assess the down-regulation of CYP4A1 protein by CYP4A1 siRNA. B, U251 control cells, U251 cells overexpressing CYP4A1 (U251 O), and siRNA-treated U251 O were all plated at 5 × 10⁴ cells/dish, and the number of cells at time 0 (T0) was counted next morning. Cell numbers were determined 48 h later. *, p < 0.05 from U251 control cells; #, p < 0.05 from corresponding value in U251 O.
Comparison of the Cytoskeletal Structure and Cell Adhesion in U251 Control and U251 Cells Overexpressing CYP4A1
As can be seen in Fig. 4, U251 cells overexpressing CYP4A1 (U251 O) were morphologically distinct from control cells. U251 O cells were rounder and smaller in size. F-actin and α-tubulin staining indicated that the cytoskeleton of U251 O cells was disrupted and disorganized compared with mock-transfected U251 cells. We also found that U251 O had significantly reduced and dispersed immunoreactivity to vinculin, suggesting a loss of points of focal adhesion (Fig. 4). U251 O also exhibited decreased cell adhesion in culture, and significantly less time was required for U251 O cells to detach from the growth surface when exposed to a low concentration of trypsin (15 ± 2.5 min for U251 O to detach versus 38 ± 3 min for U251 control cells; data not shown).
Fig. 4.
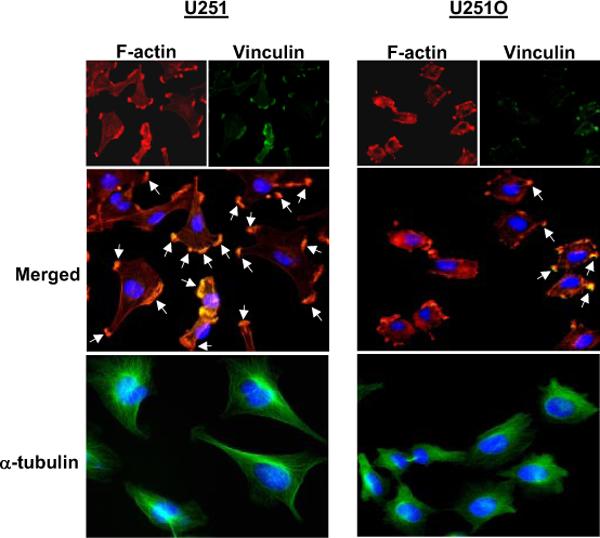
Comparison of the cytoskeletal structure and cell adhesion in control and U251 cells expressing CYP4A1. Top, representative images of F-actin stained (red) with tetramethyl rhodamine isothiocyanate-conjugated phalloidin. Points of focal adhesion (green) were visualized using anti-vinculin antibody followed by an FITC-coupled secondary antibody. Nuclei were stained blue using DAPI. Merged tricolor images are presented to illustrate the colocalization of actins with points of focal adhesion (orange). Bottom, representative images of cells costained with an FITC-conjugated anti-α-tubulin antibody (green) and DAPI (blue). White arrows, focal adhesion points.
Effects of CYP4A1 Expression on Oxidative Stress
Superoxide production was compared between U251 and U251 O cells by measuring changes in DHE fluorescence (Fig. 5A). U251 O cells exhibited marked (at least ∼4−5-fold) increases in DHE fluorescence compared with mock-transfected U251. To determine whether the increase in oxidative stress contributes to the hyperproliferation seen in U251 O cells, we examined the effects of adding 200 U/ml PEG-SOD (Fig. 5B). Addition of PEG-SOD to the media reduced the proliferation rate of both control and U251 cells expressing CYP4A1, but the effect was much greater in the U251 O cells with increased oxidative stress (Fig. 5B). In contrast, treatment with PEG-catalase had no effects (data not shown).
Fig. 5.
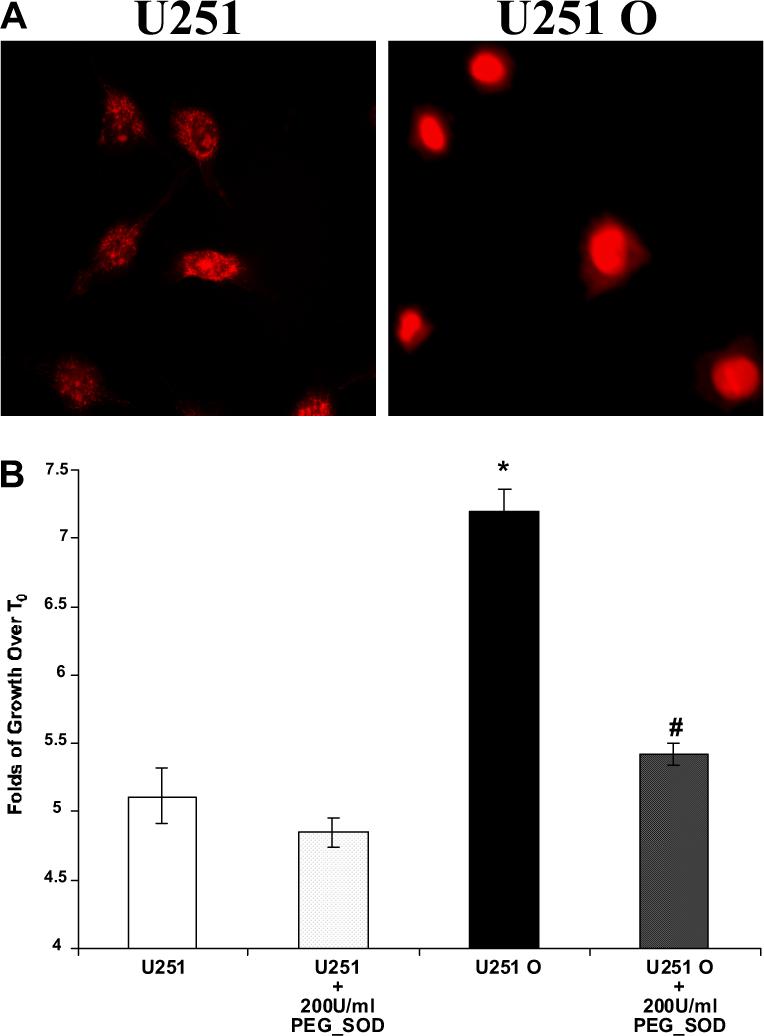
Comparison of DHE staining in control and U251 cells expressing CYP4A1. A, representative images of control and U251 cells expressing CYP4A1 incubated with DHE for 30 min. B, effects of PEG-SOD to reduce levels of ROS on the growth of control and U251 cells expressing CYP4A1. U251 and U251 O were treated with 200 U/ml PEG-SOD for 48 h, and cell numbers were assessed by cell counts. Data shown are expressed as -fold of growth over T0. Mean ± S.E. values from at least three separate experiments are presented. *, p < 0.05 from respective control; #, p < 0.05 from the corresponding value seen in mock-transfected U251 cells.
Effects of CYP4A1 Expression on Cell Cycle and Cell Signaling Pathways
The effects of CYP4A1 expression on ERK1/2 and cyclin D1/2 signaling known to be important in cell proliferation and the levels of VEGF were examined. The results (Fig. 6) indicate that the levels of phosphorylated ERK1/2 and expression of cyclin D1/2 and VEGF were increased in U251 cells expressing CYP4A1 versus control U251 cells. Hypoxia-inducible factor-1α was undetectable in all U251 cells (data not shown). Blockade of the synthesis of 20-HETE with HET0016 prevented up-regulation of the expression of ERK1/2, cyclin D1/2 and VEGF in the U251 O cells expressing CYP4A1.
Fig. 6.
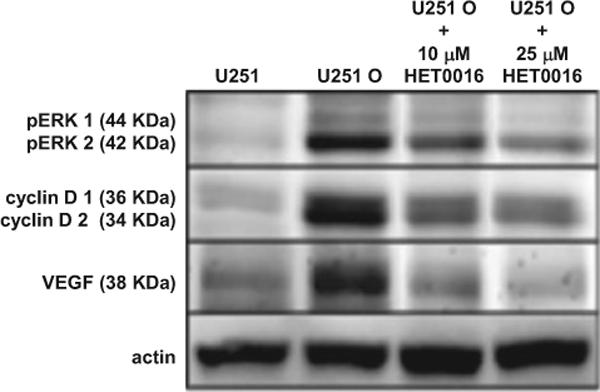
Effects of expression of CYP4A1 on cell cycle and cell signaling pathways. U251 and U251 O were plated onto 100-mm cultures dishes and grown overnight to ∼40% confluency and treated with vehicle (ethanol) or 10 or 25 μM HET0016 for 30 h. Cell homogenates were prepared and analyzed for expression of phosphorylated ERK1/2, cyclin D1/2, and VEGF. Actin was also probed as a loading control. Representative blots from a minimum of three separate experiments are presented.
Mechanisms Involved in the Proliferative Effects of 20-HETE in U251 Cells Overexpressing CYP4A1
To further examine the mechanisms by which 20-HETE and oxidative stress induces cell proliferation, we examined the effects of U0126, a mitogen-activated protein kinase kinase-1 inhibitor, on the growth of U251 O cells. We found that U0126 (10 μM) abolished the increased phosphorylation of ERK1/2 (Fig. 7A) and the hyperproliferation of U251 O (Fig. 7B). To examine whether activation of ERK1/2 precedes or is caused by the increases in oxidative stress, these experiments were repeated using the superoxide-metabolizing enzyme, PEGSOD. Administration of PEG-SOD (200 U/ml) had no effects on the phosphorylation of ERK1/2.
Fig. 7.
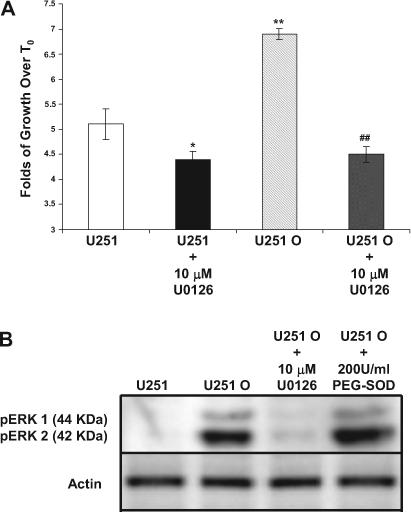
Role of MAPK in U251 O hyperproliferation and cell signaling. A, U251 and U251 O were plated again at 5 × 10⁴ cells/dish and allowed to grow overnight. Vehicle (ethanol) or 10 μM U0126 were added to culture media at T0, and the cells were counted 48 h later. Data shown are expressed as -fold of change in cell number measured at T0. Mean values ± S.E. from at least three separate experiments are presented. B, representative Western blot analysis using anti-pERK1/2 antibody from at least three experiments are shown. The cells were treated with vehicle (DMSO), 10 μM U0126, or 200 U/ml PEG-SOD. * and **, p < 0.05 and p < 0.01 from control, respectively; ##, p < 0.01 from the corresponding value in mock-transfected U251 cells.
Comparison of the Growth of Tumors from Control and U251 Cells Overexpressing CYP4A1
The results of these experiments are summarized in Fig. 8. Our pilot animal survival studies with U251 O indicated very rapid growth of intracranial implanted tumors, with animals showing signs of impending death 11 to 12 days after implantation. In contrast, animals implanted with control U251 cells did not showed any sign of morbidity, and they were all alive at the time in which the experiment was terminated at 18 days after implantation. Therefore, we performed MRI on animals 10 days after implanting U251 O and mock-transfected U251 cells. All rats implanted with U251 O had large tumors 10 days after implantation, and the volume of the tumors was more than 10 times higher than that seen in the control animals given the mock-transfected U251 cells. On average, tumor volumes in the rats injected with the control U251 cells showed a large size on day 18 (data not shown). Histological images of U251 O tumors collected at day 10 after implantation versus U251 tumors collected at day 18 are presented in Fig. 9. Both the control and U251 tumor expressing CYP4A1 represented highly cellular, poorly differentiated neoplasms filling the lateral ventricle and infiltrating into the periventricular brain parenchyma along blood vessels. Both tumors exhibited frequent apoptotic bodies and mitotic figures. The tumors derived from the U251 O cells exhibited a greater frequency of mitotic figures averaging at approximately 60/10 400× fields versus approximately 40/10 400× fields seen in mock-transfected U251 tumors (Fig. 9). Immunohistochemical staining for the endothelial marker, factor VIII, demonstrated that both tumors contain a similar dense network of blood vessels (data not shown).
Fig. 8.
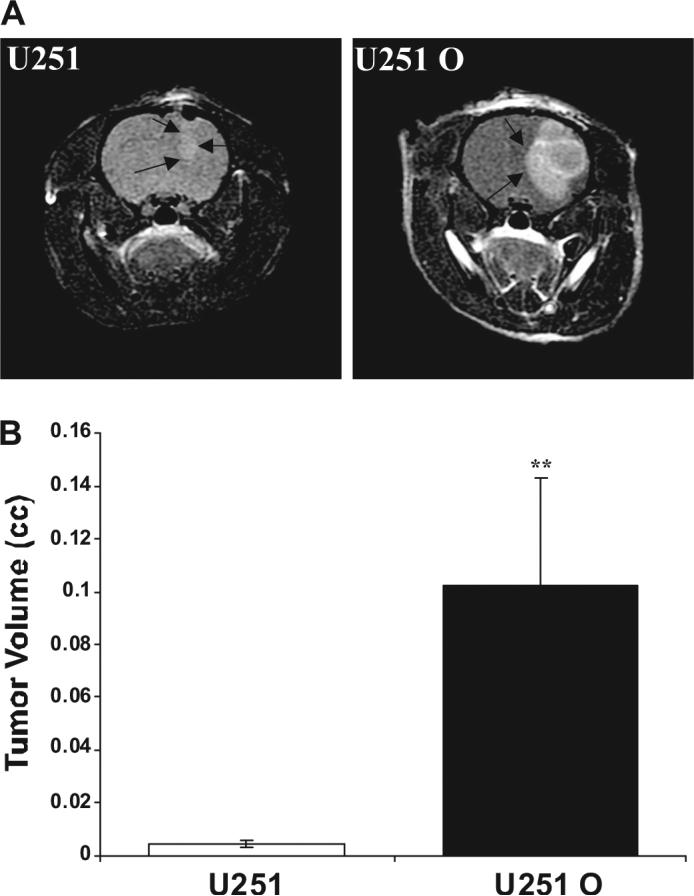
MRI analysis of the growth of tumors from control and U251 cells expressing CYP4A1. U251 and U251 O cells were implanted at a density 4 × 10⁵ cells/5 μl volume into the brains of nude rats. Ten days after implantation, MRI was performed to determine tumor volumes. A, MRI images showing the size of tumors derived from control and U251 cells expressing CYP4A1 10 days after implantation. B, means ± S.E. of tumor volumes. n = 4 rats/group (**, p < 0.01 from corresponding tumor volumes measured in U251 cells).
Fig. 9.
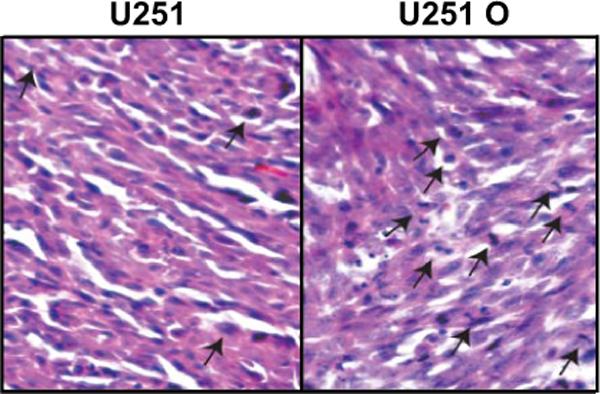
U251 O-induced tumors are more mitotic than U251 tumor. U251 and U251 O were implanted into the brain of nude rats and allowed to grow. Frozen sections from U251 O tumors at 10 days and from the tumor induced by mock-transfected U251 that reached comparative volumes (∼18 days) were obtained and stained with hematoxylin and eosin. Mitotic figures were counted from random 40× fields and are indicated by a black arrow.
Schematic Illustration of the Cascade of Events That Are Responsible for the Hyperproliferative Phenotype of U251 Overexpressing 20-HETE Synthase
Taking all these data together, we suggest the following. CYP4A1 expression in U251 cells results in high formation of 20-HETE, which first causes activation of ERK1/2 and then increases in oxidative stress by mechanisms not yet clear. This, in turn, leads to increases in cyclin D1/2 and thus likely to the cell replicating machinery and a constitutively activated VEGF production (Fig. 10).
Fig. 10.
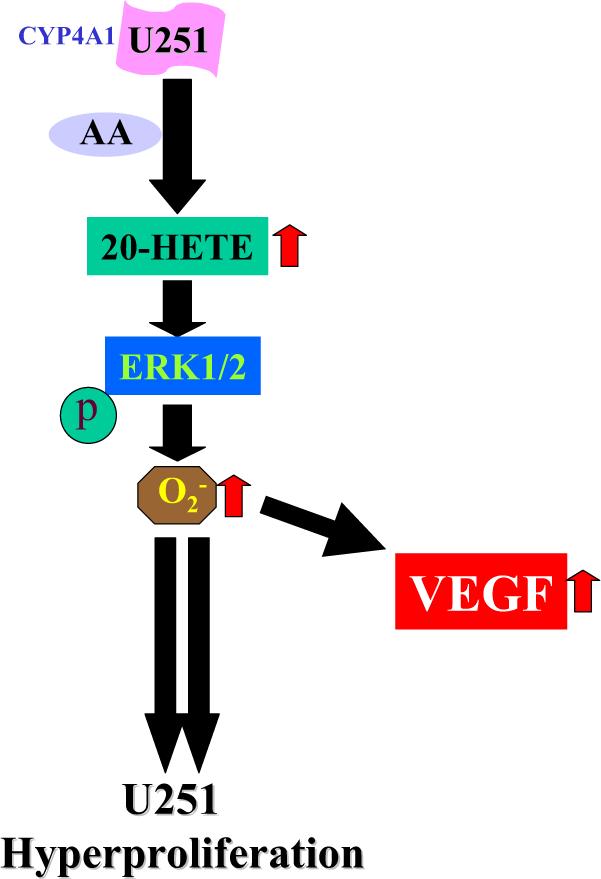
Schematics of cascade of events involved by which expression of CYP4A1−20-HETE induces hyperproliferation of U251. CYP4A1 expression in human U251 cells results in high formation of 20-HETE, which first causes activation of ERK1/2 and then increases in oxidative stress by mechanisms not yet clear. This in turn leads to increases in cell proliferation and VEGF.
Discussion
Previous studies have indicated that 20-HETE is produced by vascular and brain tissue (Roman, 2002; Metea and Newman, 2006; Gordon et al., 2007; Medhora et al., 2007b). We have shown that the addition of a single dose of a 20-HETE analog to the cell media transiently stimulates the proliferation of U251 human glioma cells in vitro (Guo et al., 2005a,b). Exogenous 20-HETE may mimic autocrine or paracrine effects of the compound. However, 20-HETE synthases are microsomal enzymes and thus release 20-HETE intracellularly. In cell cultures, it is difficult to study the role of AA ω-hydroxylases in regulating cell functions because they are down-regulated. In U251, the mRNA coding for CYP4A11 is only detectable after 30 cycles of reverse transcriptase-polymerase chain reaction (Guo et al., 2005a).
We used U251 cells to explore the hypothesis that continuous and high production of 20-HETE would alter the growth rate of these cells. We compared mock-transfected U251 cells with cells transfected with a full-length rat CYP4A1 cDNA (termed U251 O). Although CYP4A1 is a rat enzyme, it has a high degree of homology with its human counterpart, CYP4A11 (Graham et al., 2006), and it has the advantage of being a potent 20-HETE synthase while having negligible ability to form epoxides (Nguyen et al., 1999; Medhora et al., 2007a). Thus, using CYP4A1 enabled us to clearly attribute the effects to 20-HETE.
The U251 O cells had more than 2-fold increases in proliferation rate and more cells entering the S phase of the cell cycle than mock-transfected cells, suggesting enhanced DNA replication. The elevated proliferation rate was abolished by treatment of the cells with a selective inhibitor of the synthesis of 20-HETE by inhibiting CYP4A1 synthesis with siRNA against CYP4A1 and by 20-HEDE, an antagonist of the biological actions of 20-HETE (Yu et al., 2004). These results demonstrated that the enhanced proliferation in U251 O was due to the high 20-HETE synthase activity.
We found that U251 O cells had profound alterations in their cytoskeleton. These cells also detached more easily from the basement matrix. A major component of the focal adhesion complex is vinculin that provides mechanical coupling between the integrins and the cytoskeleton. We found that the expression of immunoreactive vinculin was markedly reduced on the cell surface of U251 O compared with control cells, perhaps explaining their decreased adhesion.
U251 O had significantly higher levels of superoxide compare with U251 control cells. The increased proliferation rate of the U251 O requires superoxide, but not H2O2 because it was abolished by treatment with PEG-SOD, but not with PEG-catalase. This suggests that the redox imbalance caused by expression of CYP4A1−20-HETE also caused signals that directed the glioma cell line to greatly increase proliferation. This is consistent with the accumulating evidence suggesting that high 20-HETE might be associated with increased superoxide formation and changes in cell function (Guo et al., 2007; Cheng et al., 2008; Medhora et al., 2008; Nilakantan et al., 2008).
Interestingly, we observed no morphological evidence of apoptosis or necrosis in U251 cells expressing CYP4A1, even though these processes are activated in some cells by increased oxidative stress (Ueda et al., 2002; Pelicano et al., 2004). We cannot exclude the possibility that 20-HETE may act inhibiting apoptosis.
The cellular responses to oxidative stress are complex and often involve multiple signaling pathways. Oxidants can trigger phosphorylation cascades that are causally involved in the cell responses. U251 O would show chronic changes in these phosphorylation cascades because the cells are responding to constitutive and long-lasting changes in CYP4A1-derived products and ROS. The Ras-dependent ERK1/2 of the mitogen-activated protein kinase pathway is one of the key signal transduction pathways that regulate cell proliferation. ERK1/2 phosphorylate a vast array of substrates localized in all cellular compartments (Yoon and Seger, 2006). Growth effects of ROS may involve modifications of the MAPKs (Meloche and Pouyssegur, 2007). We found that U251 O cells had marked increases in phosphorylated ERK1/2. Furthermore, inhibition of ERK1/2 activation with the mitogen-activated protein kinase kinase-1 inhibitor U0126 halted the increased proliferation of U251 O. These findings suggest that the hyperproliferative effects of CYP4A1 expression are associated with the activation of the MAPK pathway through increased phosphorylation of ERK1/2 by 20-HETE. It is interesting to note that the increases in phosphorylated ERK1/2 were little affected by treatment with either PEG-SOD or Tempol (an SOD mimetic; data not shown). These results suggest that expression of CYP4A1−20-HETE alters cell growth in U251 human gliomas by a mechanism that initially involves activation of the ERK1/2 and then causes increases in ROS, which in turn trigger changes in cell proliferation. In endothelial cells, the effects of 20-HETE also require ERK1/2 activation (Guo et al., 2007), suggesting that increased superoxide and MAPK activation are common pathways whereby high 20-HETE might influence cell growth and function.
In response to mitogenic factors, d-type cyclins progressively accumulate during the G1 phase and assemble with their catalytic partners, Cdk4 and Cdk6 (Malumbres and Barbacid, 2005). U251 O also had markedly elevated concentrations of D1/2 cyclase, suggesting that activation of ERK1/2 resulted in accumulation of d-type cyclins because it is known to occur in cells progressing from the G1 to the S phase of the cell cycle (Malumbres et al., 2004). Further studies will be needed to determine whether the increases in d-type cyclins are involved in the hyperproliferative phenotype induced by high 20-HETE.
The growth and invasiveness of malignant glial tumors are markedly dependent on the process of neovascularization (angiogenesis), which is thought to be driven mainly by VEGF (Jain et al., 2007; Peddinti et al., 2007). We found that U251 O had high VEGF levels. This was not secondary to up-regulation of the known VEGF regulator hypoxia-inducible factor-1α because this factor was not detectable either in control U251 or U251 O. This fact suggests that 20-HETE is a nonhypoxic regulator of VEGF in human glioma cells, as we have shown in endothelial cells (Guo et al., 2007). Thus, the expression of CYP4A1−20-HETE induces hyperproliferation and enhanced VEGF, both features that are often found in aggressive human brain tumors (Jain et al., 2007).
To determine whether U251 O induces brain tumors and its characteristics, we inserted these cells into the brain of nude rats. Consistent with the in vitro data, a rapidly growing large tumor developed in these rats in just 8 to 10 days, whereas in the control group, the tumor was much smaller. Analysis of sections from U251 O tumors at 10 days and from the tumor induced by mock-transfected U251 that reached comparative high volumes (∼18 days) revealed that U251 O tumors have high mitotic figures, consistent with increased cell proliferation. Both tumors have similar vascular density, suggesting that U251 O was not only fast growing but also capable of simultaneously creating a vascular network to permit this accelerated growth. This is consistent with the view that the CYP4A1−20-HETE can promote and/or regulate angiogenesis (Chen et al., 2005; Guo et al., 2007). These data show that high endogenous 20-HETE synthase in U251, a human glioma cell line, leads to a fast-growing tumor in vivo.
These are the first studies dealing with CYP4A enzymes and a human glioma cell line, and their clinical relevance is not clear yet. One possible explanation for this association is that elevated production of 20-HETE in tumors might stimulate the cell replicating machinery, leading to a marked increase in cell proliferation in vitro and the growth of tumors in vivo. Further studies are needed to ascertain whether or not 20-HETE synthesis contributes to tumor growth in humans. This would be clinically important because CYP4A/4F activity can be readily inhibited.
Acknowledgments
We thank A. Steinman and K. Friedrich for technical assistance with the liquid chromatography/mass spectrometry analysis of 20-HETE production and Gary Trick for editorial review of the manuscript.
This study was supported by the National Institutes of Health (Grants EY014385 to A.G.S., GM31278 to J.R.F., and HL 036279 to R.J.R.) and by a grant from the Robert A. Welch Foundation (to J.R.F.).
ABBREVIATIONS
- AA
arachidonic acid
- P450
cytochrome P450
- 20-HETE
20-hydroxyeicosatetraenoic acid
- VEGF
vascular endothelial growth factor
- DMEM
Dulbecco's modified Eagle's medium
- siRNA
small interfering RNA
- HET0016
N-hydroxy-N′-(4-butyl-2-methylphenyl)-formamidine
- DDMS
N-methylsulfonyl-12,12-dibromododec-11-enamide
- 20-HEDE
20-hydroxyeicosa-6(Z),15(Z)-dienoic acid
- ERK
extracellular signal-regulated kinase
- DHE
dihydroethidium
- FITC
fluorescein isothiocyanate
- DAPI
4,6-diamidino-2-phenylindole
- MRI
magnetic resonance imaging
- ROI
region(s) of interest
- SI
signal intensity
- PEG-SOD
polyethylene glycol-superoxide dismutase
- U0126
1,4-diamino-2,3-dicyano-1,4-bis(2-aminophynyltio)butadiene
- ROS
reactive oxygen species
- MAPK
mitogen-activated protein kinase
- 6, 15-HEDGE
N-[20-hydroxyeicosa-6(Z), 15(Z)-dienoyl]glycine
Footnotes
Part of this work were previously presented as follows: Guo AM, Edwards PA, Falck JR, Roman RJ, Jafari-Khouzani K, and Scicli GA (2008) Overexpression of CYP4A1−20-HETE in U251 glioma cell induces a hyperproliferative phenotype in vitro and rapidly growing tumors in vivo. 10th Annual Winter Eicosanoid Conference; 2008 Mar 9−12; Baltimore, MD; and Guo AM, Roman RJ, Falck JR, Jafari-Khouzani K, Edwards PA, and Scicli GM (2008) Overexpression of CYP4A1−20-HETE in U251 glioma cell induces hyperproliferative phenotypes in vitro and in vivo; 2008 Experimental Biology Annual Meeting; 2008 Apr 5−9; San Diego, CA.
References
- Capdevila JH, Falck JR. Biochemical and molecular properties of the cytochrome P450 arachidonic acid monooxygenases. Prostaglandins Other Lipid Mediat. 2002;68−69:325–344. doi: 10.1016/s0090-6980(02)00038-2. [DOI] [PubMed] [Google Scholar]
- Chen P, Guo M, Wygle D, Edwards PA, Falck JR, Roman RJ, Scicli AG. Inhibitors of cytochrome P450 4A suppress angiogenic responses. Am J Pathol. 2005;166:615–624. doi: 10.1016/S0002-9440(10)62282-1. [DOI] [PMC free article] [PubMed] [Google Scholar]
- Cheng J, Ou JS, Singh H, Falck JR, Narsimhaswamy D, Pritchard KA, Jr, Schwartzman ML. 20-Hydroxyeicosatetraenoic acid causes endothelial dysfunction via eNOS uncoupling. Am J Physiol Heart Circ Physiol. 2008;294:H1018–H1026. doi: 10.1152/ajpheart.01172.2007. [DOI] [PubMed] [Google Scholar]
- Gebremedhin D, Lange AR, Lowry TF, Taheri MR, Birks EK, Hudetz AG, Narayanan J, Falck JR, Okamoto H, Roman RJ, et al. Production of 20-HETE and its role in autoregulation of cerebral blood flow. Circ Res. 2000;87:60–65. doi: 10.1161/01.res.87.1.60. [DOI] [PubMed] [Google Scholar]
- Gordon GR, Mulligan SJ, MacVicar BA. Astrocyte control of the cerebrovasculature. Glia. 2007;55:1214–1221. doi: 10.1002/glia.20543. [DOI] [PubMed] [Google Scholar]
- Graham RA, Goodwin B, Merrihew RV, Krol WL, Lecluyse EL. Cloning, tissue expression, and regulation of beagle dog CYP4A genes. Toxicol Sci. 2006;92:356–367. doi: 10.1093/toxsci/kfl009. [DOI] [PubMed] [Google Scholar]
- Guo AM, Arbab AS, Falck JR, Chen P, Edwards PA, Roman RJ, Scicli AG. Activation of VEGF through ROS mediates 20-HETE-induced endothelial cell proliferation. J Pharmacol Exp Ther. 2007;321:18–27. doi: 10.1124/jpet.106.115360. [DOI] [PubMed] [Google Scholar]
- Guo M, Roman RJ, Falck JR, Edwards PA, Scicli AG. Human U251 glioma cell proliferation is suppressed by HET0016, a selective inhibitor of CYP4A. J Pharmacol Exp Ther. 2005a;315:526–533. doi: 10.1124/jpet.105.088567. [DOI] [PubMed] [Google Scholar]
- Guo M, Roman RJ, Fenstermacher JD, Brown SL, Falck JR, Arbab AS, Edwards PA, Scicli AG. 9L gliosarcoma cell proliferation and tumor growth in rats are suppressed by HET0016, a selective inhibitor of CYP4A. J Pharmacol Exp Ther. 2005b;317:97–108. doi: 10.1124/jpet.105.097782. [DOI] [PubMed] [Google Scholar]
- Hoelzinger DB, Demuth T, Berens ME. Autocrine factors that sustain glioma invasion and paracrine biology in the brain microenvironment. J Natl Cancer Inst. 2007;99:1583–1593. doi: 10.1093/jnci/djm187. [DOI] [PubMed] [Google Scholar]
- Jain RK, di Tomaso E, Duda DG, Loeffler JS, Sorensen AG, Batchelor TT. Angiogenesis in brain tumours. Nat Rev Neurosci. 2007;8:610–622. doi: 10.1038/nrn2175. [DOI] [PubMed] [Google Scholar]
- Liang CJ, Ives HE, Yang CM, Ma YH. 20-HETE inhibits the proliferation of vascular smooth muscle cells via transforming growth factor-beta. J Lipid Res. 2008;49:66–73. doi: 10.1194/jlr.M700155-JLR200. [DOI] [PubMed] [Google Scholar]
- Malumbres M, Barbacid M. Mammalian cyclin-dependent kinases. Trends Biochem Sci. 2005;30:630–641. doi: 10.1016/j.tibs.2005.09.005. [DOI] [PubMed] [Google Scholar]
- Malumbres M, Sotillo R, Santamaría D, Galán J, Cerezo A, Ortega S, Dubus P, Barbacid M. Mammalian cells cycle without the D-type cyclin-dependent kinases Cdk4 and Cdk6. Cell. 2004;118:493–504. doi: 10.1016/j.cell.2004.08.002. [DOI] [PubMed] [Google Scholar]
- Medhora M, Dhanasekaran A, Gruenloh SK, Dunn LK, Gabrilovich M, Falck JR, Harder DR, Jacobs ER, Pratt PF. Emerging mechanisms for growth and protection of the vasculature by cytochrome P450-derived products of arachidonic acid and other eicosanoids. Prostaglandins Other Lipid Mediat. 2007a;82:19–29. doi: 10.1016/j.prostaglandins.2006.05.025. [DOI] [PubMed] [Google Scholar]
- Medhora M, Dhanasekaran A, Gruenloh SK, Dunn LK, Gabrilovich M, Falck JR, Harder DR, Jacobs ER, Pratt PF. Emerging mechanisms for growth and protection of the vasculature by cytochrome P450-derived products of arachidonic acid and other eicosanoids. Prostaglandins Other Lipid Mediat. 2007b;82:19–29. doi: 10.1016/j.prostaglandins.2006.05.025. [DOI] [PubMed] [Google Scholar]
- Medhora MM, Chen Y, Gruenloh SK, Harland D, Bodiga S, Zielonka J, Gebremedhin D, Gao Y, Falck JR, Anjaiah S, et al. 20-HETE increases superoxide production and activates NADPH oxidase in pulmonary artery endothelial cells. Am J Physiol Lung Cell Mol Physiol. 2008;294:L902–L911. doi: 10.1152/ajplung.00278.2007. [DOI] [PMC free article] [PubMed] [Google Scholar]
- Meloche S, Pouyssegur J. The ERK1/2 mitogen-activated protein kinase pathway as a master regulator of the G1- to S-phase transition. Oncogene. 2007;26:3227–3239. doi: 10.1038/sj.onc.1210414. [DOI] [PubMed] [Google Scholar]
- Metea MR, Newman EA. Glial cells dilate and constrict blood vessels: a mechanism of neurovascular coupling. J Neurosci. 2006;26:2862–2870. doi: 10.1523/JNEUROSCI.4048-05.2006. [DOI] [PMC free article] [PubMed] [Google Scholar]
- Metea MR, Newman EA. Signalling within the neurovascular unit in the mammalian retina. Exp Physiol. 2007;92:635–640. doi: 10.1113/expphysiol.2006.036376. [DOI] [PMC free article] [PubMed] [Google Scholar]
- Nguyen X, Wang MH, Reddy KM, Falck JR, Schwartzman ML. Kinetic profile of the rat CYP4A isoforms: arachidonic acid metabolism and isoform-specific inhibitors. Am J Physiol Regul Integr Comp Physiol. 1999;276:R1691–R1700. doi: 10.1152/ajpregu.1999.276.6.R1691. [DOI] [PubMed] [Google Scholar]
- Nilakantan V, Maenpaa C, Jia G, Roman RJ, Park F. 20-HETE-mediated cytotoxicity and apoptosis in ischemic kidney epithelial cells. Am J Physiol Renal Physiol. 2008;294:F562–F570. doi: 10.1152/ajprenal.00387.2007. [DOI] [PMC free article] [PubMed] [Google Scholar]
- Peddinti R, Zeine R, Luca D, Seshadri R, Chlenski A, Cole K, Pawel B, Salwen HR, Maris JM, Cohn SL. Prominent microvascular proliferation in clinically aggressive neuroblastoma. Clin Cancer Res. 2007;13:3499–3506. doi: 10.1158/1078-0432.CCR-07-0237. [DOI] [PubMed] [Google Scholar]
- Pelicano H, Carney D, Huang P. ROS stress in cancer cells and therapeutic implications. Drug Resist Updat. 2004;7:97–110. doi: 10.1016/j.drup.2004.01.004. [DOI] [PubMed] [Google Scholar]
- Reiners JJ, Jr, Clift R, Mathieu P. Suppression of cell cycle progression by flavonoids: dependence on the aryl hydrocarbon receptor. Carcinogenesis. 1999;20:1561–1566. doi: 10.1093/carcin/20.8.1561. [DOI] [PubMed] [Google Scholar]
- Roman RJ. P-450 metabolites of arachidonic acid in the control of cardiovascular function. Physiol Rev. 2002;82:131–185. doi: 10.1152/physrev.00021.2001. [DOI] [PubMed] [Google Scholar]
- Sacerdoti D, Gatta A, McGiff JC. Role of cytochrome P450-dependent arachidonic acid metabolites in liver physiology and pathophysiology. Prostaglandins Other Lipid Mediat. 2003;72:51–71. doi: 10.1016/s1098-8823(03)00077-7. [DOI] [PubMed] [Google Scholar]
- Sun CW, Falck JR, Harder DR, Roman RJ. Role of tyrosine kinase and PKC in the vasoconstrictor response to 20-HETE in renal arterioles. Hypertension. 1999;33:414–418. doi: 10.1161/01.hyp.33.1.414. [DOI] [PubMed] [Google Scholar]
- Ueda S, Masutani H, Nakamura H, Tanaka T, Ueno M, Yodoi J. Redox control of cell death. Antioxid Redox Signal. 2002;4:405–414. doi: 10.1089/15230860260196209. [DOI] [PubMed] [Google Scholar]
- Yoon S, Seger R. The extracellular signal-regulated kinase: multiple substrates regulate diverse cellular functions. Growth Factors. 2006;24:21–44. doi: 10.1080/02699050500284218. [DOI] [PubMed] [Google Scholar]
- Yu M, Cambj-Sapunar L, Kehl F, Maier KG, Takeuchi K, Miyata N, Ishimoto T, Reddy LM, Falck JR, Gebremedhin D, et al. Effects of a 20-HETE antagonist and agonists on cerebral vascular tone. Eur J Pharmacol. 2004;486:297–306. doi: 10.1016/j.ejphar.2004.01.009. [DOI] [PubMed] [Google Scholar]
- Zhao X, Imig JD. Kidney CYP450 enzymes: biological actions beyond drug metabolism. Curr Drug Metab. 2003;4:73–84. doi: 10.2174/1389200033336892. [DOI] [PubMed] [Google Scholar]