Abstract
The World Health Assembly set targets to detect by 2005 at least 70% of all new sputum smear-positive cases arising each year and to cure at least 85% of these cases. The national tuberculosis (TB) control programmes of 199 countries reported that in 2005, 2.3 million new smear-positive cases were diagnosed under WHO’s DOTS strategy, out of an estimated 3.9 million (95% confidence limit (CL) 3.4 million to 4.4 million) new smear-positive cases arising in that year, a global case detection rate of 60% (95% CL 52% to 69%). Of 2.1 million new smear-positive patients registered for treatment in 2004, 84% had successful outcomes. Of the regions, only the WHO Western Pacific Region reached both targets, with case detection and treatment success rates of 76% and 91%, respectively; South-East Asia reached the treatment success target with a rate of 87%. In relation to countries, WHO estimates that 67 achieved the target detection rates and 57 achieved the target for treatment success, with 26 – including high-burden countries China, the Philippines and Viet Nam – achieving both targets. DOTS programmes diagnosed more than 26 million patients (all forms of TB) in 1995–2005. Building on this success, the Global Plan to Stop TB 2006–2015, describes the actions needed to implement WHO’s new Stop TB Strategy over the coming decade to reduce TB incidence, prevalence and deaths in line with the Millennium Development Goals.
Résumé
L’Assemblée mondiale de la Santé a fixé comme objectifs de détecter d’ici 2005 au moins 70% de l’ensemble des nouveaux cas de tuberculose à frottis positif survenant chaque année et de guérir au moins 85% de ces cas. Les programmes nationaux de lutte antituberculeuse de 199 pays ont rapporté qu’en 2005, 2,3 millions de nouveaux cas de tuberculose (TB) à frottis positif avaient été diagnostiqués dans le cadre de la stratégie DOTS de l’OMS, sur un nombre total de nouveaux cas à frottis positif apparus au cours de cette année, estimé à 3,9 millions [intervalle de confiance à 95% (IC) = 3,4-4,4 millions], soit un taux de détection global de 60% (IC à 95% = 52 – 69%). Sur les 2,1 millions de nouveaux patients à frottis positif dont le placement sous traitement a été enregistré en 2004, 84% ont été traités avec succès. Parmi les régions de l’OMS, seule celle du Pacifique occidental a atteint les deux objectifs, avec des taux de détection et de succès du traitement des cas de 76 et 91% respectivement et l’Asie du Sud-est a réalisé l’objectif en matière de traitement avec un taux de guérison de 87%. Si l’on considère la situation par pays, l’OMS estime que 67 ont atteint l’objectif en matière de taux de détection, 57 l’objectif en matière de guérison et 26 les deux objectifs, y compris des pays fortement touchés par la TB comme la Chine, les Philippines et le Viet Nam. Les programmes DOTS ont diagnostiqué plus de 26 millions de cas (toutes formes de TB confondues) sur la période 1995-2005. En s’appuyant sur ces résultats, le Plan mondial Halte à la tuberculose (2006-2015) présente les mesures nécessaires à la mise en œuvre de la nouvelle stratégie Halte à la TB de l’OMS sur la décennie à venir en vue de réduire l’incidence de la TB, sa prévalence et le nombre de décès imputables à cette maladie conformément aux objectifs du Millénaire pour le développement.
Resumen
La Asamblea Mundial de la Salud estableció para 2005 la meta de detectar al menos un 70% de todos los casos bacilíferos nuevos de tuberculosis que se produjeran cada año, y curar al menos el 85% de esos casos. Los programas nacionales de control de la tuberculosis de 199 países notificaron que en 2005 se diagnosticaron 2,3 millones de nuevos casos bacilíferos en el marco de la estrategia DOTS de la OMS, del total de 3,9 millones (intervalo de confianza (IC) del 95%: 3,4 - 4,4 millones) de casos bacilíferos nuevos que se estima que se produjeron ese año, lo que supone una tasa de detección del 60% (IC95%: 52%-69%). De los 2,1 millones de nuevos pacientes bacilíferos registrados para recibir tratamiento en 2004, el 84% evolucionaron satisfactoriamente. Entre las regiones, sólo la Región del Pacífico Occidental de la OMS alcanzó las dos metas, con tasas de detección de casos y de éxito terapéutico del 76% y el 91%, respectivamente; Asia Sudoriental alcanzó la meta de tratamientos satisfactorios con una tasa del 87%. En lo que respecta a los países, la OMS estima que 67 alcanzaron las tasas de detección perseguidas, y 57 la meta de resultados satisfactorios; 26 de ellos -incluidos países que presentan una alta carga, como China, Filipinas y Viet Nam- lograron las dos metas. Los programas basados en el DOTS diagnosticaron a más de 26 millones de pacientes (todas las formas de tuberculosis) en 1995-2005. Basándose en ese éxito, el Plan Mundial para Detener la Tuberculosis 2006-2015 describe las medidas necesarias para implementar la nueva Eestrategia de la OMS Alto a la Tuberculosis durante la próxima década a fin de reducir la incidencia y la prevalencia de tuberculosis y la mortalidad por esa causa en la línea de los Objetivos de Desarrollo del Milenio.
ملخص
أقرت جمعية الصحة العالمية ەدفَيْن ەما كشف 70% على الأقل من حالات السل الجديدة ذات اللطاخة الإيجابية كل عام، وشفاء ما يزيد على 85% من ەذە الحالات. وقد أبلغت البرامج الوطنية لمكافحة السل في 199 بلداً عام 2005 عن 2.3 مليون حالة جديدة إيجابية اللطاخة شُخِّصَتْ وفقاً لاستـراتيجية منظمة الصحة العالمية للمعالجة القصيرة الأمد تحت الإشراف المباشر، من أصل 3.9 مليون حالة جديدة قُدِّر أنەا ظەرت في ذلك العام، (بحدود ثقة 95% إذ تراوح التقدير بين 3.4 و4.4 مليون حالة)، وقد بلغ المعدَّل العالمي لكشف الحالات 60% (بحدود ثقة 95% إذ تـراوح ذلك المعدل بين 52% و69%). ومن بين 2.1 مليون حالة إيجابية اللطاخة سُجِّلَتْ عام 2004، كانت المعالجة ناجحة في 84%. أما بالنسبة للأقاليم، فإن إقليم غرب المحيط الەادئ ەو الإقليم الوحيد الذي حقَّق الەدفَيْن معاً؛ إذ بلغ معدل كشف الحالات 76% ومعدل نجاح المعالجة 91%. فيما حقَّق إقليم جنوب شرق آسيا ەدف المعالجة الناجحة فوصل معدلەا إلى 87%. أما بالنسبة للبلدان فإن منظمة الصحة العالمية تقدر أن 67 بلداً قد حقَّق ەدف معدل كشف الحالات، فيما حقَّق 57 بلداً ەدف النجاح في المعالجة؛ بينما حقَّق 26 بلداً، ومنەم البلدان التي ترزح تحت عبء ثقيل من السل، وەي الصين والفيليبين وفيي تنام، الەدفين معاً. وقد شَخَّصَتْ برامج المعالجة القصيرة الأمد تحت الإشراف المباشر أكثر من 26 مليون مريض (من جميع أشكال السل) في الفتـرة بين 1995 و2005. وبناءً على ەذا النجاح، فإن الخطة العالمية لدحر السل (2006-2015) تصف الأنشطة التي ينبغي تنفيذەا وفق الخطة الجديدة لمنظمة الصحة العالمية لدحر السل في العقد القادم لخفض معدلات الحدوث والانتشار والوفيات بشكل يتماشى مع الأەداف الإنمائية للألفية.
Introduction
Faced with the enormity of the global tuberculosis epidemic, and knowing that cost-effective methods for control were already available,1–3 delegates to the WHO’s 1991 World Health Assembly (WHA) set two targets for national tuberculosis (TB) control programmes, to be reached by year 2000. These targets were to detect at least 70% of all new sputum smear-positive cases arising each year and to cure at least 85% of them.4 Individual countries have adopted these global targets as national targets.
During the early 1990s, the essential, basic methods for TB diagnosis and treatment were integrated into WHO’s DOTS strategy. DOTS became the internationally recommended approach to TB control,5 and is now embraced by the Stop TB Strategy.6
High cure rates are a prerequisite for expanding case finding; this is the situation for TB, where standard short-course drug regimens can cure more than 90% of new drug-susceptible cases of the disease. At 70% case detection, 85% cure and no co-infection with HIV, incidence should fall at around 5–10% per year, and prevalence more quickly.7–9 However, an increase in factors such as HIV co-infection, diabetes and crowding in urban slums could reduce the rate of decline in many of the world’s high-burden countries.
In spite of implementation of DOTS programmes during the 1990s, the global targets were not met by 2000, and the target year was deferred to 2005.10–12 This review assesses whether national TB control programmes (NTPs) met the 2005 targets.
Methods
WHO has compiled TB case notifications from DOTS and non-DOTS programmes for up to 200 countries and territories for the years 1980 to 2005 (the number of countries reporting varies from year to year). The principal measure of case detection for each country is the number of new patients with sputum smear-positive pulmonary TB reported by the DOTS programme in one year, divided by the estimated incidence of new smear-positive cases in that year. TB incidence rates are rarely measured directly in longitudinal studies; therefore, incidence is estimated from population-based, cross-sectional surveys of the prevalence of Mycobacterium tuberculosis infection or TB disease, or from independent assessments (often qualitative) of the performance of surveillance systems.13,14 The essential formulae for calculating incidence are:
The available data differ from country to country, and not all methods can be applied in every country; in particular, the method based on the Stýblo coefficient is probably no longer generally applicable.15
Among all new HIV-negative TB patients, 45% are assumed to be smear-positive (distributed uniformly over the range 40–50% in uncertainty analysis). Among HIV-positive TB patients, the fraction is smaller (35%, range 30–40%). Because most NTPs do not routinely test TB patients for HIV infection, we have used for all countries an indirect estimate of the prevalence of HIV among new TB patients, calculated as follows:
where pHIV is HIV prevalence in the adult population (15–49 years), and IRR is the incidence rate ratio (i.e. the TB incidence rate in HIV-infected adults divided by the TB incidence rate in HIV-uninfected adults). IRR has values of 30 (range 21–39, with a triangular distribution in uncertainty analysis; point estimate revised from an initial estimate of 60)14 for industrialized countries and 6.0 (range 3.5–8.0) for all other countries.13,14,16
For countries where the detection of all TB cases (but not necessarily smear-positive cases) is thought to have been steady through time, the trend in case notifications is assumed to represent the trend in incidence. Most other countries are assumed to follow the trend for their own geographical region (one of 9 different epidemiological regions), which is determined by the collection of countries that have provided interpretable data for that region.16 Errors (95% confidence limits, CL) on the point estimates of incidence for high-burden countries in 2005 were derived by multivariate uncertainty analysis.13
Since 1994, WHO has received treatment results for new smear-positive patients registered in DOTS cohorts. Treatment success under DOTS is defined as the percentage of new smear-positive patients registered in an annual cohort that are cured (negative sputum smear at the end of treatment), plus the percentage that completed treatment. The other defined outcomes of treatment are: died, defaulted, failed (positive sputum smear at the end of treatment), transferred (outcome unknown after transfer to another treatment centre) or not evaluated (no outcome reported). Case definitions, methods for estimating incidence and the classification of treatment outcomes used by WHO are further described elsewhere.13,14,17,18
Results
Case detection
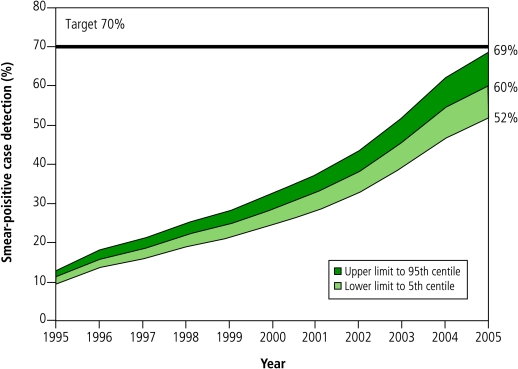
We estimate that there were 8.8 million (95%CL 7.6–10.0 million) new TB cases in 2005, with 3.9 (95%CL 3.4–4.4) million smear-positive.13,16 DOTS programmes worldwide reported 4 923 555 new and relapse cases, among which 2 340 214 were new smear-positive. This gives a new smear-positive case detection rate of 60% (95%CL 52–69%) for 2005.16 At 53%, the estimated detection rate of all new cases (excluding relapses) by DOTS programmes in 2005 was a little lower than for new smear-positive cases.
The best estimate of smear-positive case detection under DOTS was 10% below target, although there is a 0.7% chance that the true value of the detection rate was above the 70% target. The estimated global case detection rate by DOTS programmes increased almost linearly from 11% in 1995 to 28% in 2000, but has since accelerated (Fig. 1). Over the 11 years 1994–2005, a total of 26.5 million TB patients (all forms) were diagnosed and reported under DOTS.
Fig. 1.
New smear-positive case detection in DOTS programmes globally, 1995–2005a
a Shading represents uncertainty around the annual point estimates towards upper (dark) and lower (light) 95% confidence limits.
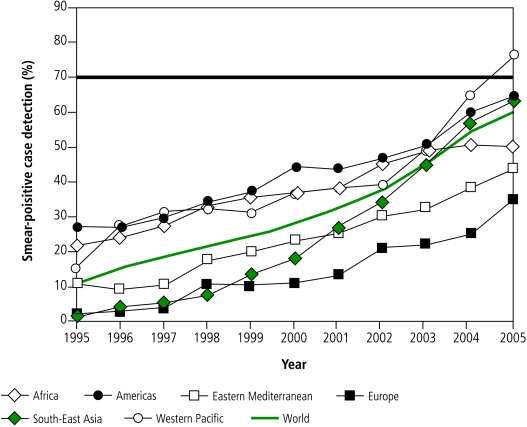
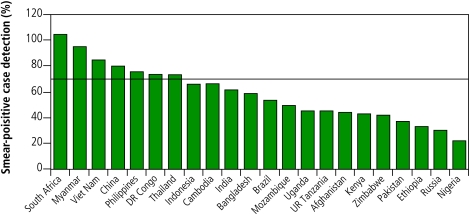
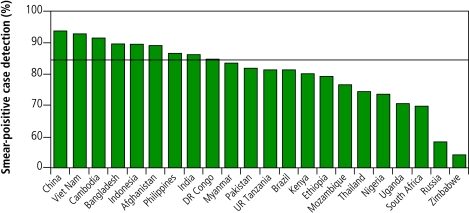
The global acceleration in case detection has been driven principally by South-East Asia (mostly India) since 2000, supported by the Western Pacific Region (mostly China) since 2002. However, only 7 of the 22 high-burden countries,18 67 countries in total, and one WHO region (Western Pacific), reached the 70% target by 2005 (Fig. 2, Fig. 3).
Fig. 2.
New smear-positive case detection in DOTS programmes for the six WHO regions, 1995–2005a
a The horizontal line shows the 70% target.
Fig. 3.
Case detection for new sputum smear-positives under DOTS in 22 high-burden countriesa
a Case detection is for patients reported during 2005. The horizontal line shows the 70% target.
Treatment success
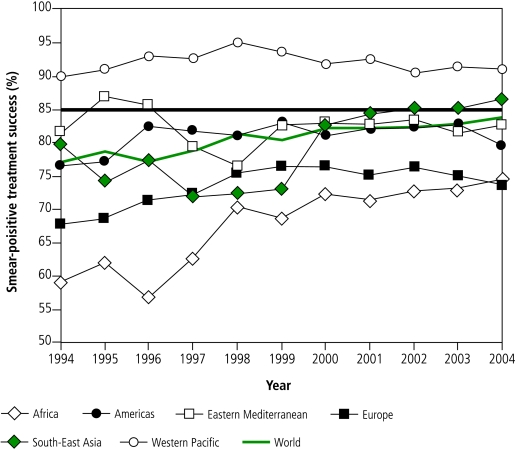
Of 2 103 878 new smear-positive patients registered for treatment under DOTS in 2004, 1 763 653 (84%) were successfully treated, just short of the 85% target. The global treatment success rate under DOTS has been high since the first observed cohort in 1994 (77%), and has remained above 80% since 1998 (Fig. 5).
Fig. 5.
Treatment success under DOTS for new smear-positive patients registered 1994–2004, in the six WHO regionsa
a The horizontal line shows the 85% target.
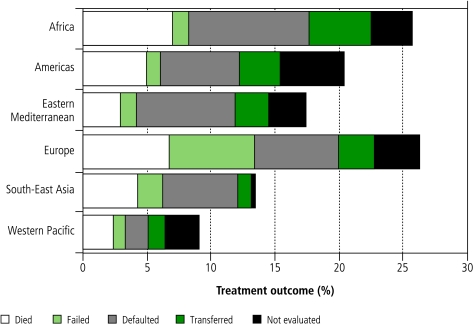
In 2004, the 85% target was reached by 57 countries in total, by 9 of the 22 high-burden countries, and by 2 WHO regions (South-East Asia, Western Pacific; Fig. 4, Fig. 5). Four regions did not meet the target, for reasons such as high rates of death (Africa, Europe) and treatment failure (Europe), and unknown outcomes through default, transfer or lack of evaluation (Africa, Americas, Eastern Mediterranean, Europe) (Fig. 6).
Fig. 4.
Treatment success for new sputum smear-positives under DOTS in 22 high-burden countriesa
a Treatment success is for the cohort of patients registered in 2004. The horizontal line shows the 85% target.
Fig. 6.
Unfavourable treatment outcomes in the six WHO regions, for new smear-positive patients registered in 2004 and evaluated by the end of 2005
Conclusion
The world’s national TB control programmes narrowly failed to meet the 2005 targets for case detection and treatment success. However, the targets were apparently reached in 26 countries — including the high-burden countries China, the Philippines and Viet Nam — and in the Western Pacific Region as a whole.
The estimated detection rate of all new TB cases by DOTS programmes in 2005 (53%) was in a range similar to that for smear-positives (60%). This suggests that DOTS programmes do diagnose and report on patients with smear-negative TB, despite their emphasis on smear-positive cases. Smear-negative patients could, however, be disfavoured under DOTS in some settings; for example, where there is a high level of co-infection with HIV. WHO has recently issued guidelines on the diagnosis of smear-negative disease for use particularly in poor countries with high rates of HIV infection.19
The point estimate of new smear-positive case detection was 60%. The uncertainty surrounding incidence estimates provides a small chance that the true value was higher than 70%, but this is unlikely given that many patients are not found by passive case detection under DOTS.20–22 Nonetheless, TB burden and trends have not been accurately measured in many countries; for example, in eastern and southern African countries, it is not clear whether increases in case notifications reflect higher case detection rates or a real increase in incidence linked to the spread of HIV. We suggest that new methods for evaluating case detection and incidence are needed, based principally on assessments of the quality of surveillance systems, backed by data obtained from surveys of the prevalence of infection or active disease.
DOTS programmes generally report consistently high treatment success rates, because they mostly follow recommended procedures for treating patients and evaluating outcomes. However, cure rates may be overestimated in some settings (underestimation is less likely given that health workers are responding to performance targets). Few studies have provided direct explanations for the poor treatment outcomes under DOTS that have been reported from some countries and regions. However, the coincidences between treatment failure and drug resistance in Europe, and between death and HIV infection in Africa, present obvious explanations that need to be more thoroughly evaluated. Assessment of treatment outcomes for patients with smear-negative TB is increasingly important, in particular because smear-negative pulmonary disease tends to be more common in TB patients who are also infected with HIV. This paper refers only to patients treated under DOTS; there is little information about the fate of patients treated outside these programmes. In sum, high rates of case detection are needed under DOTS and the Stop TB Strategy of both smear-positive and smear-negative TB patients, to ensure that the majority of patients get the right treatment and are cured.
The goal of treating 50 million TB patients under DOTS between 2006 and 2015 is entirely feasible based on the progress reported above;23 but its epidemiological impact is less certain. Mathematical modelling indicates that TB prevalence and death rates can be halved globally by 2015 (compared with 1990 estimates), as proposed in the Millennium Development Goals.23 However, results will differ among regions, with countries in the WHO South-East Asia and Western Pacific Regions more likely to achieve this reduction than the African and former Soviet countries most affected by HIV, drug resistance and weak health systems.16 Although such projections may help to guide investments in TB control, the real impact of control measures must be assessed by measurement. Accurate measurement of both the implementation and epidemiological impact of TB control activities is one of the major challenges of the coming decade. ■
Competing interests
None declared.
References
- 1.World Bank. World development report 1993: investing in health New York: Oxford University Press; 1993. [Google Scholar]
- 2.Jamison DT, Breman JG, Measham AR, Alleyne G, Claeson M, Evans D, et al. Disease control priorities in developing countries New York: Oxford University Press for the World Bank; 1993. [PubMed] [Google Scholar]
- 3.Barnum HN. Cost savings from alternative treatments for tuberculosis. Soc Sci Med. 1986;23:847–50. doi: 10.1016/0277-9536(86)90212-1. [DOI] [PubMed] [Google Scholar]
- 4.Forty-fourth World Health Assembly. resolutions and decisions. Resolution WHA 44.8 Geneva: WHO; 1991. [Google Scholar]
- 5.An expanded framework for effective tuberculosis control. Int J Tuberc Lung Dis. 2002;6:378–88. [PubMed] [Google Scholar]
- 6.Raviglione MC, Uplekar MW. WHO’s new Stop TB Strategy. Lancet. 2006;367:952–5. doi: 10.1016/S0140-6736(06)68392-X. [DOI] [PubMed] [Google Scholar]
- 7.Dye C, Garnett GP, Sleeman K, Williams BG. Prospects for worldwide tuberculosis control under the WHO DOTS strategy. Lancet. 1998;352:1886–91. doi: 10.1016/S0140-6736(98)03199-7. [DOI] [PubMed] [Google Scholar]
- 8.Borgdorff MW, Floyd K, Broekmans JF. Interventions to reduce tuberculosis mortality and transmission in low- and middle-income countries. Bull World Health Organ. 2002;80:217–27. [PMC free article] [PubMed] [Google Scholar]
- 9.Stýblo K, Bumgarner JR. Tuberculosis can be controlled with existing technologies: evidence. Tuberculosis Surveillance Research Unit progress reports Paris: Tuberculosis Surveillance Research Unit, International Union Against Tuberculosis and Lung Disease; 1991, pp. 60–72. [Google Scholar]
- 10.Fifty-third World Health Assembly. Resolutions and decisions. Resolution WHA 53.1 Geneva: WHO; 2000. [Google Scholar]
- 11.United Nations Statistics Division. Millennium indicators database New York: United Nations; 2004. http://mdgs.un.org/unsd/mdg/Default.aspx
- 12.Dye C, Maher D, Weil D, Espinal M, Raviglione M. Targets for global tuberculosis control. Int J Tuberc Lung Dis. 2006;10:460–2. [PubMed] [Google Scholar]
- 13.Dye C, Scheele S, Dolin P, Pathania V, Raviglione MC. Global burden of tuberculosis: estimated incidence, prevalence, and mortality by country. JAMA. 1999;282:677–86. doi: 10.1001/jama.282.7.677. [DOI] [PubMed] [Google Scholar]
- 14.Corbett EL, Watt CJ, Walker N, Maher D, Williams BG, Raviglione MC. The growing burden of tuberculosis: global trends and interactions with the HIV epidemic. Arch Intern Med. 2003;163:1009–21. doi: 10.1001/archinte.163.9.1009. [DOI] [PubMed] [Google Scholar]
- 15.Measuring progress in TB control — recommendations of a WHO task force, 15–16 June 2006 Geneva: WHO; 2006.
- 16.Global tuberculosis control: Surveillance, planning, financing Geneva: WHO; 2007.
- 17.Revised international definitions in tuberculosis control. Int J Tuberc Lung Dis. 2001;5:213–5. [PubMed] [Google Scholar]
- 18.Global tuberculosis control: Surveillance, planning, financing Geneva: WHO; 2007.
- 19.Improving the diagnosis and treatment of smear-negative pulmonary and extrapulmonary tuberculosis among adults and adolescents. Recommendations for HIV-prevalent and resource-constrained settings Geneva: WHO; 2007.
- 20.China Tuberculosis Control Collaboration The effect of tuberculosis control in China. Lancet. 2004;364:417–22. doi: 10.1016/S0140-6736(04)16764-0. [DOI] [PubMed] [Google Scholar]
- 21.Becerra MC, Pachao-Torreblanca IF, Bayona J, Celi R, Shin SS, Kim JY, et al. Expanding tuberculosis case detection by screening household contacts. Public Health Rep. 2005;120:271–7. doi: 10.1177/003335490512000309. [DOI] [PMC free article] [PubMed] [Google Scholar]
- 22.Dewan PK, Lal SS, Lonnroth K, Wares F, Uplekar M, Sahu S, et al. Improving tuberculosis control through public-private collaboration in India: literature review. BMJ. 2006;332:574–8. doi: 10.1136/bmj.38738.473252.7C. [DOI] [PMC free article] [PubMed] [Google Scholar]
- 23.The Global Plan to Stop TB. 2006–2015 Geneva: WHO Stop TB Partnership; 2006. [Google Scholar]


