

Abstract
Stem cell antigen-1 (Sca-1, Ly6A/E) is a glycosylphosphotidylinositol-anchored protein that identifies many tissue progenitor cells. We originally identified Sca-1 as a marker of myogenic precursor cells and subsequently demonstrated that Sca-1 regulates proliferation of activated myoblasts, suggesting an important role for Sca-1 in skeletal muscle homeostasis. Beyond its functional role in regulating proliferation, however, little is known about the mechanism(s) that drive Sca-1-mediated events. We now report that lipid microdomain organization is essential for normal myogenic differentiation, and that Sca-1 constitutively localizes to these domains during myoblast proliferation and differentiation. We also demonstrate that Sca-1 associates with insulin degrading enzyme (IDE), a catalytic protein responsible for the cleavage of mitogenic peptides, in differentiating myoblasts. We show that chemical inhibition of IDE as well as RNAi knockdown of IDE mRNA recapitulates the phenotype of Sca-1 interference, that is, sustained myoblast proliferation and delayed myogenic differentiation. These findings identify the first signaling protein that physically and functionally associates with Sca-1 in myogenic precursor cells, and suggest a potential pathway for Sca-1-mediated signaling. Future efforts to manipulate this pathway may lead to new strategies for augmenting the myogenic proliferative response, and ultimately muscle repair.
Stem cell antigen-1 (Sca-1, Ly6A/E) is a glycosylphosphotidylinositol (GPI)-anchored protein that identifies many tissue progenitor cells with self-renewal capacity (Holmes and Stanford, 2007). We originally identified Sca-1 as a marker of myogenic precursor cells undergoing cell cycle withdrawal during differentiation (Shen et al., 2003). We subsequently demonstrated both in vitro and in vivo that Sca-1 regulates proliferation of activated muscle precursor cells (Epting et al., 2004, 2008), suggesting an important role for Sca-1 in tissue homeostasis as well as a potential function in maintenance of the muscle stem cell pool. Beyond its functional role in regulating proliferation, however, little is known about how Sca-1 may be regulated in myogenic precursor cells, or how its signaling input is translated into cellular activities. Other GPI-anchored proteins (GPI-APs) have been shown to localize within lipid microdomains in the plasma membrane (Kenworthy et al., 2000), and to couple with non-receptor tyrosine kinases (Stefanova et al., 1991; Clissold, 1994). More specifically, it has been suggested that Sca-1 might associate with the lipid microdomain fraction in lymphocytes (Bohuslav et al., 1993). Such lipid microdomains are believed to facilitate coalescence of surface, transmembrane, and intracellular proteins in the assembly of intracellular signaling complexes (Hoessli et al., 2000). Demonstrating a lipid microdomain association of Sca-1, therefore, should reveal potential transmembrane signaling partners and mechanisms for this historically enigmatic molecule. Whether Sca-1 sorts to this membrane compartment in myogenic precursors, how this may play a regulatory role in its function, and the identity of associated proteins that may serve as secondary messengers in Sca-1-mediated signaling pathways have not previously been addressed.
We now report that lipid microdomain organization is essential for normal myogenic differentiation, that Sca-1 associates with these domains in myogenic precursor cells, and that although Sca-1 regulates myoblast proliferation through its temporally regulated expression (Epting et al., 2004), its spatial localization to lipid microdomains is static, suggesting that migration between lipid microdomains and non-lipid microdomain regions of the plasma membrane does not regulate its function. In the absence of regulation through spatial reorganization, we sought to identify binding partners through which Sca-1 signaling might be regulated. We demonstrate that Sca-1 associates with insulin degrading enzyme (IDE), a catalytic protein responsible for the cleavage of mitogenic peptides (Duckworth et al., 1998), in differentiating myoblasts. We hypothesized that IDE might participate in signaling pathways downstream of Sca-1, and indeed found that inhibition of IDE recapitulates the phenotype of Sca-1 interference, that is, sustained myoblast proliferation and delayed myogenic differentiation (Epting et al., 2004, 2008). These findings identify the first signaling protein that physically and functionally associates with Sca-1 in myogenic precursor cells, and suggest that IDE participates in Sca-1-mediated signaling events.
Materials and Methods
Cell culture
C2C12 myoblasts (American Type Culture Collections) were maintained and differentiated in culture as previously described (Shen et al., 2003; Epting et al., 2004). Briefly, proliferating cells were passaged at subconfluent density and maintained in DMEM supplemented with 10% Fetal Bovine Serum (Omega Scientific, Tarzana, CA). Differentiation was induced at 70–80% confluence by transfer to DMEM containing 2% Horse Serum (Invitrogen, Carlsbad, CA). For cholesterol scavenging, 2 mM methyl-β-cyclodextrin (MβCD; Sigma, St. Louis, MO) was added to cells daily with media changes during differentiation. Phase images were obtained using a Nikon Eclipse 3000 microscope with 10–20× DM phase objectives and an RT-Slider SPOT (Diagnostic Instruments, Sterling Heights, MI) or Retiga 2000R (Q Imaging, Surrey, British Columbia, Canada) digital camera, and were processed using MetaMorph software (Molecular Devices, Sunnyvale, CA).
Confocal immunofluorescence and GM1 ganglioside staining
C2C12 cells were grown and differentiated on gelatin-coated coverslips in multi-well plates. Cells were washed at indicated time points in cold phosphate-buffered saline (PBS), labeled live with 0.5 μg/ml FITC-conjugated cholera toxin subunit B (CTXB) (Sigma) in 1% bovine serum albumin (BSA) in PBS, then washed and fixed in 4% paraformaldehyde (PFA) prior to staining with other antibodies. After fixation, cells were washed with PBS, blocked in 3% BSA in PBS with 1% species-specific secondary antisera, incubated with 1 μg/ml rat anti-mouse Sca-1 (BD Pharmingen, San Jose, CA) at or 2.5 μg/ml mouse anti-human transferrin receptor (Zymed, South San Francisco, CA), washed with PBS, then stained with AlexaFluor 594-conjugated rabbit anti-rat (Molecular Probes, Carlsbad, CA) or FITC-conjugated goat anti-mouse (Jackson Immuno Research, West Grove, PA). Cover slips were mounted with Prolong (Molecular Probes) and imaged using a Leica TS2 under oil with an Apo 63× objective. Individual 0.08 μm slices and maximum intensity projections were collected and analyzed using Imaris software (BitPlane, St. Paul, MN).
Proliferation and myoblast fusion indices
After 120 h of differentiation, cells were washed in PBS, fixed in 4% PFA in PBS, washed with PBS, permeabilized in cold 90% methanol, blocked in PBS containing 3% BSA and 1% goat serum, stained with mouse anti-human Ki67 (BD Pharmingen) or mouse anti-myosin heavy chain antibody (MF20; Developmental Studies Hybridoma Bank) at 1:500, washed with 1% BSA in PBS with 0.01% Triton X-100, then incubated with AlexaFluor594-conjugated goat anti-mouse at 1:500 (Molecular Probes). Nuclei were stained with 4′,6-diamidino-2-phenylindole (DAPI). Images were acquired on a Nikon Eclipse 3000 with a 20× Plan Fluor objective. Ki67+ and DAPI+ nuclei were scored using Image J software (NIH). Proliferation was assayed as a measure of percent Ki67+ nuclei, that is, by counting the number of Ki67+ cells/total DAPI+ nuclei per 20× field for ≥10 fields. The myoblast fusion index (MFI) was calculated as the number of nuclei in myosin expressing myocytes with ≥2 nuclei/total number of nuclei, as previously described (Epting et al., 2004).
Sucrose density gradient separation
Cells were washed in cold PBS, scraped into 50 mM Tris pH 7.4, 150 mM NaCl, collected at 350g, lysed in 50 mM Tris pH 7.4, 150 mM NaCl with 1% Triton X-100 and 1:50 Complete Protease Inhibitors (CPI) solution (Roche, Indianapolis, IN), dounce homogenized, and precleared at 7,000g. One milligram of total protein, as measured by BCA assay (Pierce, Rockford, IL), in 1 ml 50 mM Tris pH 7.4, 150 mM NaCl, 1% Triton X-100, 1:50 CPI was mixed with an equal volume of 80% sucrose in 10 mM Tris, pH 7.4, and loaded onto a discontinuous sucrose density column consisting of 6 ml at 36%, 3 ml at 20% and 2 ml at 5% in 10 mM Tris pH 7.4. Lipid fractions were separated at ~100,000g using a SW40Ti rotor (Beckman, Fullerton, CA) for 16–18 h. Fractions (500 μl) were removed by gravity. Seventy-five microliters from each fraction was reserved for GM1 ganglioside detection, and the remainder was precipitated with 10% trichloroacetic acid.
Immunoblot analysis
Precipitated fractions were separated on sodium dodecyl sulfate (SDS)–polyacrylamide gels (6–13%) under non-reducing conditions (Sca-1), or reducing conditions (other antigens), then transferred in Tris-glycine, 20% methanol, 0.01% SDS onto nitrocellulose (0.4 μm; HyBond). Membranes were blocked with 7% non-fat dried milk in PBS, incubated with primary antibody in 10 mM Tris–Cl, pH 8, 150 mM NaCl, 0.05% Tween-20 (TNT) with 1% BSA, then HRP-linked secondary antibody (BioRad, Hercules, CA) at 1:5,000–1:20,000 in TNT with 1% BSA. Primary antibodies included rat anti-mouse Sca-1, mouse anti-flotillin-1 (clone 18) (Rajendran et al., 2003), mouse anti-rat caveolin-3 (clone 26) (Tang et al., 1996; Smythe et al., 2003), all from BD Pharmingen; rabbit anti-IDE (Calbiochem, San Diego, CA); and mouse anti-human transferrin receptor (Zymed) (Nichols, 2003). GM1 ganglioside was detected by slot blot analysis on nitrocellulose. Fractioned aliquots were applied to membrane, washed in PBS, blocked in 3% BSA in PBS, labeled with 0.75 μg/ml FITC-CXTB, then washed and imaged on a Storm Phosphorimager (Molecular Dynamics, Piscataway, NJ).
Sca-1 immunoprecipitation
4 × 10⁶ C2C12 myoblasts were grown under differentiation conditions for 24 h and lysed in 50 mM Tris pH 7.5, 150 mM NaCl, 1% Triton X-100, 5% glycerol, 1:50 CPI, which contained only non-ionic detergents to preserve protein-protein interactions (Zhang et al., 2003). Samples were cleared of insoluble material at 16,000g, then lysates were pre-cleared with 50% γ-bind Sepharose (Pierce) and incubated with 4 μg normal rat IgG (Santa Cruz, Biotechnology, Santa Cruz, CA) or 3 μg anti-Sca-1, followed by 40 μl γ-bind Sepharose. Complexes were washed with 25 mM Tris pH 7.5, 100 mM NaCl, 0.5% Triton X-100, 5% glycerol, and bound protein released by incubating at 95°C in 50 mM Tris–Cl, pH 6.8, 2% SDS, 0.1% bromophenol blue, 10% glycerol, 100 mM dithiothreitol. Samples were resolved on a large-slab 9% polyacrylamide–SDS gel and protein bands detected by staining with Coomassie Brilliant Blue. Sca-1-associated bands were excised, digested in-gel with trypsin, and analyzed by nanoflow liquid chromatography coupled with electrospray ionization (LC–MS/MS) on a Micromass QT of I equipped with an LC Packings nanoflow LC (Jensen et al., 1999). Experimental data from each peptide was searched against the predicted fragment ions for all available peptides using Mascot (http://www.matrixscience.com/search_form_select.html).
GST-Sca-1 pull-down assay
Truncated Sca-1 (amino acids 27–104 of Ly6A; NM_010738) was cloned into pETGEXCT (gift of A.D. Sharrocks, Univ. of Manchester, England (Sharrocks, 1994)) by PCR amplification from the Ly6A cDNA in pUC19 (gift of A. Bothwell (Su et al., 1991)) using primers 5′-GCCATGGGACTGGAGTGTTACCAGTGCTATGG-3′ and 5′-GAGCTCTCCTCCATTGCAGAGGTCTTCCTGGC-3′. The truncation was designed to avoid post-translational ER processing and retention by removal of the cleaved N-terminal region containing the ER leucine zipper recognition and retention sequence to permit cytosolic retention of the GST-Sca-1 fusion protein (Dalley and Bulleid, 2003). The C-terminal truncation was made at the point of predicted cleavage for post-translational addition of the GPI-lipid anchor (Spurway et al., 2001). Thus, the naturally occurring final Sca-1 protein expressed on the cell surface (amino acids 27–104 of the translated protein) was fused to the N-terminus of GST instead of a GPI-anchor.
GST-Sca-1 was expressed in E. coli strain BL21 (Stratagene, La Jolla, CA) according to the manufacturer’s instructions. Protein expression was induced with 1 mM isopropyl β-D-1-thiogalactopyranoside (Sigma) and purified from 250 ml bacterial cultures by lysis in PBS containing 1% Triton X-100 and 1:50 CPI, sonication, and preclearing at 10,000g. Supernatants were mixed with glutathione-Sepharose (Amersham, Piscataway, NJ), washed with PBS containing 0.1% Triton X-100, then PBS, and protein eluted with 50 mM Tris pH 7.5, 100 mM NaCl, 20 mM reduced glutathione. Fractions were dialyzed overnight against 25 mM HEPES, pH 7, 10% glycerol, 100 mM NaCl, 1 mM DTT, and GST-Sca-1 protein concentrations were determined by DC Protein Assay (BioRad).
For pull-down assays, 4 × 10⁶ C2C12 cells were washed in 50 mM Tris pH 7.4, 150 mM NaCl, 5% glycerol and lysed in 50 mM Tris pH 7.4, 1% Triton X-100, 150 mM NaCl, 5% glycerol, 1:50 CPI on ice. Cell lysates were pre-cleared at 16,000g. Two micrograms of purified GST or GST-Sca-1 were added to each sample, followed by 30 μl of 50% glutathione-Sepharose. Beads were washed in 25 mM Tris pH 7.4, 0.5% Triton X-100, 100 mM NaCl, 5% glycerol, and GST- or GST-Sca-1-associated proteins were eluted by incubation in 50 mM Tris–Cl, pH 6.8, 2% SDS, 0.1% bromophenol blue, 10% glycerol, 100 mM dithiothreitol at 95°C. Samples were separated by SDS–polyacrylamide gel electrophoresis and transferred to nitrocellulose as described above. Immunoblot for IDE was accomplished using polyclonal rabbit anti-IDE antibody that was pre-cleared with 50% GST-glutathione resin.
Chemical and RNAi-mediated inhibition of IDE
For chemical inhibition, cells were treated with 0.1 mM 1,10 phenanthroline (1,10-PA; Sigma) or an equal volume of DMSO (vehicle) for 2 h then switched to differentiation conditions. At Day 5 of differentiation, cells were fixed and immunostained for Ki67, myosin heavy chain, and DAPI as described above. RNA inhibition was accomplished by transfection of cells with the following synthetic oligonucleotides (Dharmacon, Lafayette, CO): Cyclophilin B (positive control) 5′-GGAAAGACUGUUCCAAAAA-3′; CONTROL Non-Targeting siRNA Pool (5-AUGAACGUGAAUUGCUCAA-3′, 5′-UAAGGCUAUGAAGAGAUAC-3′, 5′-AUGUAUUGGCCUGUAUUAG-3′, 5′-UAGCGACUAAACAAUCAA-3′), and 4 pooled IDE-specific siRNA duplexes (J-040080-09 through 12) (5′-CGUCCAAUCUGAUGGCGAUUU-3′, 5′-GGGAAAUCAUCUCGCAGCAUU-3′, 5′-CCAAGAAGGCAUCGACGUAUU-3′, 5′-AGAAGAAUGUGAUGAACGAUU-3′). Cells were transfected using DharmaFECT3 reagent according to the manufacturer’s instructions with 100 nmol each siRNA/well (~106 cells/3.5 cm2 well) under proliferating conditions, and incubated overnight in siRNA-containing medium. Cells were maintained in proliferation medium for 48 hrs, then transferred to differentiation conditions for the indicated lengths of time.
Flow cytometry
Cells were prepared for flow cytometry as previously described (Epting et al., 2004, 2008). Primary antibodies included anti-Ki67 at 0.5 μg/ml and MF20 at 1:100. FITC-conjugated donkey anti-mouse F′ab (Jackson Immuno Research) at 1:1,000 was used as secondary antibody. Nucleated cells were detected by staining with 7-AAD and data was acquired for ≥10,000 events with a BD LRS II cytometer with standard filter sets, and analyzed using FlowJo 7.2 software (Tree Star, Ashland, OR).
Quantitative real-time PCR (qPCR)
RNA was extracted from ≥5,000 freshly isolated cells using the PicoPure RNA Isolation Kit (Arcturus/Molecular Devices) according to the manufacturer’s directions. cDNA was synthesized from total RNA using SuperScript III (Invitrogen) and quantitated using a Nanodrop ND-1000 Spectrophotometer (Nanodrop Technologies, ND Software version 3.3.0). Linear pre-amplification of target sequences was accomplished using the Applied Biosystems PreAmp system. Relative expression was determined by quantitative real-time PCR (qPCR) using the TaqMan Assay (Applied Biosystems, Foster City, CA) on an ABI 7300 Real Time PCR System with the following primer pairs (ABI): Cyclin D1 (Mm00432359_m1), Cyclin B1 (Mm00838401_g1), Myf5 (Mm00435125_m1), myosin heavy chain (Mm00454991_m1) and GAPDH (4352339E). Cycle times to detection were normalized against GAPDH controls, and relative changes were calculated using ABI Version 1.4 Sequence Detection Software.
Statistics
For quantitative studies involving continuous variables, the covariance of the means was compared using Student’s t-test. To analyze changes over time, the Mann–Whitney test was employed to compare groups without normal distributions but which were comparable. For tests with an output in discrete variables, and for comparison between groups, Chi-square analysis was used. A value of P <0.05 was considered significant. All analyses were performed using either JMP-IN v. 5.1.2 (Thomson, Florence, KY) or SPSS v. 16 (SPSS, Inc., Chicago, IL) for Macintosh.
Results
Lipid microdomain organization is necessary for myoblast differentiation
Lipid microdomains are plasma membrane domains rich in cholesterol that facilitate coalescence of surface, transmembrane, and intracellular proteins in the orchestration of transmembrane signaling (Niemela et al., 2007). GPI-anchored proteins often sort to these domains by virtue of their membrane anchor (Kenworthy et al., 2000). Sca-1 is a known GPI-anchored protein that associates with lipid microdomains in lymphocytes (Bohuslav et al., 1993), but localization and its significance has not been explored in myogenic cells. Our previous work demonstrated that Sca-1 expression is temporally regulated during myoblast differentiation in both cultured myoblasts and in vivo after muscle injury (Epting et al., 2004, 2008). Sca-1 expression occurs predominantly in proliferating, mononuclear myoblasts and is down regulated as myoblasts withdraw from the cell cycle and express myosin, thus becoming myocytes. These myocytes subsequently fuse into multinucleated syncytia, or myotubes, that assemble into myofibrils (Hawke and Garry, 2001). The regulated expression of Sca-1 at the appropriate time during the myoblast/myocyte transition is necessary for cells to appropriately withdraw from the cell cycle as they undergo myogenic differentiation. Cells that lack Sca-1 at the time of this transition favor proliferation, and experience a delay in terminal differentiation (Epting et al., 2004; Mitchell et al., 2005). Thus, temporal regulation of Sca-1 appears critical for normal myogenesis to occur, however, spatial regulation of Sca-1 in myoblasts has not previously been explored. We therefore asked whether myogenesis was dependent on the appropriate organization of lipid microdomains.
We previously demonstrated that enzymatic removal of GPI-APs, including Sca-1, from the surface of myoblasts attenuated differentiation in myogenic cell lines across species (Epting et al., 2004). To explore the role of lipid microdomains during myoblast differentiation, we treated C2C12 cells with MβCD, a cholesterol scavenger that extracts cholesterol from the membrane and renders it less fluid with impaired microdomain reorganization (Ilangumaran and Hoessli, 1998). We found that treatment with MβCD resulted in a reversible differentiation defect (Fig. 1), suggesting that lipid microdomain organization is essential for the progression of myoblast differentiation induced by serum withdrawal. In cultures allowed to differentiate normally for 5 days, robust cell fusion was observed (Fig. 1A,B), whereas in the presence of MβCD, cells remained viable but mononuclear (Fig. 1C). When treatment was removed, cells differentiated normally over the next 5 days (Fig. 1D) suggesting a reversible differentiation defect. The myoblast fusion index (MFI), a means of estimating the degree of multinucleation (Epting et al., 2004), revealed that fusion was significantly impaired during MβCD treatment after 5 days compared to untreated cells (0.01 ±0.01 vs. 0.65 ±0.12; df =5, P <0.01) whereas the MFI was similar between cells treated for 5 days and recovered for 5 days or untreated cells at 10 days of differentiation (0.79 ±0.14 vs. 0.69 ±0.09; df =5, P =0.41). These results, combined with our previous observations about a role for GPI-APs during myogenic differentiation (Epting et al., 2004), support a permissive role for both GPI-APs and lipid microdomain reorganization during myoblast differentiation.
Fig. 1.
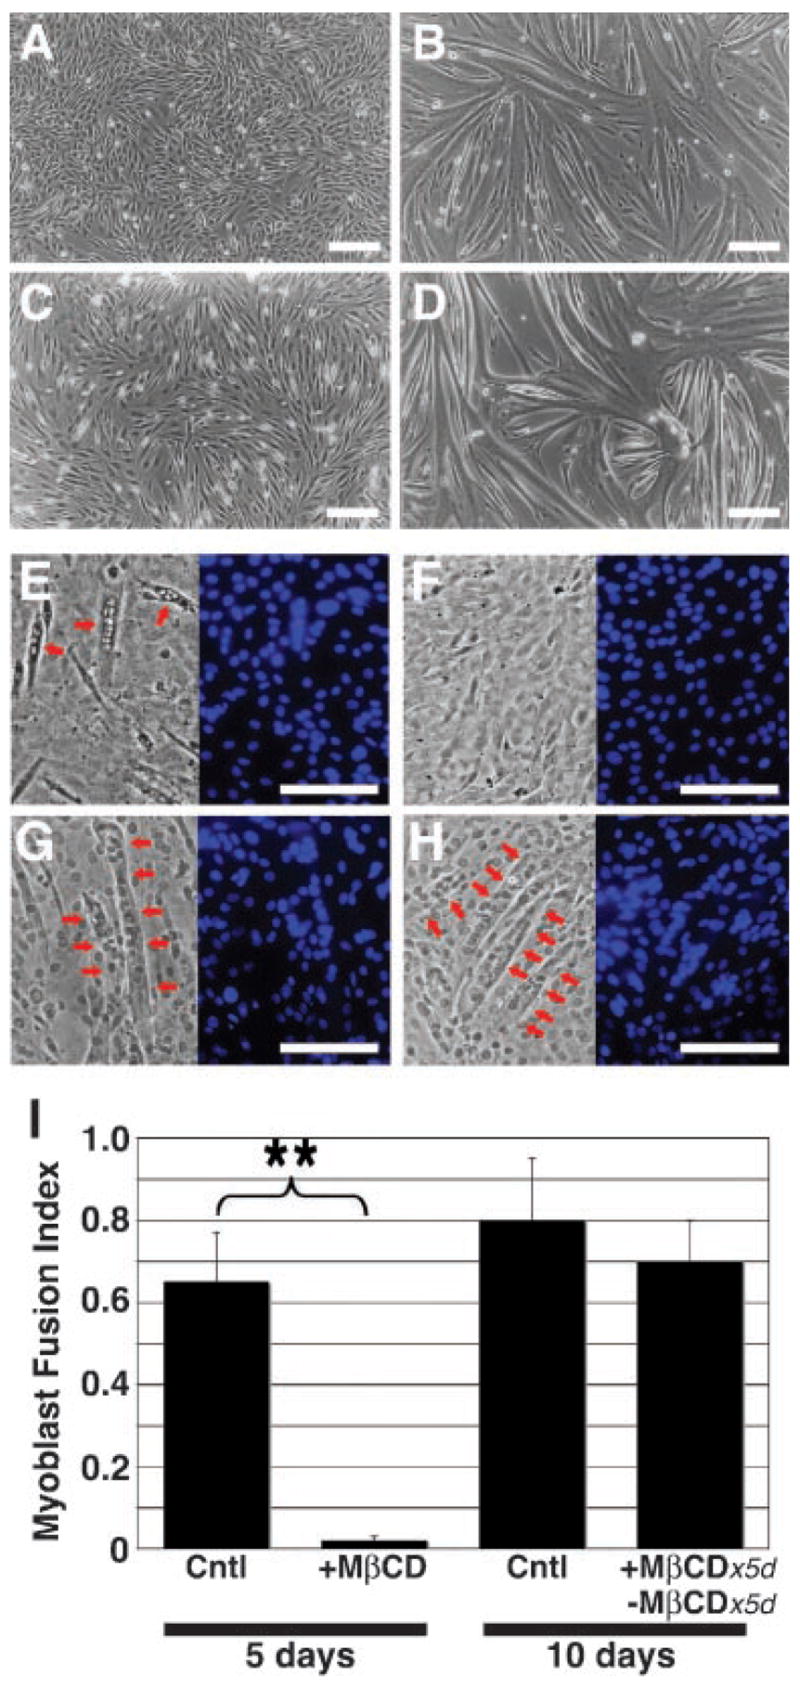
Lipid microdomains are necessary for normal myoblast differentiation. Proliferating myoblasts (A) grown under differentiation conditions formed multinucleated myotubes (B) within 5 days. C: Confluent myoblasts remained mononuclear after 5 days under differentiating conditions in the presence of MβCD. D: With subsequent washout of MβCD, the myoblasts differentiated normally within 5 days. E–G: Representative phase micrographs (left parts) of differentiating myoblasts grown under conditions as in (B–D), respectively, and stained with DAPI (blue; right parts) for calculation of MFI. H: Control myoblasts grown under differentiating conditions for 10 days. Red arrows indicate representative myotubes. A–H: Bar, 50 μm. I: Cells treated with MβCD for 5 days (see C, F) demonstrated a significantly attenuated MFI (see Materials and Methods Section) compared to untreated cells (see B,E). MFI was not significantly different between cultures grown without MβCD for 5 days (see B,E) or 10 days (see H), or for 5 days in the presence of MβCD followed by 5 days after MβCD washout (see D,G). Data shown are mean ±SEM (N =3). **P > 0.01.
Sca-1 constitutively segregates with lipid microdomains in C2C12 myoblasts
We had demonstrated that Sca-1 expression is temporally regulated during myoblast activation and differentiation, and that expression was confined to mononuclear, proliferating myoblasts. We hypothesized that Sca-1 may also undergo spatial re-organization into and out of lipid microdomains during differentiation. Lipid microdomains are classically defined as regions of the plasma membrane resistant to solubilization in non-ionic detergents (Foster and Chan, 2007). We separated lipid microdomain from non-lipid microdomain components on a discontinuous sucrose gradient and analyzed the segregation of Sca-1 during proliferation and differentiation by immunoblot analysis (Fig. 2). We found that the vast majority of Sca-1 consistently remained in the buoyant, lipid microdomain-associated fraction in proliferating cells, as well as after 24 and 120 h of differentiation. Sca-1 segregated with the known lipid microdomain markers GM1 ganglioside (Vyas et al., 2001), flotillin-1 (Salzer and Prohaska, 2001), and caveolin-3 (Song et al., 1996), the latter only expressed in differentiating cells. The transferrin receptor (CD71), a cell surface protein known to be excluded from lipid microdomains, served as a control (Harder et al., 1998). These results suggested that Sca-1 does indeed sort to lipid microdomains in myoblasts, but that its localization to this compartment is not dynamically regulated. We also analyzed total cellular Sca-1 in the soluble and plasma membrane fractions of whole cell lysates and found that Sca-1 was consistently found in the membrane fraction (data not shown), suggesting that Sca-1 protein is exclusively associated with the plasma membrane.
Fig. 2.

Sca-1 segregates with the lipid microdomains. C2C12 cells were harvested from cultures grown in proliferation medium (PRO), and after 24 and 120 h of growth in differentiation medium (low serum), where early and late evidence of myotube formation was apparent, respectively. Separation of buoyant, lipid-microdomain-containing fractions was performed by centrifugation on a discontinuous sucrose gradient, and fractions collected and analyzed by immunoblot for lipid microdomain-associated proteins, flotillin-1 (Flo-1) and caveolin-3 (Cav-3), and the non-LM-associated protein, transferrin receptor (TFR). Slot blot analysis was performed for LM-associated GM1 gangliosides (GM1). Representative data are shown. LM, lipid-microdomain-containing fractions; non-LM, non-lipid microdomain-containing fractions. At all time points, the majority of Sca-1 consistently segregated with the LM-associated markers flotillin-1, Cavolin-3 and GM1 ganglioside, but not with the transferrin receptor, a non-LM protein. No significant differences in Sca-1 segregation were found during differentiation.
To support these results, we analyzed C2C12 myoblasts by confocal microscopy during proliferation and after 24 and 120 h of differentiation to establish co-localization with lipid microdomain components (Fig. 3). We found Sca-1 staining on the surface of mononuclear cells but not multinucleated myocytes. Mononuclear myoblasts can be found even in predominantly differentiated cultures, and are thought to represent a “reserve” population with proliferative potential (Mitchell et al., 2005). In these mononuclear cells, Sca-1 staining overlapped with lipid microdomain-associated GM1 ganglioside, but not with the non-lipid microdomain-associated transferrin receptor, supporting the biochemical results obtained from our sucrose density experiments (Fig. 2). We observed no qualitative difference in Sca-1/GM1 overlap or in Sca-1/transferin receptor overlap between the three stages of proliferation versus differentiation assessed in culture. We recognize that for antigens with a wide surface distribution, the finding of co-localization must be interpreted with caution. However, taken together, the biochemical and immunofluorescence data support a static lipid microdomain association for Sca-1, that is, that Sca-1 is not dynamically regulated between lipid microdomain and non-lipid microdomain compartments of the plasma membrane during myoblast differentiation.
Fig. 3.
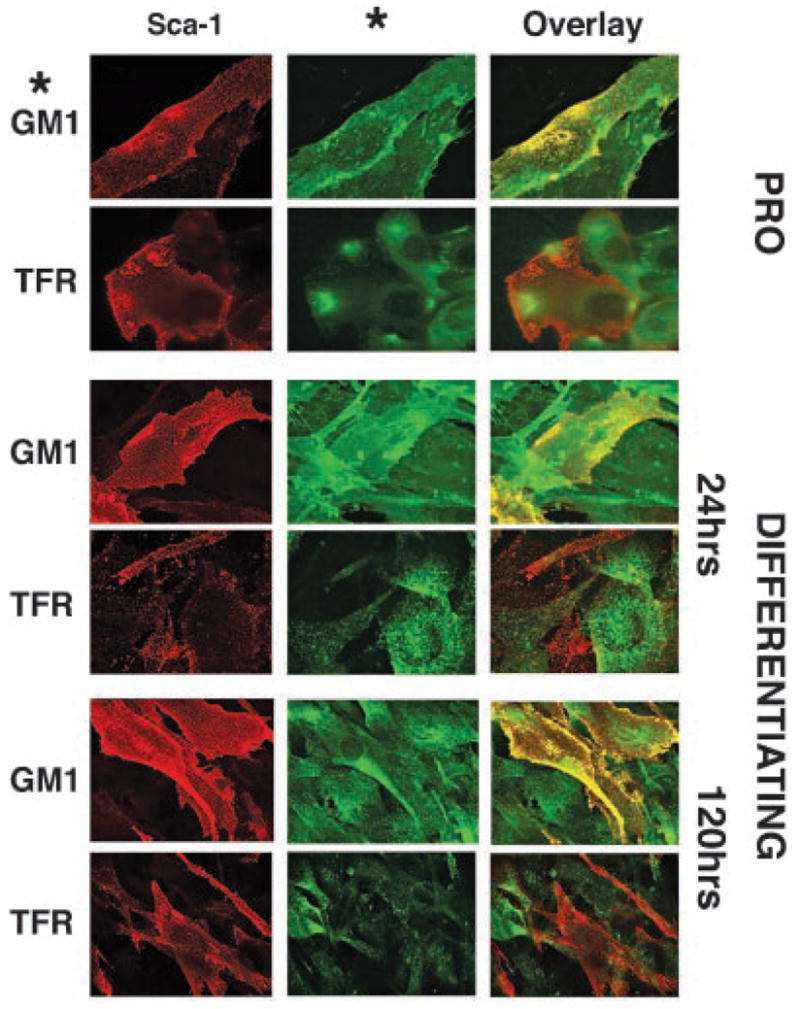
Sca-1 remains localized to lipid microdomains during differentiation. C2C12 myoblasts were imaged before (PRO) and after 24 and 120 h of differentiation. Representative data are shown. Sca-1 (red) showed overlap (yellow) with GM1 ganglioside (GM1; green), a lipid microdomain marker, in proliferating and differentiating cells. Sca-1 demonstrated minimal overlap with the transferrin receptor (TFR), a non-lipid microdomain-associated cell surface protein at all stages. These findings support the biochemical data in Figure 2, and suggest that Sca-1 constitutively localizes to lipid microdomains in myoblasts.
Sca-1 associates with insulin degrading enzyme
Since Sca-1 did not appear to be regulated through dynamic sublocalization in the plasma membrane, we investigated potential associations with other proteins as a mechanism for Sca-1 function. Sca-1 signaling has received limited investigation, and no natural ligands have been determined (Holmes and Stanford, 2007). Homotypic interactions have been proposed from thymocyte aggregation studies (Bamezai and Rock, 1995). Some GPI-APs signal through members of the Src kinase family (Bohuslav et al., 1995), and we previously identified Fyn kinase as a downstream mediator of Sca-1 signaling in myoblasts (Epting et al., 2004). Since the Sca-1 GPI anchor inserts into the external leaflet of the plasma membrane, and acylated Fyn associates with the internal cytoplasmic leaflet of the plasma membrane, accessory proteins or secondary messengers likely exist that couple Sca-1 to Fyn activity. Since Sca-1 expression peaks just prior to cell cycle withdrawal in differentiating C2C12 myoblasts (Shen et al., 2003; Epting et al., 2004), we harvested cells at this time point and performed co-immunoprecipitation using a weak ionic buffer and only non-ionic detergents to isolate Sca-1-associated proteins (Fig. 4). These were separated using large slab SDS–PAGE, and a unique band at ~110kDa was excised, analyzed by mass spectrometry, and determined to be insulin degrading enzyme (IDE; insulysin) (Fig. 4A). To verify these results, we directly identified IDE in Sca-1 immunoprecipitated complexes by immunoblot (Fig. 4B,C). To further confirm the interaction between Sca-1 and IDE, we created a soluble GST-Sca-1 fusion construct in pETGEXT by excluding the N-terminal ER retention sequence and the C-terminal GPI-anchoring sequence (Fig. 4D) (Spurway et al., 2001; Dalley and Bulleid, 2003). GST pull-down of proliferating C2C12 cell lysates confirmed the presence of IDE in GST-Sca-1-associated complexes (Fig. 4E). These results lend firm support to our observation that Sca-1 and IDE associate in differentiating myoblasts just prior to cell cycle withdrawal. To our knowledge, this is the first report of a specific protein association for Sca-1.
Fig. 4.

Sca-1 associates with Insulin Degrading Enzyme. A: Lysates from C2C12 myoblasts grown under differentiation conditions for 24 h were immunoprecipitated with anti-Sca-1 antibody (αSca-1) versus isotype control (IgG), and separated by SDS–polyacrylamide gel electrophoresis. Coomassie Brilliant blue staining identified aSca-1-dependent band at~110kDa protein, which was identified as IDE by LC–MS/MS analysis. B:Sca-1 was immunoprecipitated from differentiating C2C12 myoblasts, and immunoblot analysis showed that IDE (arrow) specifically co-precipitates with Sca-1 (αSca-1), compared to control immunoprecipitation with isotype control antibody (IgG). WCL, whole cell lysate. C: Immunoblot analysis as in (B) demonstrated Sca-1 immunoprecipitation. D: Details of GST-Sca-1 fusion construct in pETGEXT designed to exclude ER retention signal and GPI-anchor addition sequences. E: Empty vector (GST) and GST-Sca-1 were expressed in bacteria, purified, and used to pull down complexes from lysates of C2C12 myoblasts after 24 h of differentiation. Immunoblot analysis identified IDE in the pre-pulldown lysate (Pre), in lysate incubated with GST-Sca-1, but not in lysate incubated with GST alone.
Chemical inhibition of insulin degrading enzyme sustains myoblast proliferation
IDE is a multi-functional metalloendopeptidase that cleaves a variety of small growth factors (Duckworth et al., 1998; Im et al., 2007). We hypothesized that if IDE participates in the Sca-1-mediated pathway to sustain myoblast proliferation, then IDE inhibition would recapitulate the phenotype of Sca-1 inhibition. Our previous studies with Sca-1 demonstrated that its downregulation both in vitro and in vivo resulted in sustained proliferation and delayed differentiation (Epting et al., 2004, 2008). To test this, we treated C2C12 myoblasts with 1,10-PA, a chemical inhibitor of IDE (Fig. 5A,B) (Kayalar and Wong, 1989). As expected, there was no change in IDE protein levels after treatment with 1,10-PA by immunoblot (data not shown). Treated and control cells were analyzed after 5 days for evidence of persistent proliferation. Previous studies suggest that the majority of C2C12 cells withdraw from the cell cycle 24–48 h after serum withdrawal, and by Day 5 only 5–10% of cells will continue to demonstrate evidence of ongoing proliferation (Shen et al., 2003; Epting et al., 2004). We assayed 1,10-PA-treated and untreated cells for expression of Ki67, a marker of proliferation (Landberg et al., 1990), and determined that treatment with 1,10-PA resulted in a significant increase in the percentage of proliferating (Ki67+) myoblasts at Day 5 compared to control (Fig. 5A,B; 20.2 ±2.4 vs.12.2 ±1.4; df =14, P <0.01).
Fig. 5.

Inhibition of IDE causes persistent proliferation. A,B: Treatment of differentiating C2C12 cells with 1,10-PA. A: Representative immunostaining for Ki67 (red), a marker of proliferation, revealed increased percentage of Ki67+ myoblast nuclei (Ki67+/DAPI+) after 1,10-PA treatment. Nuclei were counterstained with DAPI (blue). B: Quantitation of Ki67 immunostaining demonstrated a significantly increased percentage of Ki67+/DAPI+ myoblast nuclei grown under differentiation conditions for 5days after treatment with 1, 10-PA compared to untreated cells (Cntl). Data shown are mean ±SEM (N =3). **P < 0.01. C–F: Treatment of C2C12 cells with siRNA against IDE. C: qPCR analysis of IDE expression following siRNA transfection (IDE RNAi) of proliferating cells (on Day –2) demonstrated significantly decreased IDE mRNA levels at Days 0 (D0), 2 (D2), and 5 (D5) of differentiation versus cells transfected with the control siRNA pool (Cntl). Data shown are mean ±SEM (N =2). *P < 0.05.D:Immunoblot analysis of IDE from C2C12 lysates followings iRNA transfection, as in Figure 1D, showed similar decreases inID Eprotein at Days 0, 2, and 5 of differentiation versus control siRNA pool-transfected cultures (Cntl). E: Cells were maintained in proliferation medium after siRNA transfection, and cell number counted at 48 and 96 h. IDE siRNA-treated cultures demonstrated a significant increase in cell number compared to control siRNA pool-treated cultures (Cntl). Data shown are mean ±SEM (N =4). F: Quantitation of Ki67 immunostaining demonstrated a significantly increased percentage of Ki67+myoblast nuclei (Ki67+/DAPI+) in cultures grown under differentiation conditions for 5 days after transfection with IDE siRNA compared to control siRNA pool-treated cultures (Cntl). Data shown are mean ±SEM (N =3). *P < 0.05.
Downregulation of IDE mRNA sustains myoblast proliferation
To determine whether the pro-proliferative effect of chemical inhibition of IDE was specific, we employed gene-specific targeting by RNA interference. We applied a pool of four siRNAs directed against IDE versus a pool of control siRNAs, and demonstrated a 75% reduction in IDE mRNA by qPCR (Fig. 5C) and protein by immunoblot (Fig. 5D) specifically in the IDE siRNA-treated cells. We monitored proliferation by Ki67 expression as above, and noted that cells transfected with siRNA against IDE demonstrated an increased expansion rate compared to cells transfected with a non-targeting control siRNA pool (Fig. 5E). Treatment with siRNA against IDE also significantly increased the percentage of proliferating cells within differentiating populations compared to control siRNA-treated cells (Fig. 5F; 12.7 ±1.7 vs. 8.3 ±1.9; df =14, P <0.05). These results demonstrate that interference with IDE by both chemical inhibition and siRNA knockdown of gene transcription results in sustained cell proliferation similar to the effects noted after Sca-1 inhibition (Epting et al., 2004).
IDE inhibition promotes cyclin expression and delays myogenic differentiation
To further investigate the effects of IDE inhibition on myoblast proliferation and differentiation, we evaluated IDE siRNA-treated cells for molecular evidence of altered cell division and delayed differentiation (Fig. 6). We determined that cells treated with IDE siRNA demonstrated an increase in the percentage of Ki67-expressing cells at Day 2 compared to control siRNA-treated cells (Fig. 6A; 12.4 ±0.68 vs. 8.97 ±0.5; df =8, P <0.05), consistent with the accelerated growth observed in culture (Fig. 5E). Myosin heavy chain expression (percentage of MF20+cells) also was decreased versus control-treated cells after 2 days of differentiation (Fig. 6A; 5.2 ±1.7 vs. 14.1 ±3.3; df =5, P <0.05), consistent with a delay in the onset of differentiation.
Fig. 6.

IDE inhibition causesadelay inmyogenic differentiation. C2C12 were transfected withsiRNA against IDEor non-targeting control siRNA pool as in Figure 5. A: Representative flow cytometric analysis of Ki67 and myosin heavy chain (MHC) expression at Day2 of differentiation showed an increase in the percentage of Ki67+ myoblasts and a decrease in the percentage of MHC+ cells (left part). This is consistent with persistent proliferation (as shown in Fig. 5) leading to delayed differentiation. Graphed data shown (right part) represent mean ±SEM (N =3). *P < 0.05. B:qPCR analysis of relativ eexpression demonstrated persistence of the early myogenic marker, Myf5, and delayed expression of the later myogenic marker, MHC, in C2C12 cultures transfected with IDE siRNA and grown under differentiation conditions for 2 and 5 days (top parts). This is consistent with the persistent expression of the proliferative cyclins D1 and B1 at these same time points (bottom parts). Data shown are mean ±SEM (N =3). **P < 0.01; ***P < 0.001. C: Cells transfected with IDE siRNA demonstrated a decreased MFI compared to non-targeting control. Data shown are mean ±SEM (N =3). *P > 0.05. [Color figure can be viewed in the online issue, which is available at www.interscience.wiley.com.]
We employed qPCR to examine the expression of cyclins D1 and B1, two cell cycle regulatory proteins, over the course of C2C12 myoblast differentiation (Fig. 6B; bottom parts). Cells treated with IDE siRNA had sustained levels of the G1/S-specific cyclin D1 and G2/M-specific cyclin B1 relative to control-treated cells during differentiation. These findings showed that the increased proliferation seen with siRNA knockdown of IDE correlates with sustained expression of G1/S and G2/M cyclins that promote cell cycle progression.
We also analyzed the expression of Myf5, a marker of early myogenesis, and myosin heavy chain, a marker of late myogenic differentiation, in cells transfected with IDE siRNA (Fig. 6B; top parts). We observed that Myf5 expression decreased during differentiation of untreated cells, consistent with progression of the myogenic program, whereas cells treated with siRNA against IDE demonstrated sustained Myf5 expression. Similarly, myosin heavy chain expression, normally increased with differentiation, was relatively decreased in cells expressing IDE siRNA.
Given the molecular evidence for a delay in differentiation in cells expressing IDE siRNA, we examined whether a physiological effect on myoblast fusion also could be seen (Fig. 6C). Indeed, cells expressing IDE siRNA had a significantly lower myoblast fusion index compared to untreated C2C12 myoblasts at Day 5 of differentiation (0.33 ±0.12 vs. 0.15 ±0.05; df =14, P <0.05). Together, these data demonstrate that the effect of IDE downregulation on myoblast proliferation leads to a secondary effect on differentiation, as has been shown for Sca-1 (Epting et al., 2004, 2008).
Discussion
Sca-1 is expressed on many tissue progenitors, including hematopoietic, osteogenic, and myogenic precursors (Holmes and Stanford, 2007). Beyond its role as a marker of tissue-specific stem cells, however, the biology of Sca-1 remains incompletely understood. Previous studies have revealed that Sca-1 acts as a negative regulator of myogenic precursor cell proliferation both in vitro and in vivo (Epting et al., 2004, 2008; Mitchell et al., 2005). The mechanisms by which Sca-1 accomplishes these physiological effects, however, are not known.
The results now presented offer insight into how Sca-1-mediated signaling may be regulated. We show that: (1) appropriate lipid microdomain organization is necessary for normal myoblast differentiation, (2) Sca-1 constitutively occupies the lipid microdomain compartment in proliferating and differentiating myoblasts, (3) Sca-1 associates with IDE, a catalytic protein known to cleave mitogenically active substrates, and (4) IDE down-regulation by chemical inhibition or siRNA recapitulates the phenotype of Sca-1 inhibition with sustained myoblast proliferation and delayed differentiation.
Since extensive membrane reorganization occurs during myoblast differentiation as cells fuse into multinucleated myotubes (Blumenthal et al., 2003), it is perhaps not surprising that extraction of plasma membrane cholesterol by treatment with MβCD arrests myogenic differentiation. This initial finding, however, led us to examine the membrane sublocalization of Sca-1 as a potential platform for signaling. We found that microdomains characterized by high lipid content (i.e., lipid microdomains) are the sole site of Sca-1 expression in myoblasts, and that Sca-1 remains associated with these microdomains throughout those stages of myogenesis in which Sca-1 plays a role. Sca-1 localization to lipid microdomains also supports the hypothesis that Sca-1 regulates myoblast proliferation by signaling to intracellular mitogenic pathways (Epting et al., 2004), since lipid microdomains are thought to facilitate the assembly of surface, transmembrane, and intracellular signaling complexes (Hoessli et al., 2000).
We also report the identification of a previously unrecognized protein association between Sca-1 and IDE. The known functions of IDE make it a plausible candidate to couple Sca-1 mediated signaling from the cell surface to the cytoplasm (Authier et al., 1996). Beyond its recently highlighted role in processing amyloid in Alzheimer’s disease and in diabetes (Qiu et al., 1998; Fakhrai-Rad et al., 2000; Zhao et al., 2004), IDE is a multifunctional enzyme capable of degrading a variety of peptide targets (Udrisar et al., 2005; Li et al., 2006), and thus may downregulate signaling from mitogens known to promote proliferation over differentiation. Intriguingly, pleomorphisms in IDE recently have been linked to human type II diabetes (Sladek et al., 2007), and an extensive literature exists connecting diabetes, skeletal muscle insulin processing, and muscle atrophy (Bassel-Duby and Olson, 2006). IDE also is a member of the zinc-metalloendopeptidase superfamily that shares homology with the ADAM family of endopeptidases capable of interacting with Src family kinases via their SH3 domains (Kang et al., 2000). Since Sca-1 has been shown to couple functionally to Fyn kinase in myoblasts (Epting et al., 2004) as well as in T lymphocytes (Lee et al., 1994), the possibility that IDE transmits Sca-1-mediated signals to Fyn deserves further investigation.
IDE is found in many cellular compartments, including the cytosol, plasma membrane, and perioxisome, and is secreted into the extracellular matrix as well (Seta and Roth, 1997; Duckworth et al., 1998; Qiu et al., 1998). We examined IDE subcellular localization in proliferating and differentiating myoblasts, and found that IDE remained largely in the soluble fraction, that is, the cytosol (data not shown). This suggests that IDE resides primarily in the cytoplasm of myoblasts, and that either a direct association with Sca-1 at the plasma membrane occurs only briefly, that a minority of the total cellular IDE associates with Sca-1, or that Sca-1 and IDE communicate within a lipid microdomain-associated complex through accessory proteins.
Metalloproteases have been implicated in the myogenic differentiation of L6 rat myoblasts through chemical inhibition studies (Rosenberg et al., 1985). In the present study, inhibition of IDE using chemical (1,10-PA) or transcriptional (RNAi) means confirmed that IDE regulates C2C12 myoblast proliferation and subsequently differentiation. Specifically, we found that IDE inhibition phenocopies Sca-1 inhibition. If Sca-1 signals through a growth factor receptor signaling platform within lipid microdomains, then disruption of either Sca-1 or IDE might generate a similar phenotype. We found that IDE inhibition resulted in sustained myoblast proliferation under differentiation conditions. Furthermore, we found that this phenotype correlated with increased cyclin D1 and B1 expression, the biochemical hallmark of cell cycle progression (Morgan, 1997). These results provide evidence of sustained proliferation after IDE inhibition, similar to that observed following Sca-1 inhibition in vitro (Epting et al., 2004).
Myogenic differentiation also was affected by IDE inhibition. Myf5 expression is an early event in the cascade of bHLH transcription factors which regulate myogenic commitment and differentiation (Ludolph and Konieczny, 1995). Similar to Sca-1 inhibition (Epting et al., 2004), we found sustained expression of Myf5 during differentiation with IDE inhibition, suggesting that IDE siRNA-treated myoblasts display arrested myogenic differentiation. The onset of myosin expression defines the later stages of myocyte differentiation, and IDE inhibition resulted in decreased expression of myosin heavy chain, as determined both by flow cytometry and qPCR. Furthermore, we demonstrated attenuated terminal differentiation with a decrease in myoblast fusion. These observations of persistent proliferation leading to arrested myogenic differentiation reproduce our findings with Sca-1 inhibition in vitro and in vivo (Epting et al., 2004, 2008). This observation also may provide clues to the link between advanced age, impaired satellite cell function, and decreased myofibril growth (Goldspink and Harridge, 2004; Mitchell et al., 2005; Brack et al., 2007), as insulin signaling through IDE may be affected with age. However, this would require further study.
From these observations, we propose that the mechanism(s) for Sca-1 signaling depend on its localization to lipid microdomains and likely involves IDE. Our data provide evidence supporting the hypothesis that Sca-1 and IDE share a functional interaction, strengthened by their physical association. Sca-1 and IDE on opposing sides of the membrane may couple through a transmembrane co-receptor, and ultimately affect Fyn kinase activity. In such a model, IDE might serve to terminate signaling and suppress proliferation. Alternatively, Sca-1 and IDE might utilize distinct but converging pathways that share common downstream elements regulating proliferation. Additional study will be required to distinguish between these two possibilities.
Our findings demonstrate for the first time that Sca-1 localizes to lipid microdomains in myogenic precursors, and that it associates with a catalytically active intracellular messenger, IDE. These suggest a novel pathway from the myoblast surface to mitogenic signaling cascades, and a potential pathway for Sca-1-mediated signaling. Further investigation of this pathway may lead to new strategies for manipulating the myogenic proliferative response, and ultimately muscle repair.
Acknowledgments
This work was supported by AHA Established Investigator Award 0340039N and AHA Grant-in-Aid 07550234Y to H.S.B. C.L.E. was supported by the Pediatric Critical Care Scientist Development Program (Public Health Service grant HD047349). F.W.K. was supported by National Research Service Award HL007544 from NHLBI. J.Z. was supported by an AHA Western States Affiliate Student Research Fellowship. We thank Brian Black and Hal Chapman for helpful discussion, Julian I.E. Hoffman for advice on statistical analysis, and Ben Beisswenger for assistance with preparing figures.
Literature Cited
- Authier F, Posner BI, Bergeron JJ. Insulin-degrading enzyme. Clin Invest Med. 1996;19:149–160. [PubMed] [Google Scholar]
- Bamezai A, Rock KL. Overexpressed Ly-6A.2 mediates cell-cell adhesion by binding a ligand expressed on lymphoid cells. Proc Natl Acad Sci USA. 1995;92:4294–4298. doi: 10.1073/pnas.92.10.4294. [DOI] [PMC free article] [PubMed] [Google Scholar]
- Bassel-Duby R, Olson EN. Signaling pathways in skeletal muscle remodeling. Annu Rev Biochem. 2006;75:19–37. doi: 10.1146/annurev.biochem.75.103004.142622. [DOI] [PubMed] [Google Scholar]
- Blumenthal R, Clague MJ, Durell SR, Epand RM. Membrane fusion. Chem Rev. 2003;103:53–69. doi: 10.1021/cr000036+. [DOI] [PubMed] [Google Scholar]
- Bohuslav J, Cinek T, Horejsi V. Large, detergent-resistant complexes containing murine antigens Thy-1 and Ly-6 and protein tyrosine kinase p56lck. Eur J Immunol. 1993;23:825–831. doi: 10.1002/eji.1830230409. [DOI] [PubMed] [Google Scholar]
- Bohuslav J, Horejsi V, Hansmann C, Stockl J, Weidle UH, Majdic O, Bartke I, Knapp W, Stockinger H. Urokinase plasminogen activator receptor, beta 2-integrins, and Src-kinases within a single receptor complex of human monocytes. J Exp Med. 1995;181:1381–1390. doi: 10.1084/jem.181.4.1381. [DOI] [PMC free article] [PubMed] [Google Scholar]
- Brack AS, Conboy MJ, Roy S, Lee M, Kuo CJ, Keller C, Rando TA. Increased Wnt signaling during aging alters muscle stem cell fate and increases fibrosis. Science. 2007;317:807–810. doi: 10.1126/science.1144090. [DOI] [PubMed] [Google Scholar]
- Clissold PM. Recombinant glycosylphosphatidylinositol-anchored proteins are not associated with protein kinases in transfected thymoma cells. Biochem J. 1994;304:853–859. doi: 10.1042/bj3040853. [DOI] [PMC free article] [PubMed] [Google Scholar]
- Dalley JA, Bulleid NJ. The endoplasmic reticulum (ER) translocon can differentiate between hydrophobic sequences allowing signals for glycosylphosphatidylinositol anchor addition to be fully translocated into the ER lumen. J Biol Chem. 2003;278:51749–51757. doi: 10.1074/jbc.M303978200. [DOI] [PubMed] [Google Scholar]
- Duckworth WC, Bennett RG, Hamel FG. Insulin degradation: Progress and potential. Endocr Rev. 1998;19:608–624. doi: 10.1210/edrv.19.5.0349. [DOI] [PubMed] [Google Scholar]
- Epting CL, Lopez JE, Shen X, Liu L, Bristow J, Bernstein HS. Stem cell antigen-1 is necessary for cell-cycle withdrawal and myoblast differentiation in C2C12 cells. J Cell Sci. 2004;117:6185–6195. doi: 10.1242/jcs.01548. [DOI] [PubMed] [Google Scholar]
- Epting CL, Lopez JE, Pedersen A, Brown C, Spitz P, Ursell PC, Bernstein HS. Stem cell antigen-1 regulates the tempo of muscle repair through effects on proliferation of alpha7 integrin-expressing myoblasts. Exp Cell Res. 2008;314:1125–1135. doi: 10.1016/j.yexcr.2007.11.010. [DOI] [PMC free article] [PubMed] [Google Scholar]
- Fakhrai-Rad H, Nikoshkov A, Kamel A, Fernstrom M, Zierath JR, Norgren S, Luthman H, Galli J. Insulin-degrading enzyme identified as a candidate diabetes susceptibility gene in GK rats. Hum Mol Genet. 2000;9:2149–2158. doi: 10.1093/hmg/9.14.2149. [DOI] [PubMed] [Google Scholar]
- Foster LJ, Chan QW. Lipid raft proteomics: More than just detergent-resistant membranes. Subcell Biochem. 2007;43:35–47. doi: 10.1007/978-1-4020-5943-8_4. [DOI] [PubMed] [Google Scholar]
- Goldspink G, Harridge SD. Growth factors and muscle ageing. Exp Gerontol. 2004;39:1433–1438. doi: 10.1016/j.exger.2004.08.010. [DOI] [PubMed] [Google Scholar]
- Harder T, Scheiffele P, Verkade P, Simons K. Lipid domain structure of the plasma membrane revealed by patching of membrane components. J Cell Biol. 1998;141:929–942. doi: 10.1083/jcb.141.4.929. [DOI] [PMC free article] [PubMed] [Google Scholar]
- Hawke TJ, Garry DJ. Myogenic satellite cells: Physiology to molecular biology. J Appl Physiol. 2001;91:534–551. doi: 10.1152/jappl.2001.91.2.534. [DOI] [PubMed] [Google Scholar]
- Hoessli DC, Ilangumaran S, Soltermann A, Robinson PJ, Borisch B, Nasir Ud D. Signaling through sphingolipid microdomains of the plasma membrane: The concept of signaling platform. Glycoconj J. 2000;17:191–197. doi: 10.1023/a:1026585006064. [DOI] [PubMed] [Google Scholar]
- Holmes C, Stanford WL. Stem cell antigen-1: Expression, function, and enigma. Stem Cells. 2007;25:1339–1347. doi: 10.1634/stemcells.2006-0644. [DOI] [PubMed] [Google Scholar]
- Ilangumaran S, Hoessli DC. Effects of cholesterol depletion by cyclodextrin on the sphingolipid microdomains of the plasma membrane. Biochem J. 1998;335:433–440. doi: 10.1042/bj3350433. [DOI] [PMC free article] [PubMed] [Google Scholar]
- Im H, Manolopoulou M, Malito E, Shen Y, Zhao J, Neant-Fery M, Sun CY, Meredith SC, Sisodia SS, Leissring MA, Tang WJ. Structure of substrate-free human insulin-degrading enzyme (IDE) and biophysical analysis of ATP-induced conformational switch of IDE. J Biol Chem. 2007;282:25453–25463. doi: 10.1074/jbc.M701590200. [DOI] [PubMed] [Google Scholar]
- Jensen ON, Wilm M, Shevchenko A, Mann M. Peptide sequencing of 2-DE gel-isolated proteins by nanoelectrospray tandem mass spectrometry. Methods Mol Biol. 1999;112:571–588. doi: 10.1385/1-59259-584-7:571. [DOI] [PubMed] [Google Scholar]
- Kang Q, Cao Y, Zolkiewska A. Metalloprotease-disintegrin ADAM 12 binds to the SH3 domain of Src and activates Src tyrosine kinase in C2C12 cells. Biochem J. 2000;352:883–892. [PMC free article] [PubMed] [Google Scholar]
- Kayalar C, Wong WT. Metalloendoprotease inhibitors which block the differentiation of L6 myoblasts inhibit insulin degradation by the endogenous insulin-degrading enzyme. J Biol Chem. 1989;264:8928–8934. [PubMed] [Google Scholar]
- Kenworthy AK, Petranova N, Edidin M. High-resolution FRET microscopy of cholera toxin B-subunit and GPI-anchored proteins in cell plasma membranes. Mol Biol Cell. 2000;11:1645–1655. doi: 10.1091/mbc.11.5.1645. [DOI] [PMC free article] [PubMed] [Google Scholar]
- Landberg G, Tan EM, Roos G. Flow cytometric multiparameter analysis of proliferating cell nuclear antigen/cyclin and Ki-67 antigen: A new view of the cell cycle. Exp Cell Res. 1990;187:111–118. doi: 10.1016/0014-4827(90)90124-s. [DOI] [PubMed] [Google Scholar]
- Lee SK, Su B, Maher SE, Bothwell AL. Ly-6A is required for T cell receptor expression and protein tyrosine kinase fyn activity. EMBO J. 1994;13:2167–2176. doi: 10.1002/j.1460-2075.1994.tb06493.x. [DOI] [PMC free article] [PubMed] [Google Scholar]
- Li P, Kuo WL, Yousef M, Rosner MR, Tang WJ. The C-terminal domain of human insulin degrading enzyme is required for dimerization and substrate recognition. Biochem Biophys Res Commun. 2006;343:1032–1037. doi: 10.1016/j.bbrc.2006.03.083. [DOI] [PubMed] [Google Scholar]
- Ludolph DC, Konieczny SF. Transcription factor families: Muscling in on the myogenic program. FASEB J. 1995;9:1595–1604. doi: 10.1096/fasebj.9.15.8529839. [DOI] [PubMed] [Google Scholar]
- Mitchell PO, Mills T, O’Connor RS, Kline ER, Graubert T, Dzierzak E, Pavlath GK. Sca-1 negatively regulates proliferation and differentiation of muscle cells. Dev Biol. 2005;283:240–252. doi: 10.1016/j.ydbio.2005.04.016. [DOI] [PubMed] [Google Scholar]
- Morgan DO. Cyclin-dependent kinases: Engines, clocks, and microprocessors. Ann Rev Cell Dev Biol. 1997;13:261–291. doi: 10.1146/annurev.cellbio.13.1.261. [DOI] [PubMed] [Google Scholar]
- Nichols BJ. GM1-containing lipid rafts are depleted within clathrin-coated pits. Curr Biol. 2003;13:686–690. doi: 10.1016/s0960-9822(03)00209-4. [DOI] [PubMed] [Google Scholar]
- Niemela PS, Ollila S, Hyvonen MT, Karttunen M, Vattulainen I. Assessing the nature of lipid raft membranes. PLoS Comput Biol. 2007;3:e34. doi: 10.1371/journal.pcbi.0030034. [DOI] [PMC free article] [PubMed] [Google Scholar]
- Qiu WQ, Walsh DM, Ye Z, Vekrellis K, Zhang J, Podlisny MB, Rosner MR, Safavi A, Hersh LB, Selkoe DJ. Insulin-degrading enzyme regulates extracellular levels of amyloid beta-protein by degradation. J Biol Chem. 1998;273:32730–32738. doi: 10.1074/jbc.273.49.32730. [DOI] [PubMed] [Google Scholar]
- Rajendran L, Masilamani M, Solomon S, Tikkanen R, Stuermer CA, Plattner H, Illges H. Asymmetric localization of flotillins/reggies in preassembled platforms confers inherent polarity to hematopoietic cells. Proc Natl Acad Sci USA. 2003;100:8241–8246. doi: 10.1073/pnas.1331629100. [DOI] [PMC free article] [PubMed] [Google Scholar]
- Rosenberg J, Szabo A, Rheuark D, Kayalar C. Correlation between fusion and the developmental regulation of membrane glycoproteins in L6 myoblasts. Proc Natl Acad Sci USA. 1985;82:8409–8413. doi: 10.1073/pnas.82.24.8409. [DOI] [PMC free article] [PubMed] [Google Scholar]
- Salzer U, Prohaska R. Stomatin, flotillin-1, and flotillin-2 are major integral proteins of erythrocyte lipid rafts. Blood. 2001;97:1141–1143. doi: 10.1182/blood.v97.4.1141. [DOI] [PubMed] [Google Scholar]
- Seta KA, Roth RA. Overexpression of insulin degrading enzyme: Cellular localization and effects on insulin signaling. Biochem Biophys Res Commun. 1997;231:167–171. doi: 10.1006/bbrc.1997.6066. [DOI] [PubMed] [Google Scholar]
- Sharrocks AD. A T7 expression vector for producing N- and C-terminal fusion proteins with glutathione S-transferase. Gene. 1994;138:105–108. doi: 10.1016/0378-1119(94)90789-7. [DOI] [PubMed] [Google Scholar]
- Shen X, Collier JM, Hlaing M, Zhang L, Delshad EH, Bristow J, Bernstein HS. Genome-wide examination of myoblast cell cycle withdrawal during differentiation. Dev Dyn. 2003;226:128–138. doi: 10.1002/dvdy.10200. [DOI] [PubMed] [Google Scholar]
- Sladek R, Rocheleau G, Rung J, Dina C, Shen L, Serre D, Boutin P, Vincent D, Belisle A, Hadjadj S, Balkau B, Heude B, Charpentier G, Hudson TJ, Montpetit A, Pshezhetsky AV, Prentki M, Posner BI, Balding DJ, Meyre D, Polychronakos C, Froguel P. A genome-wide association study identifies novel risk loci for type 2 diabetes. Nature. 2007;445:881–885. doi: 10.1038/nature05616. [DOI] [PubMed] [Google Scholar]
- Smythe GM, Eby JC, Disatnik MH, Rando TA. A caveolin-3 mutant that causes limb girdle muscular dystrophy type 1C disrupts Src localization and activity and induces apoptosis in skeletal myotubes. J Cell Sci. 2003;116:4739–4749. doi: 10.1242/jcs.00806. [DOI] [PubMed] [Google Scholar]
- Song KS, Scherer PE, Tang Z, Okamoto T, Li S, Chafel M, Chu C, Kohtz DS, Lisanti MP. Expression of caveolin-3 in skeletal, cardiac, and smooth muscle cells. Caveolin-3 is a component of the sarcolemma and co-fractionates with dystrophin and dystrophin-associated glycoproteins. J Biol Chem. 1996;271:15160–15165. doi: 10.1074/jbc.271.25.15160. [DOI] [PubMed] [Google Scholar]
- Spurway TD, Dalley JA, High S, Bulleid NJ. Early events in glycosylphosphatidylinositol anchor addition. substrate proteins associate with the transamidase subunit gpi8p. J Biol Chem. 2001;276:15975–15982. doi: 10.1074/jbc.M010128200. [DOI] [PubMed] [Google Scholar]
- Stefanova I, Horejsi V, Ansotegui IJ, Knapp W, Stockinger H. GPI-anchored cell-surface molecules complexed to protein tyrosine kinases. Science. 1991;254:1016–1619. doi: 10.1126/science.1719635. [DOI] [PubMed] [Google Scholar]
- Su B, Waneck GL, Flavell RA, Bothwell AL. The glycosyl phosphatidylinositol anchor is critical for Ly-6A/E-mediated T cell activation. J Cell Biol. 1991;112:377–384. doi: 10.1083/jcb.112.3.377. [DOI] [PMC free article] [PubMed] [Google Scholar]
- Tang Z, Scherer PE, Okamoto T, Song K, Chu C, Kohtz DS, Nishimoto I, Lodish HF, Lisanti MP. Molecular cloning of caveolin-3, a novel member of the caveolin gene family expressed predominantly in muscle. J Biol Chem. 1996;271:2255–2261. doi: 10.1074/jbc.271.4.2255. [DOI] [PubMed] [Google Scholar]
- Udrisar DP, Wanderley MI, Porto RC, Cardoso CL, Barbosa MC, Camberos MC, Cresto JC. Androgen- and estrogen-dependent regulation of insulin-degrading enzyme in subcellular fractions of rat prostate and uterus. Exp Biol Med. 2005;230:479–486. doi: 10.1177/153537020523000706. [DOI] [PubMed] [Google Scholar]
- Vyas KA, Patel HV, Vyas AA, Schnaar RL. Segregation of gangliosides GM1 and GD3 on cell membranes, isolated membrane rafts, and defined supported lipid monolayers. Biol Chem. 2001;382:241–250. doi: 10.1515/BC.2001.031. [DOI] [PubMed] [Google Scholar]
- Zhang F, Tom CC, Kugler MC, Ching TT, Kreidberg JA, Wei Y, Chapman HA. Distinct ligand binding sites in integrin alpha3beta1 regulate matrix adhesion and cell-cell contact. J Cell Biol. 2003;163:177–188. doi: 10.1083/jcb.200304065. [DOI] [PMC free article] [PubMed] [Google Scholar]
- Zhao L, Teter B, Morihara T, Lim GP, Ambegaokar SS, Ubeda OJ, Frautschy SA, Cole GM. Insulin-degrading enzyme as a downstream target of insulin receptor signaling cascade: Implications for Alzheimer’s disease intervention. J Neurosci. 2004;24:11120–11126. doi: 10.1523/JNEUROSCI.2860-04.2004. [DOI] [PMC free article] [PubMed] [Google Scholar]