

Abstract
As part of an effort to inhibit S100B, structures of pentamidine (Pnt) bound to Ca2+-loaded and Zn2+,Ca2+-loaded S100B were determined by X-ray crystallography at 2.15 Å (Rfree = 0.266) and 1.85 Å (Rfree = 0.243) resolution, respectively. These data were compared to X-ray structures solved in the absence of Pnt, including Ca2+-loaded S100B and Zn2+,Ca2+-loaded S100B determined here (1.88 Å; Rfree = 0.267). In the presence and absence of Zn2+, electron density corresponding to two Pnt molecules per S100B subunit was mapped for both drug-bound structures. One Pnt binding site (site 1) was adjacent to a p53 peptide binding site on S100B (±Zn2+), and the second Pnt molecule was mapped to the dimer interface (site 2; ±Zn2+) and in a pocket near residues that define the Zn2+ binding site on S100B. In addition, a conformational change in S100B was observed upon the addition of Zn2+ to Ca2+–S100B, which changed the conformation and orientation of Pnt bound to sites 1 and 2 of Pnt–Zn2+,Ca2+–S100B when compared to Pnt–Ca2+–S100B. That Pnt can adapt to this Zn2+-dependent conformational change was unexpected and provides a new mode for S100B inhibition by this drug. These data will be useful for developing novel inhibitors of both Ca2+-and Ca2+,Zn2+-bound S100B.
Keywords: S100B, pentamidine, X-ray crystallography, zinc, calcium
Introduction
There are more than 20 S100 proteins originally named because of their solubility in 100% saturated ammonium sulfate.1 Like calmodulin and most other EF-hand-containing proteins, S100 proteins typically function as a calcium-activated switch that binds and regulates the biological function of numerous protein targets (Fig. 1).2-5 A unique feature for several S100 proteins is that they also bind Zn2+ (Kd ∼ 90 nM; S100B) at a structurally conserved site that is separate from the EF-hand calcium-binding loops.6-11 Although the biological function of Zn2+ binding is not completely understood, it is not considered a structural ion since S100 proteins are typically stable, folded, and active in its absence. Instead, Zn2+ likely plays a regulatory role by modulating the affinity of various S100 proteins for Ca2+ and/or protein targets, which has been observed in vitro for several S100 proteins, including S100B.2,5,8,12-15
Fig. 1.
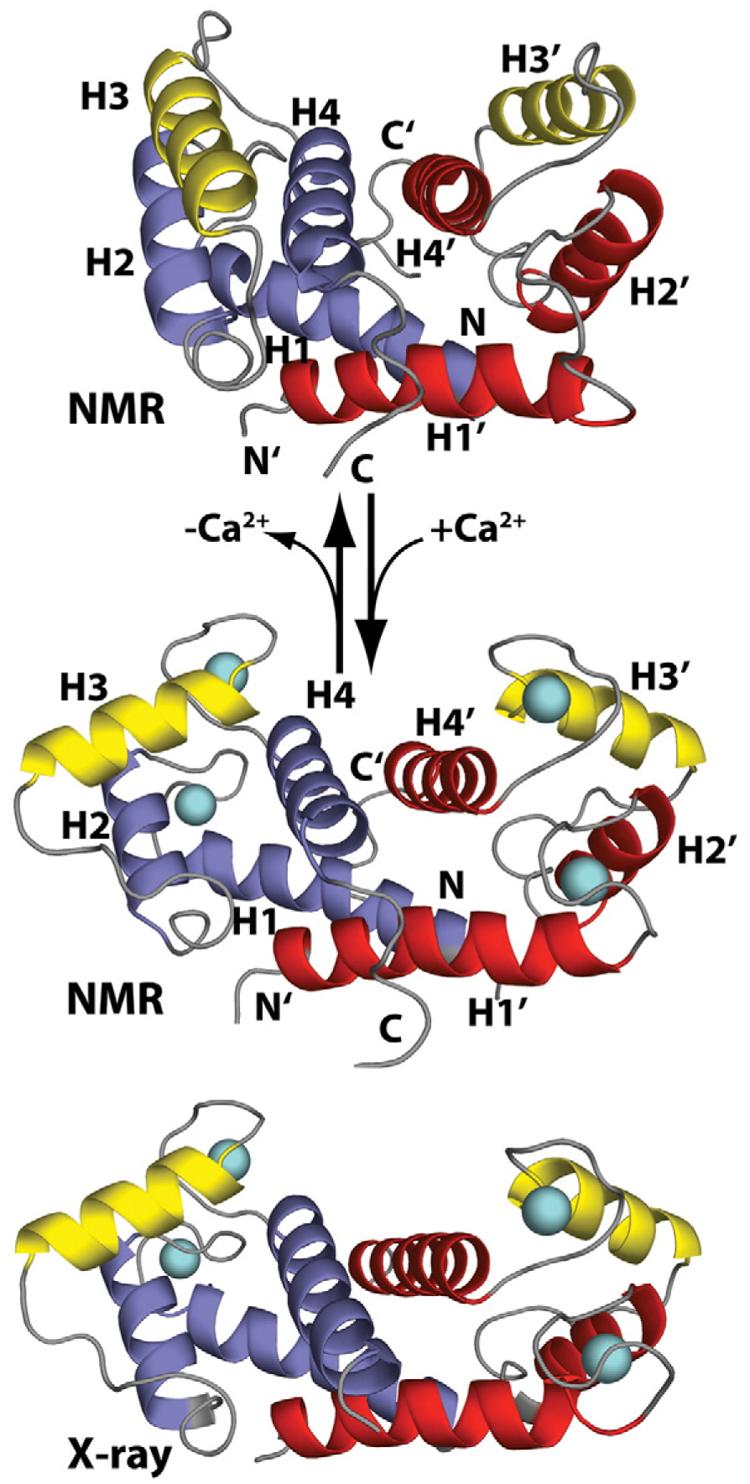
The “calcium switch” in S100B. Shown are ribbon diagrams of apo–S100B (NMR, PDB code: 1B4C) and Ca2+-bound S100B (NMR, PDB code: 1QLK; X-ray, PDB code: 1MHO) illustrating the calcium-dependent reorientation of helix 3 (yellow) in each S100B subunit, termed the “Ca2+ switch.” The other three helices in each subunit of the symmetric S100B homodimer are colored red and blue, respectively. The loop regions of S100B are colored gray, and the two calcium ions per subunit are cyan spheres. This calcium-dependent conformational change is required for S100B to interact with specific protein targets such as p53.
Members of the S100 protein family are distributed in a cell-specific manner,3,4,16 including those in a large number of human cancers.17-19 For S100B, protein levels are elevated in malignant melanoma,19 anaplastic astrocytomas,20,21 and glioblastomas.22 In the case of malignant melanoma, high concentrations of S100B correlate directly with poor prognosis in patients,23,24,25 and hence, it is used as a clinical marker for this and other cancers. In more recent mechanistic studies, S100B was found to bind directly to the p53 tumor suppressor protein in primary human malignant melanoma cells, reduce p53 protein levels, and inhibit wild-type p53 functions.6,26-30 Therefore, elevated levels of S100B contribute to cancer progression by down-regulating wild-type p53 protein.30 Correspondingly, p53 protein levels and its associated activities were restored in malignant melanoma when S100B expression was inhibited by siRNA (small interfering RNA).29 With these siRNAS100B results in mind, a rational drug design approach was initiated to develop small-molecule inhibitors that bind Ca2+–S100B, prevent S100B–p53 complex formation, and restore p53-dependent tumor suppression in cancers with wild-type p53 such as malignant melanoma.31-33 Furthermore, engineering inhibitors of the Ca2+,Zn2+-bound form of S100B may also be important since Zn2+ homeostasis is disrupted and its levels are typically elevated in patients with skin cancer.34-37
Atomic structures of S100B in the Ca2+- and p53 peptide-bound states together with computer-aided drug design and high-throughput screening approaches were used to identify small molecules that bound S100B.31-33 One such compound, pentamidine (Pnt), was characterized by NMR and found to interact with aromatic residues in helix 4 and the C-terminal loop of Ca2+–S100B.31 To pursue this S100B–drug interaction further, we determined the X-ray crystal structures of Pnt bound to divalent metal ion complexes of S100B in this study. In the calcium-bound state, S100B was found to bind two Pnt molecules per S100B subunit with one molecule located near the p53 peptide binding site (termed site 1), as predicted previously.31 The second Pnt molecule bound a separate site (site 2) at the dimer interface of Ca2+–S100B and near residues of the unoccupied Zn2+ site. However, in the presence of Ca2+ and Zn2+, the conformation and relative orientation of both S100B-bound Pnt molecules were different from that observed in the presence of Ca2+ alone. Together, the two S100B–Pnt structures will be important for developing novel, high-affinity inhibitors of Ca2+–S100B in the absence and presence of Zn2+, which could have clinical benefits for treating cancers with elevated levels of S100B.
Results
The binding of S100B to p53 down-regulates tumor suppressor activity in cancer cells such as malignant melanoma29,38; thus, a search for small molecules that bind S100B and prevent S100B–p53 complex formation was undertaken.31,33 For one such molecule, Pnt, a model for drug binding was reported based on chemical shift perturbations, saturation transfer difference (STD) data, and several intermolecular nuclear Overhauser enhancement constraints.31 Here, the structure of this Pnt–Ca2+–S100B complex was solved using X-ray crystallography. Due to the relatively high levels of Zn2+ found in skin and in skin cancers such as malignant melanoma,36,37,39 these studies were extended to also include a detailed examination of the interaction between Pnt and Zn2+,Ca2+–S100B.
Thermodynamic binding studies
As reported previously,31 the interaction between Pnt and S100B was confirmed to be calcium dependent [isothermal titration calorimetry (ITC): PntKd=53±10 μM; fluorescence: PntKd=39±3 μM; Fig. 2]. However, additional experiments showed that two Pnt molecules bound each S100B subunit with indistinguishable affinities but weaker than that reported previously for the F43W mutant of S100B (Kd∼1 μM)31 (Table 2; Fig. 2a). Under the same conditions, Pnt was also found to bind Zn2+,Ca2+–S100B by ITC (PntKd=64±15 μM; Table 2); however, when the Pnt:S100B subunit ratio approached 2:1 in these titrations, some precipitation was observed. To avoid precipitation, we also monitored the binding by titrating both Zn2+ and S100B (at a 1:1 ratio) into a solution of Pnt and monitoring the change in Pnt fluorescence (PntKd =39±5 μM; Table 2; Fig. 2b). The salt KCl was also included to curb precipitation, but this salt had only modest effects at higher Pnt:S100B ratios. Furthermore, KCl had little or effect on Pnt binding to either Ca2+–S100B (ITC: PntKd=50±5 μM; fluorescence: PntKd=44±4 μM) or Zn2+,Ca2+–S100B (ITC: PntKd=35±12 μM; fluorescence: PntKd=40±5 μM; Table 2). Pnt binding to each divalent metal ion state of S100B (i.e., Ca2+-bound, Zn2+,Ca2+--bound) was enthalpically favored as judged by negative ΔHapp values measured using ITC (−4.0 to −5.0 kcal/mol; Table 2). The entropic contribution to Pnt binding could also be estimated using the dissociation constant and ΔHapp, and in each binding experiment, a thermodynamically favored TΔS resulted (+1.0 to +2.1 kcal/mol; Table 2). Such a thermodynamic profile is consistent with productive hydrophobic and hydrogen-bonding interactions upon complex formation.40,41 When Zn2+ binding to Ca2+–S100B and to Pnt–Ca2+–S100B was examined, the dissociation constants (no drug: ZnKd=94±17 nM; with Pnt: ZnKd=134±9 nM) and the thermodynamic signature of Zn2+ binding (i.e., ΔHapp, TΔS) were found to be similar to that determined previously in the absence of Pnt.7
Fig. 2.
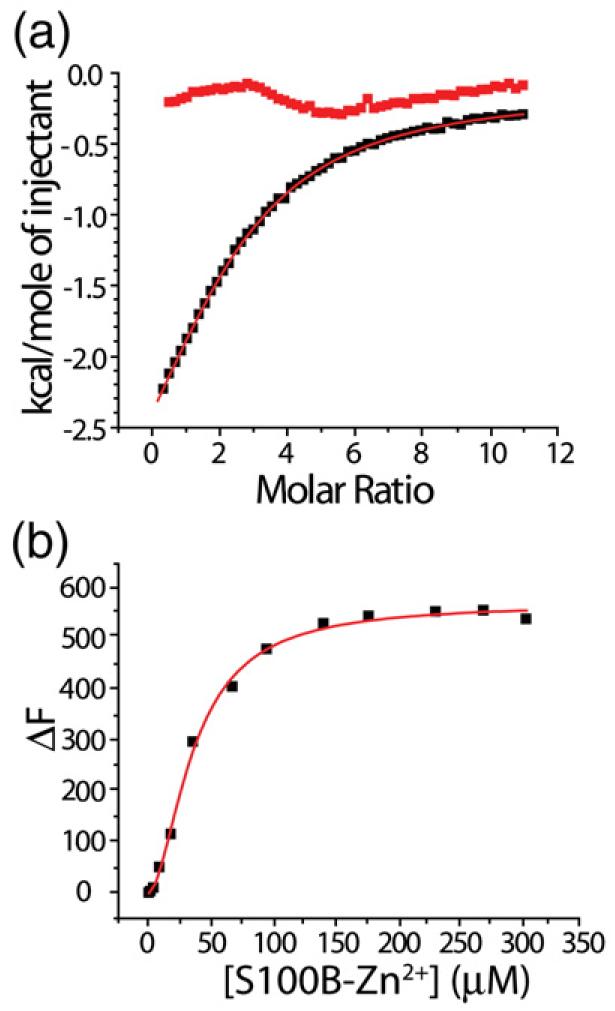
The binding of Pnt to Ca2+–S100B and Zn2+, Ca2+–S100B. (a) Representative ITC data illustrating the binding of Pnt to Ca2+–S100B (■; n=2). Conditions included 10 mM Tes, pH 7.2, 15 mM NaCl, and 10 mM CaCl2, at 37 °C. Shown also is a control experiment illustrating no Pnt binding to S100B in the absence of calcium (red boxes). (b) Representative titration of Zn2+–S100B (one Zn2+ ion per S100B subunit) with Ca2+ (10 mM) into a solution of Pnt and Ca2+ (10 mM) as monitored by changes in Pnt fluorescence (n=1.7). Conditions included 10 mM Tes, pH 7.2, 15 mM NaCl, 100 mM KCl, and 10 mM CaCl2, at 37 °C.
Table 2.
Dissociation constants (Kd) and enthalpy (ΔHapp) and entropy (TΔS) for Pnt and Zn2+ binding to S100B
|
Kd (μM), ITC |
ΔHapp (kcal/mol) |
TΔS (kcal/mol) |
Kd (μM), fluorescence |
|
|---|---|---|---|---|
| Pnt | ||||
| Ca2+-S100B (low salt)a,b | 53±10c | −4.0±0.2 | 2.1±0.2d | 39±3 |
| Ca2+-S100B (high salt)a,b | 50±5c | −4.6±0.4 | 1.5±0.4d | 44±4 |
| Zn2+,Ca2+-S100B (low salt)e,f | 64±15 | −5.0±0.1 | 1.0±0.2d | 39±5 |
| Zn2+,Ca2+-S100B (high salt)b,e | 35±12c | −4.3±0.5 | 1.6±0.5d | 40±5 |
| Zn2+ | ||||
| Pnt-Ca2+-S100B (low salt)g | 0.13±0.09 | −7.6±0.5 | 2.1±0.4d | - |
| Ca2+-S100B (low salt)h | 0.09±0.02h | −6.2±0.1h | 3.8±0.1d,h | - |
Conditions included 10 mM TES, pH 7.2, 15 mM NaCl, and 10 mM CaCl2, at 37 °C. For the high-salt conditions, 100 mM KCl.
A single dissociation constant (Kd) is reported even though two sites for Pnt binding were detected by ITC for these complexes (n = 1.9±0.2). As expected, the fluorescence data also are best fit with a two-site model (nmeasured = 1.8±0.2) for both the Pnt-Ca2+-S100B and Pnt-Zn2+,Ca2+-S100B complex. That nmeasured used to fit the fluorescence data is less than or equal to n as determined from ITC is also consistent with having two noninteracting Pnt sites. Thus, the simplest model that fits the data under these conditions is that two independent Pnt binding sites exist with indistinguishable affinities.
The c values range from 3 to 5 for the ITC experiments, indicating that the binding data are appropriate for evaluating Kd values.
An estimate for the entropic contribution to binding (TΔS) was calculated using the dissociation constant (Kd) and the apparent molar enthalpy of association (ΔHapp) for Pnt binding.
Conditions included 10 mM TES, pH 7.2,15 mM NaCl, 10 mM CaCl2, and 100–500 μM ZnCl2, at 37 °C. For the high-salt conditions, 100 mM KCl was added. For the fluorescence titrations in the presence of Zn2+, the Zn2+-to-S100B ratio did not exceed 1:1 to avoid precipitation (see Materials and Methods).
The ITC data for Zn2+,Ca2+-S100B under low-salt conditions was evaluated (Kd∼64±15), but due to large amounts of precipitation at high Pnt levels, the stoichiometry was not reliably determined, and this dissociation constant is only considered an estimate. At lower protein concentrations, the fluorescence data were more reliable (Kd = 39±5; nmeasured = 1.8±0.1).
Conditions included 10 mM TES, pH 7.2,15 mM NaCl, 10 mM CaCl2, and 100–400 μM Pnt, at 37 °C with c values ranging from 700 to 1000.
Conditions included 10 mM TES, pH 7.2, 15 mM NaCl, and 10 mM CaCl2, at 37 °C, and the value is from Wilder et al.8
In summary, the thermodynamic data presented here indicate that there are two independent Pnt binding sites with indistinguishable affinities in the Pnt–Ca2+–S100B and Pnt–Zn2+,Ca2+–S100B drug complexes (Table 2). We also demonstrate that Zn2+ had no detectable effect on Pnt binding to Ca2+–S100B, whereas Pnt bound to Ca2+–S100B slightly decreased the affinity of the protein for Zn2+ (<1.3-fold; Table 2).
NMR studies characterizing Pnt binding to S100B
STD experiments and chemical shift perturbations were measured by NMR to further characterize the binding of Pnt to Zn2+,Ca2+–S100B in solution; these results were then compared to similar data recorded previously for Pnt binding to Ca2+–S100B (Fig. 3).31 Only small differences were observed in a comparison of STD data for Pnt bound in the Pnt–Ca2+–S100B and Pnt–Zn2+,Ca2+–S100B complexes, indicating that the H2/H5, H3/H6, and α protons of Pnt were saturated by resonances of S100B in the drug binding site of both Ca2+–S100B and Zn2+,Ca2+–S100B (Fig. 3). That little or no STD was observed for the other protons of Pnt (β and γ) indicated that these protons likely face solvent rather than the binding pocket in both S100B–drug complexes (Fig. 3).42
Fig. 3.

The binding of Pnt to Ca2+–S100B and Zn2+,Ca2+–S100B as monitored by NMR spectroscopy. (a) Structure of Pnt together with the nomenclature used for protons of Pnt. (b and c) STD spectra for Pnt binding to (b) Ca2+–S100B and to (c) Zn2+,Ca2+–S100B. (d and e) Perturbations in 1H and 15N chemical shift values for residues in S100B upon Pnt binding to (d) Ca2+–S100B and to (e) Zn2+,Ca2+–S100B. (f) Differences in chemical shift perturbations when the titrations illustrated in (d) and (e) were compared (i.e., |ΔδCa–S100B + Pnt−ΔδZn,Ca–S100B + Pnt|).
Titrations of Pnt into Ca2+- and Ca2+,Zn2+-bound S100B were compared next by monitoring backbone 1H–15N correlations in 2D 1H–15N heteronuclear single quantum coherence (HSQC) NMR experiments (Fig. 3). In a titration of Pnt into Ca2+–S100B, the 1H–15N HSQC correlations of S100B shifted (>30 Hz; Fig. 3) for several residues in helix 1 (A9, I11, D12, and F14), loop 2 (L40, S41, L44, and E46), and helix 4 (Q71, M74, A75, V77, S78, V80, A83, H85, E89, and H90), as previously observed.31 In a similar titration with Zn2+,Ca2+–S100B plus Pnt, the 1H–15N HSQC correlations of S100B shifted (>30 Hz; Fig. 3) for residues in helix 1 (I11, V13, F14, and H15), loop 2 (L40, S41, H42, L44, and E45), and helix 4 (M74, V77, S78, M79, T82, C84, and E91). When results from these two titrations were compared under identical buffer conditions (i.e., as a ΔΔδ; Fig. 3), Pnt binding did not perturb 1H–15N correlations for the same residues in Ca2+-bound and Zn2+,Ca2+-bound S100B, nor did several of these perturbations occur to the same extent. These results indicated that Pnt bound to Ca2+–S100B differently (i.e., different orientation) and/or affected the conformation of S100B differently than when Pnt bound to Zn2+,Ca2+–S100B.
The X-ray structure of Zn2+,Ca2+–S100B
The structural consequences of Zn2+ binding to Ca2+–S100B was important to characterize because of its potential effect on binding specific protein targets such as p53 and/or small-molecule inhibitors such as Pnt.7,8 With this in mind, the 1.88-Å-resolution X-ray crystal structure for Zn2+,Ca2+–S100B was solved and compared to that of Ca2+–S100B43,44 (Fig. 5). The final asymmetric unit consisted of 90 residues (Met0 to Glu89), 2 calcium ions, 1 zinc ion, and 51 water molecules. The biologically significant model is a dimer composed of the asymmetric unit and a crystallographic symmetry mate. Nearly all of the residues of Zn2+,Ca2+–S100B were in the most favorable region of the Ramachandran plot (95.2%) with the remaining residues (4.8%) falling into the allowed region (Table 1; Fig. 4a).
Fig. 5.
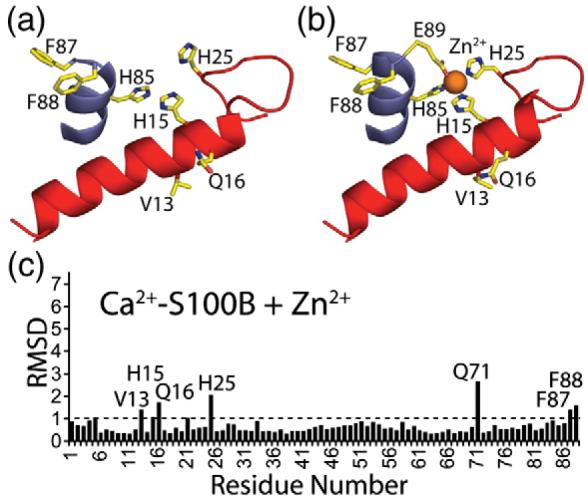
Changes in side-chain positioning upon the binding of Zn2+ to Ca2+–S100B. (a) Residues on helix 4 (blue) and helix 1′ (red) of Ca2+–S100B prior to binding Zn2+. (b) Residues on helix 4 (blue) and helix 1′ (red) of Zn2+,Ca2+–S100B that changed in position upon binding Zn2+. (c) Average RMSDs for the position of side-chain atoms when the Ca2+–S100B and Zn2+,Ca2+–S100B structures are compared. Those residues with average RMSD values greater than 1 are labeled on the bar graph.
Table 1.
Diffraction and refinement statistics
| Zn2+,Ca2+-S100B | Pnt-Ca2+-S100B | Pnt-Zn2+,Ca2+-S100B | |
|---|---|---|---|
| Diffraction statistics | |||
| Space group | C2221 | P41212 | P41212 |
| Cell dimensions: a, b, c (Å) | 34.6, 90.5, 58.3 | 63.6, 63.6, 48.2 | 62.9, 62.9, 50.1 |
| Cell angles: α, β, γ (°) | 90, 90, 90 | 90, 90, 90 | 90, 90, 90 |
| Resolution (Å) | 45.22–1.88 (1.93–1.88) | 44.95–2.15 (2.20–2.15) | 44.46–1.85 (1.90–1.85) |
| No. of unique reflections | 7120 (502) | 5502 (390) | 8456 (560) |
| Completeness (%) | 96.45 (91.90) | 99.98 (99.76) | 98.84 (93.20) |
| Rsyma | 0.056 (0.319) | 0.081 (0.667) | 0.150 (0.489) |
| Average I/σ | 23.4 (4.3) | 32.3 (4.2) | 20.4 (4.2) |
| Multiplicity | 6.6 (5.1) | 12 (12.1) | 12.9 (8.9) |
| Refinement statistics | |||
| Rcrysb(%) | 22.1 (31.1) | 21.1 (25.2) | 19.4 (21.2) |
| Rfreeb(%) | 26.8 (46.7) | 26.6 (26.7) | 24.3 (22.9) |
| Protein atoms | 727 | 729 | 737 |
| Water molecules | 51 | 35 | 82 |
| Non-hydrogen atoms | 768 | 814 | 858 |
| Mean B values (Å2) | |||
| Overall | 49.42 | 35.87 | 40.16 |
| Protein atoms | 50.19 | 35.05 | 39.01 |
| Water molecules | 51.34 | 35.59 | 45.94 |
| Ca2+ typical EF hand | 47.00 | 31.72 | 35.76 |
| Ca2+ S100B EF hand | 46.71 | 35.58 | 35.63 |
| Zn2+ | 50.11 | 43.17 | |
| Pnt site 1 | 53.14c | 49.85d | |
| Pnt site 2 | 43.01c | 67.52d | |
| RMSD | |||
| Bond length (Å) | 0.015 | 0.008 | 0.015 |
| Bond angles (Å) | 1.543 | 1.135 | 1.484 |
| Ramachandran plot (%)e | |||
| Most favored | 95.2 | 95.2 | 96.5 |
| Additionally allowed | 4.8 | 4.8 | 3.5 |
| PDB identification | 3CR2 | 3CR4 | 3CR5 |
Numbers in parentheses represent the last outer shell.
Rsym= ΣhklΣi(|Ihkl,i|-|〈Ihkl〉|)/ΣhklΣiIhkl,i, for a reflection hkl whose weighted mean over i observations is 〈I〉s.
Rcrys and Rfree = Σhkl||F o|-k|Fc||/Σhkl||Fo|, where |Fo| is the observed structure factor amplitude and |Fc| is the calculated structure factor amplitude for the working and test sets, respectively.
Mean B values (Å2) for Pnt in sites 1 and 2 are similar to the mean B value (38.74) for side-chain atoms of S100B involved in Pnt binding (Ile11, Asp12, His42, Cys84, Phe87, and Phe88).
Mean B values (Å2) for Pnt in sites 1 and 2 are similar to the mean B value (45.29) for side-chain atoms of S100B involved in the Pnt binding (Val8, Ile11, Phe43, Cys84, Phe87, and Phe88).
For Zn2+,Ca2+-S100B and Pnt-Ca2+-S100B, the calculations had 80 residues in the most favored region and 4 residues in additionally allowed regions. For Pnt-Zn2+,Ca2+-S100B, the calculations had 82 residues in the most favored region and 3 residues in additionally allowed regions.
Fig. 4.
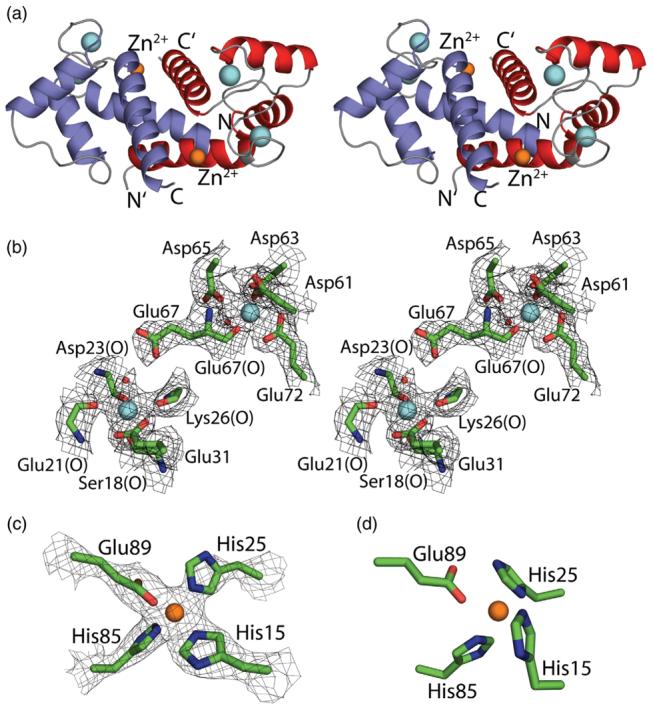
Calcium and zinc ion coordination in the X-ray structure of Zn2+,Ca2+–S100B. (a) X-ray crystal structure of Zn2+,Ca2+–S100B shown in stereo (walleye mode) as a ribbon diagram. The locations of two Ca2+ ions per subunit (cyan spheres) and one Zn2+ ion per subunit (orange spheres) are illustrated, and subunits of the symmetric S100B homodimer are colored red and blue, respectively. (b) Stereo view of the pseudo-EF-hand (Ser18, Glu21, Asp23, Lys26, and Glu31) and the canonical EF-hand (Asp61, Asp63, Asp65, Glu67, and Glu72) calcium-binding sites of S100B together with the 2mFo–DFc electron density map (1.0 σ). (c) Zn2+ coordination in Zn2+,Ca2+–S100B is illustrated together with the 2mFo–DFc electron density map (1.0 σ) defining the positions of His15′/His25′ from one subunit of S100B and His85/Glu89 from the other subunit. (d) Position of Zn2+ coordinating residues of Zn2+,Ca2+–S100B as predicted previously from the NMR solution structure and site-directed mutagenesis.7,8
The global fold of Zn2+,Ca2+–S100B was similar to that reported previously for Ca2+–S100B,43,44 the NMR structure of Zn2+,Ca2+–S100B,8 and several other Ca2+-loaded S100 proteins.2,5 Specifically, each subunit of Zn2+,Ca2+–S100B contained four helices (helix 1, S1–G19; helix 2, K28–L40; helix 3, E49–D61; helix 4, D69–F88) and one small antiparallel β-sheet (strand 1, K26–K28; strand 2, D69–E67) with the dimer interface aligned as a symmetric X-type four-helix bundle comprising helices 1, 1′ and 4, 4′, respectively (Fig. 4a).
As with Ca2+–S100B,43,44 each S100B subunit in Zn2+,Ca2+–S100B has two Ca2+-loaded helix–loop–helix EF hands including an “S100-type” or “pseudo” EF hand comprising helices 1 and 2 and loop 1 and a “typical” EF hand with 12 residues contributed by helices 3 and 4 and loop 3 (Fig. 4). The residues that coordinate calcium in Zn2+,Ca2+–S100B were found to be the same as those reported previously for Ca2+–S100B44 with minimal differences (<0.3 Å) in coordinate distances (Table 3; Fig. 4). Specifically, calcium coordination in the S100 hand of Zn2+,Ca2+–S100B was from four backbone carbonyl oxygen atoms including Ser18 (X position), Glu21 (Y position), Asp23 (Z position), and Lys26 (−Y position); a water molecule (−X position); and the two side-chain carboxylate oxygen atoms of Glu31 (−Z position; bidentate ligand). In the typical EF hand, calcium was coordinated by side-chain carboxylate oxygen atoms of Asp61 (X-position), Asp63 (Y-position), and Asp65 (Z position); the backbone carbonyl of Glu67 (−Y position); a water molecule (−X position); and two side-chain carboxylate oxygen atoms of Glu72 (−Z position; bidentate ligand) (Fig. 4b). As discussed previously,45 a side-chain carboxylate oxygen atom of Glu67 formed a hydrogen bond with a water molecule coorinated to calcium at the −X position of the pseudo-EF hand in Zn2+,Ca2+–S100B (Fig. 4). Importantly, the orientation of helix 3 with respect to helix 4 was found to be in the “open” position in the structures of both Ca2+–S100B (X-rayΩ3/4 =109.9; NMRΩ3/4 = 106 ± 4) and Zn2+,Ca2+-loaded S100B (X-rayΩ3/4 = 109.4; NMRΩ3/4 = 118 ± 2), as necessary for binding protein targets such as p53, hdm4, and CapZ (Figs. 1 and 4; Table 4).8,30,43,44 A slight difference (∼9°) in the relative orientation of helices 3 and 4 was observed in the X-ray structure as compared to the NMR structure of Zn2+,Ca2+–S100B.8 Such a difference may reflect subtle structural differences in solution versus the crystalline state since residual dipolar couplings measured for backbone amide–proton correlations were in better agreement with the NMR family of structures (Q-factor<0.3) than with the X-ray structure (Q-factor>0.4).8 Nonetheless, both the NMR and X-ray structures of Ca2+–S100B and Zn2+,Ca2+–S100B should be useful for engineering novel inhibitors of S100B–target protein interactions.
Table 3.
Divalent metal ion and water coordinate distances
| Ca2+-S100Ba | Zn2+,Ca2+-S100B | Pnt-Ca2+-S100B | Pnt-Zn2+,Ca2+-S100B | |
|---|---|---|---|---|
| Zn2+ | ||||
| His15 (Nε2) | 2.0 | 2.0 | ||
| His25 (Nε2) | 1.9 | 2.2 | ||
| His85 (Nε2) | 2.0 | 2.0 | ||
| Glu89 (Oε1 or Oε2) | 2.0 | 1.9 | ||
| Ca2+, pseudo-EF hand | ||||
| Ser18 (C=O) | 2.0 | 2.3 | 2.3 | 2.3 |
| Glu21 (C=O) | 2.3 | 2.6 | 2.3 | 2.3 |
| Asp23 (C=O) | 2.6 | 2.5 | 2.3 | 2.3 |
| Lys26 (C=O) | 2.3 | 2.3 | 2.4 | 2.3 |
| Glu31 (Oε1,Oε2) | 2.4, 2.6 | 2.3, 2.5 | 2.5, 2.6 | 2.5, 2.6 |
| H2Ob | 2.2 | 2.5 | 2.5 | 2.3 |
| Ca2+, canonical EF hand | ||||
| Asp61 (OΔ1 or Oδ2) | 2.3 | 2.3 | 2.3 | 2.4 |
| Asp63 (Oδ1 or Oδ2) | 2.6 | 2.4 | 2.4 | 2.5 |
| Asp65 (Oδ1 or Oδ2) | 2.3 | 2.6 | 2.4 | 2.4 |
| Glu67 (C=O) | 2.4 | 2.4 | 2.4 | 2.4 |
| Glu72 (Oε1,Oε2) | 2.3, 2.5 | 2.4, 2.7 | 2.5, 2.6 | 2.3, 2.5 |
| H2Oc | 2.4 | 2.3 | 2.3 | 2.4 |
| Ca2+-bound H2O | ||||
| Asp65 (Oδ1 or Oδ2)c | 2.8 | 2.4 | 2.7 | 2.6 |
| Glu67 (Oε1 or Oε2)b | 2.6 | 2.9 | 2.8 | 2.7 |
All distances are in angstroms and are from nitrogen, oxygen, or Ca2+. Distances between the two Ca2+ ions for the Ca2+-S100B, Zn2+,Ca2+-S100B, Pnt-Ca2+-S100B, and Pnt-Zn2+,Ca2+-S100B structures are 11.5, 11.5, 11.4, and 11.4 Å, respectively.
Calculated using PDB entry 1MHO.
H2O ligands to Ca2+ from the pseudo-EF hand.
H2O ligands to Ca2+ from the canonical EF hand.
Table 4.
Interhelical angles and distances
| Interhelical angle (°) |
Interhelical distance (Å) |
|||||||||
|---|---|---|---|---|---|---|---|---|---|---|
| I to II | I to III | I to IV | II to III | II to IV | III to IV | I to I′ | IV to IV′ | I to I′ | IV to IV′ | |
| Ca2+-S100Ba,b | 140 | −121 | 125 | 99 | −32 | 110 | −152 | 150 | 13.7 | 10.0 |
| Zn2+,Ca2+-S100Ba | 142 | −120 | 126 | 97 | −32 | 110 | −151 | 148 | 13.7 | 10.2 |
| Pnt-Ca2+-S100Ba | 139 | −121 | 125 | 99 | −32 | 109 | −152 | 146 | 13.6 | 10.1 |
| Pnt-Zn2+,Ca2+-S100Ba | 139 | −122 | 125 | 98 | −32 | 109 | −151 | 146 | 13.6 | 10.0 |
Interhelical angles were calculated using INTERHLX software (K. Yap, University of Toronto) except for I to I′ and IV to IV′ where the interhelical angles and distances were determined using IHA v1.4 (S.M. Gagne, SMG Software Inc.).
The residues defining each helix of S100B were as follows: helix I, residues 2–18; helix II, residues 29–40; helix III, residues 50–62; and helix IV, residues 70–82.
Calculated using PDB entry 1MHO.
Zn2+ coordination in Zn2+,Ca2+–S100B
Consistent with site-directed mutagenesis and an NMR structure reported previously,7,8 the X-ray structure of Zn2+,Ca2+–S100B has two Zn2+ ions per dimer coordinated in a symmetric manner by His15/His25 of one S100B subunit and His85/Glu89 of the other subunit (Fig. 4)†. The coordination of Zn2+ involves a carboxylate oxygen of Glu89 and nitrogen atoms from the three His residues arranged as a slightly distorted tetrahedral with metal–ligand distances ranging from 1.94 to 2.02 Å and coordinate angles (i.e., O–Zn2+–N and N–Zn2+–N) ranging from 100° to 115° (Fig. 4; Table 3). This coordination geometry is observed in numerous other Zn2+ binding proteins including several S100 proteins.46,47 For the side chain of Glu89, the Zn2+ ion is located in the syn position with the second carboxylate oxygen atom at a distance of 2.74 Å from Zn2+. This second oxygen atom of the Glu89 side chain also contributes somewhat to metal ion coordination as a fifth ligand.
Several residues near the Zn2+ binding site (Val13, His15, Gln16, His25, Phe87, and Phe88) were found to have different side-chain orientations (>1.0 Å RMSD) in Zn2+,Ca2+–S100B when compared to Ca2+–S100B (Fig. 5). The one other side chain positioned differently was Gln71, which forms a hydrogen bond to Thr82 in the Ca2+-bound structure, but in Zn2+,Ca2+–S100B, it is on the surface of the protein and distant from Thr82. Another difference in the two structures is that the side chain for one of the residues that coordinates Zn2+, Glu89, could not be traced in the electron density map of Ca2+–S100B44; however, this side chain was readily observed when Zn2+ was bound (Figs. 4 and 5). Together, these data indicated that the movement and/or stabilization of residues at or nearby the Zn2+ binding site was required for Zn2+ to bind Ca2+-loaded S100B (Fig. 5).
Structures of Pnt bound to Ca2+–S100B and Zn2+,Ca2+–S100B
The X-ray structures of Pnt bound to Ca2+–S100B and Zn2+,Ca2+–S100B were solved at 2.15 and 1.85 Å resolution, respectively (Fig. 6; Table 1). The asymmetric unit for the Pnt–Ca2+–S100B structure included 90 residues (Met0 to Glu89), 2 calcium ions, 2 Pnt molecules, and 35 water molecules (Fig. 6; Table 1). It was evident from visual inspection of the 2mFo–DFc and mFo–DFc electron density maps that the only way to accurately model both Pnt molecules (site 1 and site 2) was to place them in two symmetrical and overlapping orientations with each site having partial occupancies (site 1=0.5, site 2=0.5). The occupancies and temperature factors for the two Pnt orientations at site 1 and site 2 were constrained to be identical owing to the fact that the Pnt molecules reside on a crystallographic 2-fold axis. Thus, the interactions between Pnt and each S100B dimer were identical across the 2-fold axis. Furthermore, the electron density for Pnt bound in sites 1 and 2 was well defined (Fig. 6) with reasonable mean B values (Å2) for bound Pnt molecules (site 1=53.14, site 2=43.01) that were comparable to those of side-chain atoms defining the drug binding sites [Table 1; mean B value (Å2) for side-chain atoms of Asp12, His42, Cys84, Phe87, and Phe88=38.74].
Fig. 6.
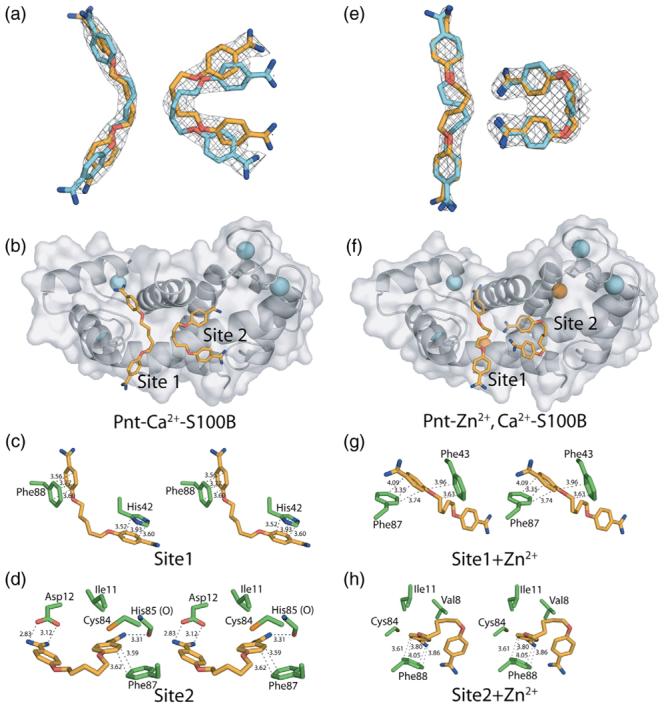
The X-ray structures of Pnt–Ca2+–S100B and Pnt–Zn2+,Ca2+–S100B. (a) The 2mFo–DFc electron density maps (1.0 σ) for two Pnt molecules bound to Ca2+–S100B (left: site 1, right: site 2). Symmetrical and overlapping orientations are shown for Pnt in each site (in orange and cyan) because of their locations at the crystallographic 2-fold axis. (b) Ribbon and surface diagram of Pnt–Ca2+–S100B illustrating the location of Pnt (Pnt, orange; nitrogen, blue; oxygen, red) bound to sites 1 and 2 and Ca2+ (cyan). (c) Residues of S100B that are within 4 Å of Pnt bound to site 1 in the Pnt–Ca2+–S100B complex. (d) Residues of S100B that are within 4 Å of Pnt bound to site 2 in the Pnt–Ca2+–S100B complex. (e) The 2mFo–DFc electron density maps (1.0 σ) for two Pnt molecules bound to Zn2+,Ca2+–S100B (left: site 1, right: site 2). Symmetrical and overlapping orientations are shown for Pnt in each site (in orange and cyan) because of their locations at the crystallographic 2-fold axis. (f) Ribbon and surface diagram of Pnt–Zn2+,Ca2+–S100B illustrating the location of Pnt (Pnt, orange; nitrogen, blue; oxygen, red) bound to sites 1 and 2, Ca2+ (cyan), and Zn2+ (orange). (g) Residues of S100B that are within 4 Å of Pnt bound to site 1 in the Pnt–Zn2+,Ca2+–S100B complex. (h) Residues of S100B that are within 4 Å of Pnt bound to site 2 in the Pnt–Zn2+,Ca2+–S100B complex.
The asymmetric unit for Pnt–Zn2+,Ca2+–S100B had 91 residues (Met0 to His90), 2 calcium ions, 1 zinc ion, 2 Pnt molecules, and 82 water molecules (Fig. 6; Table 1). As for Pnt–Ca2+–S100B, the 2mFo–DFc and mFo–DFc electron density maps for Pnt bound to Zn2+,Ca2+–S100B were also on a crystallographic 2-fold axis and modeled with partial occupancies (site 1=0.3, site 2=0.5). The electron density observed for Pnt bound in sites 1 and 2 of Zn2+,Ca2+–S100B was also well defined (Fig. 6) with mean B values (Å2) for the bound drug molecules (site 1=67.52, site 2=49.85) that were only slightly higher than side-chain atoms of residues interacting with the drug [Table 1; mean B value (Å2) for side-chain atoms of Val8, Ile11, Phe43, Cys84, and Phe87=45.29]. As with the structure of Zn2+,Ca2+–S100B, nearly all of the residues in Pnt–Ca2+–S100B (95.2%) and Pnt–Zn2+,Ca2+–S100B (96.5%) were in the most favorable region of the Ramachandran plot, with the remaining 4.8% and 3.5% of the residues in the allowed region, respectively (Table 1).
Description of the Pnt–Ca2+–S100B complex
The global fold, interhelical angles, and calcium-ion coordination of S100B in the Pnt–Ca2+–S100B complex were very similar to that reported previously for Ca2+–S100B43,44 (Fig. 6; Tables 3-5). However, specific side chains in Ca2+–S100B, including those in helix 1 (Glu2, Lys5, Asp12, Val13, and Gln16), loop 2 (Glu45, Glu49, and Gln50), helix 3 (Glu51 and Lys55), and helix 4 (Gln71, Cys84, Glu86, Phe87, and Phe88), significantly changed position (RMSD>1.0 Å) upon the addition of Pnt (Fig. 7)‡. These changes in S100B structure correspond well with the interactions of two Pnt molecules with S100B observed in the 2mFo–DFc and mFo–DFc electron density maps for Pnt–Ca2+–S100B (arbitrarily termed sites 1 and 2). One Pnt binding site was adjacent to a p53 peptide binding site described previously (site 1; Fig. 6).27,31 The most notable S100B–Pnt interactions in site 1 resulted from hydrophobic stacking of the benzamidine rings of the drug with aromatic side-chain moieties of the protein including Phe88 from the C-terminal loop to ring 1 of Pnt and His42 from the “hinge” region to ring 2 (Fig. 6). For this interaction to occur, the side chain of Phe88 reoriented upon binding Pnt (Fig. 7). The backbone carbonyls of both His42 and Phe43 also lined this Pnt binding site of Ca2+–S100B (<4.0 Å). Importantly, the binding of Pnt to site 1 is consistent with solution NMR data, including an unambiguous intermolecular nuclear Overhauser enhancement between protons of Pnt and Phe88 of S100B.31
Table 5.
EF-hand angles determined using the vector geometry mapping (VGM) method
| N-terminal coordinate of second helix |
Θ (°) | Φ (°) | Ω (°) | |||
|---|---|---|---|---|---|---|
| Pseudo-EF hand | ||||||
| Ca2+-S100Ba,b | 8.2 | −0.2 | −6.8 | 50 | 87 | 109 |
| Zn2+,Ca2+-S100Ba | 8.2 | 0.0 | −6.4 | 50 | 87 | 108 |
| Pnt-Ca2+-S100Ba | 8.3 | −0.1 | −6.5 | 51 | 91 | 107 |
| Pnt-Zn2+,Ca2+-S100Ba | 8.2 | 0.0 | −6.7 | 51 | 90 | 105 |
| Typical EF hand | ||||||
| Ca2+-S100Ba,b | 8.9 | 0.3 | −6.6 | 74 | 102 | 75 |
| Zn2+,Ca2+-S100Ba | 8.8 | −0.2 | −6.8 | 76 | 104 | 75 |
| Pnt-Ca2+-S100Ba | 8.8 | 0.4 | −6.5 | 74 | 104 | 69 |
| Pnt-Zn2+,Ca2+-S100Ba | 8.8 | 0.3 | −6.5 | 75 | 105 | 70 |
VGM angles were calculated by way of VGM software (K. Yap, University of Toronto) using the helices and structures indicated.
The residues used for the VGM calculations were as follows: helix I, residues 10–17; helix II, residues 29–39; helix III, residues 53–60; and helix IV, residues 70–80.
Calculated using PDB entry 1MHO.
Fig. 7.

Changes in side-chain positioning upon the binding of Pnt to Ca2+–S100B or to Zn2+,Ca2+–S100B. (a) Average RMSDs for the position of side-chain atoms when the X-ray structures of Ca2+–S100B and Pnt–Ca2+–S100B are compared. Those residues that have an average RMSD value greater than 1 are labeled, and residues marked with an asterisk (*) are involved with the crystallographic lattice. (b) Residues on helix 4 (blue) and helix 1′ (red) of Ca2+–S100B in the absence and presence of Pnt (orange) illustrating the change in side-chain positioning upon drug binding. (c) Average RMSDs for the position of side-chain atoms when the X-ray structures of Zn2+,Ca2+–S100B and Pnt–Zn2+,Ca2+–S100B are compared. Those residues that have an average RMSD value greater than 1 are labeled, and residues marked with an asterisk (*) are involved with the crystallographic lattice. (d) Residues on helix 4 (blue) and helix 1′ (red) of Zn2+,Ca2+–S100B in the absence and presence of Pnt (orange) illustrating the change in side-chain positioning upon drug binding.
The second Pnt binding site (site 2) of Pnt–Ca2+–S100B was located at the dimer interface in a pocket adjacent to residues that coordinate Zn2+ (Fig. 6). This Pnt binding site was best defined by a bidentate hydrogen bond from the two carboxylate oxygen atoms of Asp12 to protons of the −NH2 moieties of one benzamidine ring (2.8 and 3.1 Å; Fig. 6). The second benzamidine ring of Pnt was found to be stacked with the aromatic side chain of Phe87 in helix 4′ of the other subunit of S100B. In addition, a potential weak hydrogen bond between the backbone carbonyl of His85 and an −NH2 moiety of the second benzamidine ring of Pnt was identified (3.3 Å; Fig. 6). As found for site 1, side-chain moieties that interact with the drug in site 2 (Asp12 and Phe87) rotated into position upon binding Pnt (Fig. 7). Likewise, side-chain atoms of Ile11 and Cys84 and the backbone carbonyl of Cys84 were also proximal to Pnt in site 2 (<4.0 Å), which may contribute to binding.
The Pnt–Zn2+,Ca2+–S100B complex
When the X-ray structures of Zn2+,Ca2+–S100B and Pnt–Zn2+,Ca2+–S100B were compared (mainchainRMSD=0.52), the global fold, interhelical angles, and calciumion coordination were nearly identical (Figs. 4 and 6; Tables 3-5). The two Pnt binding sites on Pnt–Zn2+,Ca2+–S100B were evident in the 2mFo–DFc and mFo−DFc electron density maps of Pnt–Zn2+,Ca2+–S100B, and the drug binding sites in this complex were located in positions analogous to sites 1 and 2 in Pnt–Ca2+–S100B (Fig. 6). As expected, several side chains changed position when Pnt bound to Zn2+,Ca2+–S100B (RMSDN>1.0 Å) including residues in helix 1 (Val8, Asp12, Val13, and Gln16), loop 2 (Lys48), helix 3 (Val53 and Glu58), and helix 4 (Met74, Met79, Cys84, Glu86, and Phe88)‡. However, the residues that changed position in Zn2+,Ca2+–S100B upon the addition of Pnt (Fig. 7d) and/or the magnitude of such changes were notably different when compared to the changes observed in side-chain positioning between Pnt–Ca2+–S100B and Ca2+–S100B (Fig. 7b and d). Furthermore, the conformation and orientation of Pnt in both binding sites of Pnt–Zn2+,Ca2+–S100B were different when compared to the X-ray structure of Pnt–Ca2+–S100B (Figs. 6 and 7). These results were in agreement with the observation that Zn2+ binding to Ca2+–S100B reoriented several residues in helices 1 and 4 that interacted with Pnt binding in the absence of Zn2+ (Figs. 5 and 7). That Pnt could adapt to this Zn2+-induced conformational change and still bind Zn2+,Ca2+–S100B was a novel and unanticipated finding. Supporting this result, small differences were also found in solution when STD data were compared for Pnt bound to Ca2+–S100B versus Zn2+,Ca2+–S100B (<2-fold changes; relative to the largest STD for the α proton; Fig. 3). While the differences in the STD data are not easily quantified,48 they are consistent with having different Pnt orientations as was observed when the X-ray structures for the two drug complexes are compared.
The Pnt molecule in site 1 of Pnt–Zn2+,Ca2+–S100B was relatively extended with little or no bending or kink (Figs. 6 and 7) unlike Pnt bound to site 1 of Pnt–Ca2+–S100B. Furthermore, the S100B–drug interaction in site 1 involved only one of the two benzamidine rings. This interaction was dominated by π electron stacking49 in which one benzamidine ring of Pnt was sandwiched in between two aromatic side chains of Zn2+,Ca2+–S100B (i.e., Phe43 and Phe87; Figs. 6 and 7). Backbone carbonyl oxygen atoms lining the site (<4.0 Å) include those from residues His42, Phe43, and Ala83, which may also contribute to drug binding. In site 2, the Pnt molecule was relatively kinked when compared to drug bound to the analogous site in Pnt–Ca2+–S100B. In addition, Pnt no longer formed a bidentate hydrogen bond with the carboxylate oxygen atoms of Asp12. Rather, a new hydrophobic ring stacking interaction was observed between the benzamidine ring and Phe88, which was rotated into this site (from site 1) upon binding Zn2+. In addition, a potential weak hydrogen bond between Cys84 and an −NH2 moiety of the benzamidine ring of Pnt was identified (3.2 Å; Fig. 6). Side-chain atoms from other hydrophobic residues are also near Pnt in site 2 of Zn2+,Ca2+–S100B including those of Val8 and Ile11. Lastly, the differences observed in the conformation and orientation of Pnt in sites 1 and 2 in the two X-ray structures were consistent with solution NMR studies, which showed differences in chemical shift perturbations when titrations of Pnt into Ca2+–S100B versus Zn2+,Ca2+–S100B were compared (i.e., as a ΔΔδ; Fig. 4).
Discussion
S100B functions as a calcium-activated “switch” (Fig. 1) that undergoes a conformational change as necessary to bind and inhibit the tumor suppressor protein p53.2,30 In addition, S100B binds Zn2+ (one per subunit) at a site separate from the two EF-hand calcium-binding loops. It has been proposed that Zn2+ binding might be important for the biological activity of S100B.7,8,10 Because solution NMR studies did not precisely define the coordination geometry of Zn2+ bound to S100B, we solved the crystal structure of Zn2+,Ca2+–S100B (Fig. 4).7,8 We also obtained details regarding a protein conformational change that was induced by Zn2+ binding to Ca2+-loaded S100B (Fig. 5), which could be important to consider when inhibiting S100B–target protein interactions. Thus, when the X-ray structures of Pnt–Ca2+–S100B and Pnt–Zn2+,Ca2+–S100B were compared (Figs. 6 and 7), we found that two drug molecules (per S100B subunit) bound sites that were similarly located in the two structures; however, the conformation and orientation of Pnt bound in these two sites were very different (±Zn2+). Structural data such as these can now be used to design/synthesize higher-affinity inhibitors that target specific divalent metal ion-bound states of S100B as might be necessary for melanoma where Ca2+ and Zn2+ levels are unregulated.
Zn2+ binding to S100 proteins
It was predicted that the Zn2+ binding site in S100B would be composed of residues from both subunits (subunit 1: His15/His25, subunit 2: His85′/Glu89′).7,8 This coordination scheme was confirmed by our X-ray crystallographic studies (Fig. 4). When the Zn2+ site of S100B [Fig. 4; Protein Data Bank (PDB) code: 3CR2] was compared to other S100 proteins (using S100B numbering), a structurally conserved Zn2+/Cu2+ binding site, distinct from the two EF-hand Ca2+ binding sites, was also observed for S100A7 (Zn2+: His17/Asp24/His86′/His90′; PDB code: 2PSR)46 and S100A12 (Cu2+: His15/Asp25/His85′/His89′; PDB code: 1ODB)50,51 (Fig. 8). As found here for S100B, four of the five ligands (one side-chain carboxylate oxygen; three His nitrogen atoms) from S100A7 and S100A12 coordinate divalent metal ion in a slightly distorted tetrahedral geometry with similar metal ion–ligand distances (∼2 Å). The fifth ligand is at a longer metal ion–ligand distance (>2.5 Å) and is provided by the second side-chain carboxylate oxygen atom of Glu89 in subunit 2 of S100B. In contrast, for S100A7 and S100A12, this more weakly coordinating oxygen ligand was from an aspartate side chain in subunit 1 (S100A7: Asp24, S100A12: Asp25; Fig. 8).
Fig. 8.

> A comparison of Zn2+ or Cu2+ coordination in S100B (Zn2+), S100A7 (Zn2+), and S100A12 (Cu2+). Shown is an overlay of the Zn2+/Cu2+ligands for S100B (green, PDB code: 3CR2), S100A746 (cyan, PDB code: 2PSR), and S100A1250 (violet, PDB code: 1ODB) as determined by X-ray crystallography.
Several other S100 proteins also bind Zn2+ including S100A1,52 S100A2,53 S100A3,54 S100A5,55 S100A6,56,57 and S100P (low affinity),58 but these proteins likely coordinate Zn2+ differently than observed here for S100B, since there is little sequence homology for the Zn2+-liganding residues when compared to S100B, S100A7, or S100A12.47 For S100A8/A9, it was predicted that the heterodimer coordinates Zn2+ in a manner similar to that of S100B, S100A7, and S100A12,59 and as found here for S100B, Zn2+ binding induced a conformational change in the S100A8/A9 heterodimer complex that was distinct from the Ca2+-dependent change.59 Nonetheless, it still remains necessary to directly determine the high-resolution structures for each of these other Zn2+ binding S100 proteins to accurately characterize their coordination geometry and structural changes that occur upon binding Zn2+.
The effects of Zn2+ on Ca2+ and target protein binding to S100B
The biological significance of Zn2+ and/or Cu2+ binding has not yet been fully elucidated for any S100 protein despite the fact that several of these proteins contain structurally homologous Zn2+/Cu2+ binding sites (Fig. 8). It was proposed that antimicrobial activity associated with S100A7 and S100A8/A9 proteins resulted from sequestering free Zn2+ and inhibiting Zn2+-activated enzymes in vivo.59-61 However, the ability of S100 proteins to compete for free Zn2+ is unlikely due to the relatively high dissociation constant of Zn2+ from S100 proteins (i.e., ∼100 nM; Table 2) as compared with most Zn2+-activated enzymes.62,63
It is more likely that Zn2+ binding contributes to S100 function by modulating their Ca2+ and/or target protein interactions as was observed in vitro for several S100 proteins.47 For example, the affinity of S100B for Ca2+ is increased by nearly an order of magnitude in the presence of Zn2+.9,10 One possibility for this observation was that Zn2+ binding caused a conformational change such that Ca2+ ions in the typical and pseudo-EF hands were more optimally coordinated. Such an explanation was ruled out here since no change in calcium coordination in S100B was observed in either EF-hand domain when the crystal structures of Ca2+–S100B and Zn2+,Ca2+–S100B were compared (Fig. 5; Tables 3-5). Another possibility is that perhaps Zn2+ binding to apo–S100B contributes to increased Ca2+ binding; however, this and several other alternate mechanistic explanation(s) for how Zn2+ binding increases Ca2+ binding affinity must now be explored (i.e., effects on Kon, conformational equilibriums, protein dynamics, etc.).
The binding of Zn2+ to Ca2+–S100B has also been reported to increase the affinity of several protein targets for S100B including CapZ,13 the AHNAK protein,15 and the tau protein.14 Likewise, target protein interactions involving S100A6 and S100A11 were of higher affinity when these S100 proteins were bound to Zn2+.12 For S100A1, Zn2+ binding provided more than a 30-fold enhancement in binding the protein target twitchen kinase52 and raised the question of whether Zn2+ binding modulates S100 protein function as part of a more general mechanism in vivo for this family of proteins.4,47 Close examination of conformational change that Zn2+ induced in Ca2+–S100B (Fig. 5) together with the availability of structural data for several target peptide complexes of S100B can provide some insight for how this might occur. For example, the TRTK-12 peptide binds Zn2+,Ca2+–S100B an order of magnitude more tightly than Ca2+–S100B.13 In this S100B–peptide complex, several residues that interact directly with TRTK-12 including Phe87 and Phe88,64 were found to be reoriented when Zn2+ bound to Ca2+–S100B (Fig. 5). Perhaps this Zn2+-induced conformational change in Ca2+–S100B at or nearby the TRTK-12 binding site introduced additional and/or more energetically favorable interaction(s) with the TRTK-12 peptide, although such an explanation needs to be verified by directly examining the structure of Zn2+,Ca2+–S100B bound to a target protein/peptide.
The structures of Pnt bound to Ca2+–-S100B (±Zn2+)
As part of an effort to inhibit S100B, the Food and Drug Administration-approved drug Pnt was characterized by NMR and found to interact with aromatic residues in helix 4 and the C-terminal loop of Ca2+-loaded S100B.31 To pursue this S100B–drug interaction further, we determined the X-ray crystal structures of Pnt bound to Ca2+- and Zn2+, Ca2+-bound S100B in this study. In both complexes, it was discovered that S100B bound two Pnt molecules per S100B subunit with one molecule located adjacent to the p53 peptide binding site (termed site 1), as predicted previously.31 The second Pnt molecule was found to bind to a separate site (site 2), adjacent to a well-characterized Zn2+ binding site on S100B.8 Pnt bound to site 2 was found to interact with residues in helix 1 of one subunit and helix 4′ of the second subunit but had no direct interaction with Zn2+. Nonetheless, a change in the relative orientation of the drug in both sites 1 and 2 was observed when Zn2+ was bound (Fig. 6).
Next, the dependence of calcium on Pnt binding to S100B was examined in detail by comparing the three-dimensional structures of apo–S100B, Ca2+–S100B, Pnt–Ca2+–S100B, and Pnt–Zn2+,Ca2+–S100B (Fig. 9). As observed previously,43 the relative orientation of helix 3, helix 4, and the hinge region (loop 2) is quite different in the apo- and Ca2+-bound states of S100B (Figs. 1 and 9), which could explain the calcium-dependent binding of Pnt to sites 1 and 2. Furthermore, in the absence of calcium, a large portion of both Pnt sites 1 and 2 was occluded by several side chains of S100B including Glu46 and His90 (Fig. 9). As a result, two residues (His42 and Phe88) that approach each other in Ca2+–S100B (8 Å) and then ring stack with Pnt in site 1 of the Pnt–Ca2+–S100B complex are completely separated in the apo state (>16 Å; Fig. 9). In site 2, additional changes are observed upon the addition of calcium. Specifically, in the apo structure, His90 is in a location that occludes much of site 2, and Phe87, another important residue for binding Pnt in site 2, is ring stacked with Phe88 and unavailable to interact with the drug. Upon binding Ca , the position of His90 becomes uncertain, likely due to dynamic properties of the protein, and a drug-binding pocket appears, which includes Asp12, a residue that forms a bidentate hydrogen bond with the amidine moiety of Pnt. Ring stacking between Phe87 and Phe88 is also disrupted when Pnt binds Ca2+–S100B such that Phe88 interacts with Pnt in site 1 and Phe87 interacts with Pnt in site 2. While additional protein conformational changes occur upon the addition of Zn2+, Pnt molecules are remarkably adaptive and still bind both sites 1 and 2 with an affinity similar to that when only Ca2+ was present (Figs. 6 and 9; Table 2).
Fig. 9.

The calcium dependence of Pnt binding to S100B. Shown are ribbon/surface diagrams of apo–S100B (NMR, PDB code: 1B4C; top left), Ca2+–S100B (X-ray, PDB code: 1MHO; top right), Pnt–Ca2+–S100B (X-ray, PDB code: 3CR4; bottom right), and Pnt–Zn2+,Ca2+–S100B (X-ray, PDB code: 3CR5; bottom left). A hydrogen bond between His90 and Glu46 (red) that occludes both Pnt binding sites (residues in sites 1 and 2 are colored green) is observed in apo–S100B (top left). Upon binding Ca2+ (top right), helix 3 reorients (see Fig. 1) and Glu46 is rotated out to the surface of the protein and His90 becomes dynamic and unobservable. Residues involved in Pnt binding two sites on S100B (highlighted in green) start to become localized as necessary for formation of the Pnt–Ca2+–S100B complex (lower right). Upon binding Zn2+,a second conformational change occurs, and surprisingly, Pnt is still able to bind both sites 1 and 2 (see also Figs. 6 and 7).
Summary
Overall, a comparison of the X-ray crystal structures of Ca2+–S100B and Zn2+,Ca2+–S100B showed for the first time that Zn2+ binding had no discernable effect on Ca2+ ion coordination in either the pseudo- or the typical EF-hand calcium-binding domains. Although the binding of Zn2+ did induce a conformational change in Ca2+–S100B that affected the protein's structure in regions where target proteins bind (i.e., for residues at or nearby Phe87 and Phe88 in helix 4). These differences in S100B structure, in turn, affected the conformation and orientation of two Pnt molecules bound to analogous sites on Ca2+–S100B and Zn2+,Ca2+–S100B. Together, the structural studies presented here will likely impact the design of new S100B inhibitors, which could have therapeutic value for the treatment of cancers with elevated S100B such as malignant melanoma.
Materials and Methods
Materials
All chemicals and reagents were American Chemical Society grade or higher and typically purchased from Sigma-Aldrich unless otherwise indicated. 15NH4Cl was purchased from Cambridge Isotope Laboratories (Andover, MA). All buffers were passed through Chelex-100 resin to remove trace metals prior to use.
Bacterial expression and purification of the wild-type S100B
Recombinant S100B protein (rat, bovine) was expressed in Escherichia coli [HMS174(DE3) strain] and purified as previously described.43 Yields of S100B protein were typically 20–30 mg of purified protein per liter of bacterial culture. For NMR experiments, S100B protein was prepared using defined media that included 15N-labeled NH4Cl as the only nitrogen source.43
NMR spectroscopy
Purified 15N-labeled S100B was dialyzed against 0.1 mM 2-{[2-hydroxy-1,1-bis(hydroxymethyl)ethyl] amino}ethanesulfonic acid (Tes), pH 7.2, and 0.05 mM DTT; lyophilized; and hydrated in a small aliquot of ddH2O (deionized and doubly distilled H2O) and stored at −80 or −20 °C. The Ca2+-loaded S100B–Pnt NMR sample was prepared in a manner similar to that previously described31 and contained 0.5 mM S100B subunit concentration, 0.5–0.75 mM Pnt, 0.34 mM NaN3, 15 mM NaCl, 0–5% d6-dimethyl sulfoxide, 10–15 mM CaCl2, 10% D2O, and 10 mM Tes buffer and adjusted to pH 7.2 with HCl. As described previously, 0.7 mM ZnAc was added to Ca2+–S100B, and the resonance assignments determined previously for Zn2+,Ca2+–S100B were confirmed.7 These chemical shift assignments were then used as a starting point during titrations with Pnt to assign the 2D 1H–15N HSQC spectra of S100B in the Pnt–Zn2+, Ca2+–S100B complex.65
Group epitope mapping via STD NMR was completed for the Pnt–Zn2+,Ca2+–S100B complex in a manner similar to that described previously for Pnt–Ca2+–S100B.66 Specifically, during the 2-s presaturation pulse, the onresonance irradiation of the protein was performed at a chemical shift of −0.4 ppm and the off-resonance irradiation was applied at 30 ppm, where no protein signals were present. As a control, the STD experiments were collected in the absence of a T1ρ filter, and as expected, the 1D spectrum of holo–S100B was fully restored. The final sample contained either 60 μM ZnAc or no ZnAc and 50 μM S100B, 500 μM Pnt, 10 mM CaCl2, 5% d6-dimethyl sulfoxide, 99.98% D2O, 15 mM NaCl, 100 mM KCl, 0.34 mM NaN3, and 10 mM Tris-d11, pH 7.2. The STD data were collected at 25 °C to achieve more efficient saturation of the protein. Proton assignments of Pnt were confirmed in the above conditions in the absence and presence of S100B using 2D total correlated spectroscopy experiments.67
HSQC NMR data were collected at 37 °C with a Bruker Avance III 600 (600.13 MHz for protons) or with an Avance 800 US2 (800.27 MHz for protons) NMRspectrometer both equipped with pulsed-field gradients, four frequency channels, and triple-resonance, z-axis gradient cryogenic probes.65 Data were processed with NMRPipe,68 and proton chemical shifts were reported with respect to the H2O or HDO signal taken as 4.658 ppm relative to external trimethylsilylpropionic acid (0.0 ppm). The 15N chemical shifts were indirectly referenced as previously described using the following ratio of the zero-point frequency: 0.10132905 for 15N to 1H.69-71
Thermodynamic binding studies
The calcium-dependent interaction between S100B and Pnt was monitored in titrations of S100B into Pnt (100 μM) and by measuring increases in Pnt fluorescence intensity at 345 nm (λex=262 and 299 nm). The fluorescence data were collected on a Varian Cary Eclipse fluorescence spectrophotometer with the temperature maintained at 37 °C using a circulating constant-temperature bath. All measurements were performed in quartz cuvettes with buffer containing 10 mM Tes, pH 7.2, 15 mM NaCl, 0–100 mM KCl, 0–10 mM CaCl2, and 0–500 μM ZnAc. Binding of Pnt to Ca2+–S100B and Zn2+,Ca2+–S100B was also examined via ITC with a VP-ITC titration microcalorimeter (MicroCal, Inc., Northampton, MA), as described previously.7 For ITC, all S100B and Pnt solutions were degassed under vacuum for 5 min and equilibrated at 37 °C prior to use. The reference cell contained ddH2O, and the sample cell (1.4 mL) contained 10–50 mM Tes at pH 7.2, 15 mM NaCl, 0–100 mM KCl, 10 mM CaCl2, 0–100 μM ZnCl2, and 0.1 mM S100B. Upon equilibration, a 2.5- to 5-mM Pnt solution prepared in the same buffer as above (without S100B) was injected in 5-μL aliquots with a 300-s interval between each injection. In all titrations containing Zn2+, the Zn2+-to-S100B subunit ratio did not exceed 1:1 to avoid precipitation. The resulting titration curves were corrected for the protein-free buffer control and analyzed using the Origin for ITC software supplied by MicroCal, Inc.
Protein crystallization
Bovine S100B protein was dialyzed into buffer (0.1 mM Tes, pH 7.2, and 0.05 mM DTT), lyophilized, dissolved in ddH2O to 80–100 mg/mL (∼8–10 mM subunit concentration), and stored frozen. Diffraction quality crystals for the Zn2+,Ca2+–S100B complex were obtained by sitting drop vapor diffusion at 22 °C by mixing 2 μL of S100B protein (40 mg/mL S100B, 7.5 mM CaCl2, 3.8 mM ZnAc2, and 20 mM cacodylate buffer, pH 7.2) with 2 μL of reservoir solution [7.5 mM CaCl2, 0.1 M cacodylate buffer, pH 6.5, and 28% polyethylene glycol (PEG) 3350] and equilibrating for 2–3 days. After crystals formed, they were cryoprotected in a harvest solution (7.5 mM CaCl2, 3.8 mM ZnAc2, 0.1 M cacodylate buffer, pH 6.5, 30% PEG3350, and 5% glycerol) for 30–60 s and then flashcooled in liquid nitrogen. The Pnt–Ca2+–S100B and Pnt–Ca2+,Zn2+–S100B complexes were crystallized in a similar manner using complex-specific protein buffers (Pnt–Ca2+–S100B: 40 mg/mL S100B, 7.5 mM CaCl2, 3.8 mM Pnt, and 20 mM cacodylate buffer, pH 7.2; Pnt–Ca2+,Zn2+–S100B: 40 mg/mL S100B, 7.5 mM CaCl2, 3.8 mM ZnAc2, 3.8 mM Pnt, and 20 mM cacodylate buffer, pH 7.2), reservoir solutions (Pnt–Ca2+–S100B: 7.5 mM CaCl2, 0.1 M cacodylate buffer, pH 7.8, and 26% PEG3350; Pnt–Ca2+,Zn2+–S100B: 7.5mMCaCl2, 0.1Mcacodylate buffer, pH 7.6, and 22% PEG3350), and harvest solutions (Pnt–Ca2+–S100B: 7.5 mM CaCl2, 3.8 mM Pnt, 0.1 M cacodylate buffer, pH 7.8, 28% PEG3350, and 5% glycerol; Pnt–Ca2+,Zn2+–S100B: 7.5 mM CaCl2, 3.8 mM ZnAc2, 3.8 mM Pnt, 0.1 M cacodylate buffer, pH 7.6, 24% PEG3350, and 5% glycerol). Space groups and unit cell parameters are given in Table 1. Each of the above crystal forms had one S100B subunit in the asymmetric unit.
X-ray data collection, model building, and refinement
X-ray data for the Zn2+,Ca2+–S100B and Pnt–Zn2+,Ca2+–S100B crystals were collected remotely at the 9-1 beamline (Stanford Synchrotron Radiation Laboratory, Menlo Park, CA) using an ADSC Quantum-315R CCD detector (Area Detector Systems Corporation, Poway, CA). X-ray data for Pnt–Ca2+–S100B were collected at 100 K using an in-house X-ray generator (MSC Micromax 7; Rigaku Texas, USA) and a Raxis-4++ image plate detector (Rigaku Texas). The reflection intensities were integrated and scaled with the HKL2000 suite of computer programs.72 The crystals of Zn2+,Ca2+–S100B, Pnt–Ca2+–S100B, and Pnt–Zn2+,Ca2+–S100B diffracted to 1.88, 2.15, and 1.85 Å resolution, respectively. Preliminary phases were obtained via molecular replacement techniques using the structure of Ca2+-bound S100B (PDB code: 1MHO;44) as a search model and the computer program Molrep and/or Phaser from the CCP4 program suite.73 Model building and refinement of S100B were completed using REFMAC5 and COOT.74,75 The locations of the two Pnt molecules and several water molecules were determined by visual inspection of 2mFo–DFc and mFo–DFc electron density maps with the program COOT.75 It was evident from visual inspection of the 2mFo–DFc and mFo–DFc electron density maps that the only way to accurately model the bound Pnt in site 1 was to place the molecule in two overlapping orientations, each with partial occupancy. We determined the final occupancy for Pnt orientation in the Ca2+–S100B and Zn2+,Ca2+–S100B of site 1 to be 0.5 and 0.3, giving a total occupancy for Pnt at that site of 1.0 and 0.6, respectively. The occupancy was set manually and the value was chosen because higher or lower values resulted in positive or negative difference density around the drug. The occupancies and temperature factors for the two Pnt orientations at site 1 were constrained to be identical owing to the fact that the Pnt resides on a crystallographic 2-fold axis. Modeling of Pnt at site 2 was similar to that at site 1, with two molecules having overlapping orientations with occupancies of 0.5, resulting in a total occupancy of 1.0 for Pnt in site 2. As it turned out, the occupancies in site 1 varied while those in site 2 were found to be similar for both Pnt–S100B complex structures (i.e., Pnt–Ca2+–S100B and Pnt–Zn2+,Ca2+–S100B), whereas the temperature factors for the Pnt molecules at those sites varied between the two complexes (Table 1). The stereochemistry was checked with the programs WHATCHECK and PROCHEK,76,77 and interhelix angles and distances were calculated using the programs INTERHLX,78 VGM,78 and IHA.79 The quaternary structure and accessible surface areas were analyzed using the PISA server§. Figures were generated with the program PyMOL∥.
Acknowledgements
This work was supported by grants from the National Institutes of Health [GM58888 and CA107331 (to D.J.W.)], the American Cancer Society [CDD107745 (to D.J.W.)], and The University of Maryland Drug Design Center.
Abbreviations used
- Pnt
pentamidine
- ITC
isothermal titration calorimetry
- PEG
polyethylene glycol
- HSQC
heteronuclear single quantum coherence
- STD
saturation transfer difference
- Tes
2-{[2-hydroxy-1,1-bis (hydroxymethyl)ethyl]amino}ethanesulfonic acid
- ddH2O
deionized and doubly distilled H2O
- PDB
Protein Data Bank
- VGM
vector geometry mapping
Footnotes
In solution, long-range HSQC data indicated that the Nε2 of both His15 and His85 and the Nδ1 of His25 were available to coordinate zinc,8 whereas in the X-ray structure, all three of these His residues were found to coordinate Zn2+ via Nε2 (Fig. 4). Attempts to model His25 coordination via Nδ1 were not successful in refinement of the X-ray structure. That the long-range HSQC data for His25 were somewhat broadened in the Zn2+,Ca2+-bound form provided some indication that His25 is mobile on the chemical shift timescale, perhaps because both Zn2+ coordination geometries (via Nδ1 and Nε2) are possible in solution.
It could not be ruled out that different crystal lattice contacts in the Ca2+–S100B and Pnt–Ca2+–S100B structures [Ca2+–S100B: K29–E34, 2.66 Å; D54–R20, 2.88 Å; E51–K24, 2.75 Å; N38–D54, 2.88 Å; Pnt–Ca2+–S100B: K28–E58(O), 2.63 Å; E21–S62, 2.67 Å; G22(NH)–S62(O), 2.67 Å] caused the differences in side-chain positioning at and/or nearby residues Lys24, Lys28, Lys29, Glu49, Gln50, Glu51, Lys55, and Glu58 (Fig. 7). Likewise, it could not be ruled out that different crystal lattice contacts in the Zn2+,Ca2+–S100B and Pnt–Zn ,Ca2+–S100B structures [Zn2+,Ca2+–S100B: K29–E34, 3.11 Å; D54–R20, 2.65 Å; K29–N38, 2.95 Å; N38–D54, 3.02 Å; Pnt–Zn2+,Ca2+–S100B: K28–E58 (O), 2.73 Å; E21–S62, 2.80 Å; G22(NH)–S62(O), 2.66 Å; K5–E89, 2.70 Å; E2–H90, 2.67 Å] affected side-chain positioning at and/or nearby residues Glu21, Lys28, Lys29, Leu32, Glu34, Lys58, Val53, Glu58, and Phe88 (Fig. 7).
References
- 1.Moore B. A soluble protein characteristic of the nervous system. Biochem. Biophys. Res. Commun. 1965;1:739–744. doi: 10.1016/0006-291x(65)90320-7. [DOI] [PubMed] [Google Scholar]
- 2.Weber DJ, Rustandi RR, Carrier F, Zimmer DB. Interaction of dimeric S100B(ββ) with the tumor suppressor protein: a model for Ca-dependent S100-target protein interactions. In: Pochet R, editor. The Molecular Basis of Calcium Action in Biology and Medicine. Kluwer Academic Publishers; Dordrecht, The Netherlands: 2000. [Google Scholar]
- 3.Donato R. Intracellular and extracellular roles of S100 proteins. Microsc. Res. Tech. 2003;60:540–551. doi: 10.1002/jemt.10296. [DOI] [PubMed] [Google Scholar]
- 4.Heizmann CW. The multifunctional S100 protein family. Methods Mol. Biol. 2002;172:69–80. doi: 10.1385/1-59259-183-3:069. [DOI] [PubMed] [Google Scholar]
- 5.Santamaria-Kisiel L, Rintala-Dempsey AC, Shaw GS. Calcium-dependent and -independent interactions of the S100 protein family. Biochem. J. 2006;396:201–214. doi: 10.1042/BJ20060195. [DOI] [PMC free article] [PubMed] [Google Scholar]
- 6.Rustandi RR, Drohat AC, Baldisseri DM, Wilder PT, Weber DJ. The Ca2+-dependent interaction of S100B with a peptide derived from p53. Biochemistry. 1998;37:1951–1960. doi: 10.1021/bi972701n. [DOI] [PubMed] [Google Scholar]
- 7.Wilder PT, Baldisseri DM, Udan R, Vallely KM, Weber DJ. Location of the Zn(2+)-binding site on S100B as determined by NMR spectroscopy and site-directed mutagenesis. Biochemistry. 2003;42:13410–13421. doi: 10.1021/bi035334q. [DOI] [PubMed] [Google Scholar]
- 8.Wilder PT, Varney KM, Weiss MB, Gitti RK, Weber DJ. Solution structure of zinc- and calcium-bound rat S100B as determined by nuclear magnetic resonance spectroscopy. Biochemistry. 2005;44:5690–5702. doi: 10.1021/bi0475830. [DOI] [PubMed] [Google Scholar]
- 9.Baudier J, Gerard D. Ions binding to S100 proteins: structural changes induced by calcium and zinc on S100a and S100b proteins. Biochemistry. 1983;22:3360–3369. doi: 10.1021/bi00283a009. [DOI] [PubMed] [Google Scholar]
- 10.Baudier J, Glasser N, Gerard D. Ions binding to S100 proteins. I. Calcium- and zinc-binding properties of bovine brain S100αα, S100a (αβ), and S100b (ββ) protein: Zn2+ regulates Ca2+ binding on S100b protein. J. Biol. Chem. 1986;261:8192–8203. [PubMed] [Google Scholar]
- 11.Baudier J, Haglid K, Haiech J, Gerard D. Zinc ion binding to human brain calcium binding proteins, calmodulin and S100b protein. Biochem. Biophys. Res. Commun. 1983;114:1138–1146. doi: 10.1016/0006-291x(83)90681-2. [DOI] [PubMed] [Google Scholar]
- 12.Deloulme JC, Assard N, Mbele GO, Mangin C, Kuwano R, Baudier J. S100A6 and S100A11 are specific targets of the calcium- and zinc-binding S100B protein in vivo. J. Biol. Chem. 2000;275:35302–35310. doi: 10.1074/jbc.M003943200. [DOI] [PubMed] [Google Scholar]
- 13.Barber KR, McClintock KA, Jamieson GA, Jr, Dimlich RV, Shaw GS. Specificity and Zn2+ enhancement of the S100B binding epitope TRTK-12. J. Biol. Chem. 1999;274:1502–1508. doi: 10.1074/jbc.274.3.1502. [DOI] [PubMed] [Google Scholar]
- 14.Baudier J, Cole RD. Interactions between the microtubule-associated tau proteins and S100b regulate tau phosphorylation by the Ca2+/calmodulin-dependent protein kinase II. J. Biol. Chem. 1988;263:5876–5883. [PubMed] [Google Scholar]
- 15.Gentil BJ, Delphin C, Mbele GO, Deloulme JC, Ferro M, Garin J, Baudier J. The giant protein AHNAK is a specific target for the calcium-and zinc-binding S100B protein: potential implications for Ca2+ homeostasis regulation by S100B. J. Biol. Chem. 2001;276:23253–23261. doi: 10.1074/jbc.M010655200. [DOI] [PubMed] [Google Scholar]
- 16.Zimmer DB, Cornwall EH, Landar A, Song W. The S100 protein family: history, function, and expression. Brain Res. Bull. 1995;37:417–429. doi: 10.1016/0361-9230(95)00040-2. [DOI] [PubMed] [Google Scholar]
- 17.Hansson LO, Vonschoultz E, Djureen E, Hansson J, Nilsson B, Ringborg U. Prognostic value of serum analyses of S100 protein beta in malignant melanoma. Anticancer Res. 1997;17:3071–3073. [PubMed] [Google Scholar]
- 18.Maelandsmo GM, Florenes VA, Mellingsaeter T, Hovig E, Kerbel RS, Fodstad O. Differential expression patterns of S100A2, S100A4 and S100A6 during progression of human malignant melanoma. Int. J. Cancer. 1997;74:464–469. doi: 10.1002/(sici)1097-0215(19970822)74:4<464::aid-ijc19>3.0.co;2-9. [DOI] [PubMed] [Google Scholar]
- 19.Boni R, Heizmann CW, Doguoglu A, Ilg EC, Schafer BW, Dummer R, Burg G. Ca2+-binding proteins S100A6 and S100B in primary cutaneous melanoma. J. Cutaneous Pathol. 1997;24:76–80. doi: 10.1111/j.1600-0560.1997.tb01100.x. [DOI] [PubMed] [Google Scholar]
- 20.Camby I, Lefranc F, Titeca G, Neuci S, Fastrez M, Dedecken L, et al. Differential expression of S100 calcium-binding proteins characterizes distinct clinical entities in both WHO grade II and III astrocytic tumours. Neuropathol. Appl. Neurobiol. 2000;26:76–90. doi: 10.1046/j.1365-2990.2000.00223.x. [DOI] [PubMed] [Google Scholar]
- 21.Camby I, Nagy N, Lopes MB, Schafer BW, Maurage CA, Ruchoux MM, et al. Supratentorial pilocytic astrocytomas, astrocytomas, anaplastic astrocytomas and glioblastomas are characterized by a differential expression of S100 proteins. Brain Pathol. 1999;9:1–19. doi: 10.1111/j.1750-3639.1999.tb00205.x. [DOI] [PMC free article] [PubMed] [Google Scholar]
- 22.Davey GE, Murmann P, Heizmann CW. Intracellular Ca2+ and Zn2+ levels regulate the alternative cell density-dependent secretion of S100B in human glioblastoma cells. J. Biol. Chem. 2001;276:30819–30826. doi: 10.1074/jbc.M103541200. [DOI] [PubMed] [Google Scholar]
- 23.Hauschild A, Engel G, Brenner W, Glaser R, Monig H, Henze E, Christophers E. Predictive value of serum S100B for monitoring patients with metastatic melanoma during chemotherapy and/or immunotherapy. Br. J. Dermatol. 1999;140:1065–1071. doi: 10.1046/j.1365-2133.1999.02905.x. [DOI] [PubMed] [Google Scholar]
- 24.Hauschild A, Engel G, Brenner W, Glaser R, Monig H, Henze E, Christophers E. S100B protein detection in serum is a significant prognostic factor in metastatic melanoma. Oncology. 1999;56:338–344. doi: 10.1159/000011989. [DOI] [PubMed] [Google Scholar]
- 25.Hauschild A, Michaelsen J, Brenner W, Rudolph P, Glaser R, Henze E, Christophers E. Prognostic significance of serum S100B detection compared with routine blood parameters in advanced metastatic melanoma patients. Melanoma Res. 1999;9:155–161. doi: 10.1097/00008390-199904000-00008. [DOI] [PubMed] [Google Scholar]
- 26.Baudier J, Delphin C, Grunwald D, Khochbin S, Lawrence JJ. Characterization of the tumor suppressor protein p53 as a protein kinase C substrate and an S100b-binding protein. Proc. Natl Acad. Sci. USA. 1992;8:11627–11631. doi: 10.1073/pnas.89.23.11627. [DOI] [PMC free article] [PubMed] [Google Scholar]
- 27.Rustandi RR, Baldisseri DM, Weber DJ. Structure of the negative regulatory domain of p53 bound to S100B. Nat. Struct. Biol. 2000;7:570–574. doi: 10.1038/76797. [DOI] [PubMed] [Google Scholar]
- 28.Delphin C, Ronjat M, Deloulme JC, Garin G, Debussche L, Higashimoto Y, et al. Calcium-dependent interaction of S100B with the C-terminal domain of the tumor suppressor p53. J. Biol. Chem. 1999;274:10539–10544. doi: 10.1074/jbc.274.15.10539. [DOI] [PubMed] [Google Scholar]
- 29.Lin J, Yang Q, Yan Z, Markowitz J, Wilder PT, Carrier F, Weber DJ. Inhibiting S100B restores p53 levels in primary malignant melanoma cancer cells. J. Biol. Chem. 2004;279:34071–34077. doi: 10.1074/jbc.M405419200. [DOI] [PubMed] [Google Scholar]
- 30.Wilder PT, Lin J, Bair CL, Charpentier TH, Yang D, Liriano M, et al. Recognition of the tumor suppressor protein p53 and other protein targets by the calcium-binding protein S100B. Biochim. Biophys. Acta. 2006;1763:1284–1297. doi: 10.1016/j.bbamcr.2006.08.024. [DOI] [PubMed] [Google Scholar]
- 31.Markowitz J, Chen I, Gitti R, Baldisseri DM, Pan Y, Udan R, et al. Identification and characterization of small molecule inhibitors of the calcium-dependent S100B–p53 tumor suppressor interaction. J. Med. Chem. 2004;47:5085–5093. doi: 10.1021/jm0497038. [DOI] [PubMed] [Google Scholar]
- 32.Markowitz J, Mackerell AD, Jr, Carrier F, Charpentier TH, Weber DJ. Design of inhibitors for S100B. Curr. Top. Med. Chem. 2005;5:1093–1108. doi: 10.2174/156802605774370865. [DOI] [PubMed] [Google Scholar]
- 33.Markowitz J, MacKerell AD, Jr, Weber DJ. A search for inhibitors of S100B, a member of the S100 family of calcium-binding proteins. Mini Rev. Med. Chem. 2007;7:609–616. doi: 10.2174/138955707780859422. [DOI] [PubMed] [Google Scholar]
- 34.Borovansky J, Riley PA, Vrankova E, Necas E. The effect of zinc on mouse melanoma growth in vitro and in vivo. Neoplasma. 1985;32:401–406. [PubMed] [Google Scholar]
- 35.Gorodetsky R, Sheskin J, Weinreb A. Iron, copper, and zinc concentrations in normal skin and in various nonmalignant and malignant lesions. Int. J. Dermatol. 1986;25:440–445. doi: 10.1111/j.1365-4362.1986.tb03449.x. [DOI] [PubMed] [Google Scholar]
- 36.Ros-Bullon MR, Sanchez-Pedreno P, Martinez-Liarte JH. Serum zinc levels are increased in melanoma patients. Melanoma Res. 1998;8:273–277. [PubMed] [Google Scholar]
- 37.Prasad KN, Ahrens CR, Barrett JM. Homeostasis of zinc and iron in mouse B16 melanoma. Cancer Res. 1969;2:1019–1023. [PubMed] [Google Scholar]
- 38.Lin J, Blake M, Tang C, Zimmer D, Rustandi RR, Weber DJ, Carrier F. Inhibition of p53 transcriptional activity by the S100B calcium-binding protein. J. Biol. Chem. 2001;276:35037–35041. doi: 10.1074/jbc.M104379200. [DOI] [PubMed] [Google Scholar]
- 39.Wilson D, Varigos G, Ackland ML. Apoptosis may underlie the pathology of zinc-deficient skin. Immunol. Cell Biol. 2006;84:28–37. doi: 10.1111/j.1440-1711.2005.01391.x. [DOI] [PubMed] [Google Scholar]
- 40.Velazquez-Campoy A, Todd MJ, Freire E. HIV-1 protease inhibitors: enthalpic versus entropic optimization of the binding affinity. Biochemistry. 2000;3:2201–2207. doi: 10.1021/bi992399d. [DOI] [PubMed] [Google Scholar]
- 41.Jelesarov I, Bosshard HR. Isothermal titration calorimetry and differential scanning calorimetry as complementary tools to investigate the energetics of biomolecular recognition. J. Mol. Recognit. 1999;12:3–18. doi: 10.1002/(SICI)1099-1352(199901/02)12:1<3::AID-JMR441>3.0.CO;2-6. [DOI] [PubMed] [Google Scholar]
- 42.Meyer B, Klein J, Mayer M, Meinecke R, Moller H, Neffe A, et al. Saturation transfer difference NMR spectroscopy for identifying ligand epitopes and binding specificities. Ernst Schering Res. Found. Workshop. 2004;44:149–167. doi: 10.1007/978-3-662-05397-3_9. [DOI] [PubMed] [Google Scholar]
- 43.Drohat AC, Baldisseri DM, Rustandi RR, Weber DJ. Solution structure of calcium-bound rat S100B as determined by nuclear magnetic resonance spectroscopy. Biochemistry. 1998;37:2729–2740. doi: 10.1021/bi972635p. [DOI] [PubMed] [Google Scholar]
- 44.Matsumura H, Shiba T, Inoue T, Harada S, Kai Y. A novel mode of target recognition suggested by the 2.0 Å structure of holo S100B from bovine brain. Structure. 1998;6:233–241. doi: 10.1016/s0969-2126(98)00024-0. [DOI] [PubMed] [Google Scholar]
- 45.Otterbein LR, Kordowska J, Witte-Hoffmann C, Wang CL, Dominguez R. Crystal structures of S100A6 in the Ca(2+)-free and Ca(2+)-bound states: the calcium sensor mechanism of S100 proteins revealed at atomic resolution. Structure. 2002;10:557–567. doi: 10.1016/s0969-2126(02)00740-2. [DOI] [PubMed] [Google Scholar]
- 46.Brodersen DE, Nyborg J, Kjeldgaard M. Zinc-binding site of an S100 protein revealed. Two crystal structures of Ca2+-bound human psoriasin (S100A7) in the Zn2+-loaded and Zn2+-free states. Biochemistry. 1999;38:1695–1704. doi: 10.1021/bi982483d. [DOI] [PubMed] [Google Scholar]
- 47.Heizmann CW, Cox JA. New perspectives on S100 proteins: a multi-functional Ca(2+)-, Zn(2+)- and Cu(2+)-binding protein family. BioMetals. 1998;11:383–397. doi: 10.1023/a:1009212521172. [DOI] [PubMed] [Google Scholar]
- 48.Yan J, Kline AD, Mo H, Shapiro MJ, Zartler ER. The effect of relaxation on the epitope mapping by saturation transfer difference NMR. J. Magn. Reson. 2003;163:270–276. doi: 10.1016/s1090-7807(03)00106-x. [DOI] [PubMed] [Google Scholar]
- 49.Burley SK, Petsko GA. Aromatic-aromatic interaction: a mechanism of protein structure stabilization. Science. 1985;22:23–28. doi: 10.1126/science.3892686. [DOI] [PubMed] [Google Scholar]
- 50.Moroz OV, Antson AA, Grist SJ, Maitland NJ, Dodson GG, Wilson KS, et al. Structure of the human S100A12–copper complex: implications for host-parasite defence. Acta Crystallogr., Sect. D: Biol. Crystallogr. 2003;5:859–867. doi: 10.1107/s0907444903004700. [DOI] [PubMed] [Google Scholar]
- 51.Moroz OV, Dodson GG, Wilson KS, Lukanidin E, Bronstein IB. Multiple structural states of S100A12: a key to its functional diversity. Microsc. Res. Tech. 2003;60:581–592. doi: 10.1002/jemt.10300. [DOI] [PubMed] [Google Scholar]
- 52.Heierhorst J, Mann RJ, Kemp BE. Interaction of the recombinant S100A1 protein with twitchin kinase, and comparison with other Ca2+-binding proteins. Eur. J. Biochem. 1997;24:127–133. doi: 10.1111/j.1432-1033.1997.00127.x. [DOI] [PubMed] [Google Scholar]
- 53.Franz C, Durussel I, Cox JA, Schafer BW, Heizmann CW. Binding of Ca2+ and Zn2+ to human nuclear S100A2 and mutant proteins. J. Biol. Chem. 1998;273:18826–18834. doi: 10.1074/jbc.273.30.18826. [DOI] [PubMed] [Google Scholar]
- 54.Fohr UG, Heizmann CW, Engelkamp D, Schafer BW, Cox JA. Purification and cation binding properties of the recombinant human S100 calcium-binding protein A3, an EF-hand motif protein with high affinity for zinc. J. Biol. Chem. 1995;270:21056–21061. doi: 10.1074/jbc.270.36.21056. [DOI] [PubMed] [Google Scholar]
- 55.Schafer BW, Fritschy JM, Murmann P, Troxler H, Durussel I, Heizmann CW, Cox JA. Brain S100A5 is a novel calcium-, zinc-, and copper ion-binding protein of the EF-hand superfamily. J. Biol. Chem. 2000;275:30623–30630. doi: 10.1074/jbc.M002260200. [DOI] [PubMed] [Google Scholar]
- 56.Kordowska J, Stafford WF, Wang CL. Ca2+ and Zn2+ bind to different sites and induce different conformational changes in human calcyclin. Eur. J. Biochem. 1998;253:57–66. doi: 10.1046/j.1432-1327.1998.2530057.x. [DOI] [PubMed] [Google Scholar]
- 57.Pedrocchi M, Schafer BW, Durussel I, Cox JA, Heizmann CW. Purification and characterization of the recombinant human calcium-binding S100 proteins CAPL and CACY. Biochemistry. 1994;33:6732–6738. doi: 10.1021/bi00187a045. [DOI] [PubMed] [Google Scholar]
- 58.Gribenko AV, Makhatadze GI. Oligomerization and divalent ion binding properties of the S100P protein: a Ca2+/Mg2+-switch model. J. Mol. Biol. 1998;283:679–694. doi: 10.1006/jmbi.1998.2116. [DOI] [PubMed] [Google Scholar]
- 59.Korndorfer IP, Brueckner F, Skerra A. The crystal structure of the human (S100A8/S100A9)2 heterotetramer, calprotectin, illustrates how conformational changes of interacting alpha-helices can determine specific association of two EF-hand proteins. J. Mol. Biol. 2007;370:887–898. doi: 10.1016/j.jmb.2007.04.065. [DOI] [PubMed] [Google Scholar]
- 60.Lee KC, Eckert RL. S100A7 (psoriasin)—mechanism of antibacterial action in wounds. J. Invest. Dermatol. 2007;127:945–957. doi: 10.1038/sj.jid.5700663. [DOI] [PubMed] [Google Scholar]
- 61.Glaser R, Harder J, Lange H, Bartels J, Christophers E, Schroder JM. Antimicrobial psoriasin (S100A7) protects human skin from Escherichia coli infection. Nat. Immunol. 2005;6:57–64. doi: 10.1038/ni1142. [DOI] [PubMed] [Google Scholar]
- 62.Christianson DW. Structural biology of zinc. Adv. Protein Chem. 1991;42:281–355. doi: 10.1016/s0065-3233(08)60538-0. [DOI] [PubMed] [Google Scholar]
- 63.Vallee BL, Auld DS. Cocatalytic zinc motifs in enzyme catalysis. Proc. Natl Acad. Sci. USA. 1993;90:2715–2718. doi: 10.1073/pnas.90.7.2715. [DOI] [PMC free article] [PubMed] [Google Scholar]
- 64.Inman KG, Yang R, Rustandi RR, Miller KE, Baldisseri DM, Weber DJ. Solution NMR structure of S100B bound to the high-affinity target peptide TRTK-12. J. Mol. Biol. 2002;324:1003–1014. doi: 10.1016/s0022-2836(02)01152-x. [DOI] [PubMed] [Google Scholar]
- 65.Mori S, Abeygunawardana C, Johnson MO, van Zijl PC. Improved sensitivity of HSQC spectra of exchanging protons at short interscan delays using a new fast HSQC (FHSQC) detection scheme that avoids water saturation. J. Magn. Reson., Ser. B. 1995;108:94–98. doi: 10.1006/jmrb.1995.1109. [DOI] [PubMed] [Google Scholar]
- 66.Mayer M, Meyer B. Group epitope mapping by saturation transfer difference NMR to identify segments of a ligand in direct contact with a protein receptor. J. Am. Chem. Soc. 2001;123:6108–6117. doi: 10.1021/ja0100120. [DOI] [PubMed] [Google Scholar]
- 67.Bax A, Davis DG. Practical aspects of two-dimensional transverse NOE spectroscopy. J. Magn. Reson. 1985;63:207–213. [Google Scholar]
- 68.Delaglio F, Grzesiek S, Vuister GW, Zhu G, Pfeifer J, Bax A. NMRPipe: a multidimensional spectral processing system based on UNIX pipes. J. Biomol. NMR. 1995;6:277–293. doi: 10.1007/BF00197809. [DOI] [PubMed] [Google Scholar]
- 69.Edison AS, Abildgaard F, Westler WM, Mooberry ES, Markley JL. Practical introduction to theory and implementation of multi-nuclear, multidimensional nuclear magnetic resonance experiments. Methods Enzymol. 1994;23:3–79. doi: 10.1016/s0076-6879(94)39003-7. [DOI] [PubMed] [Google Scholar]
- 70.Live DH, Davis DG, Agosta WC, Cowburn D. Long range hydrogen bond mediated effects in peptides: 15N NMR study of gramicidin S in water and organic solvents. J. Am. Chem. Soc. 1984;106:1939–1941. [Google Scholar]
- 71.Spera S, Bax A. Empirical correlation between protein backbone conformation and Ca and Cb/13-C nuclear magnetic resonance chemical shifts. J. Am. Chem. Soc. 1991;113:5490–5492. [Google Scholar]
- 72.Otwinowski Z, Minor W. Processing of X-ray diffraction data collected in oscillation mode. Methods Enzymol. 1997;276:307–326. doi: 10.1016/S0076-6879(97)76066-X. [DOI] [PubMed] [Google Scholar]
- 73.Vagin AA, Isupov MN. Spherically averaged phased translation function and its application to the search for molecules and fragments in electron-density maps. Acta Crystallogr., Sect. D: Biol. Crystallogr. 2001;57:1451–1456. doi: 10.1107/s0907444901012409. [DOI] [PubMed] [Google Scholar]
- 74.Murshudov GN, Vagin AA, Dodson EJ. Refinement of macromolecular structures by the maximum-likelihood method. Acta Crystallogr., Sect. D: Biol. Crystallogr. 1997;53:240–255. doi: 10.1107/S0907444996012255. [DOI] [PubMed] [Google Scholar]
- 75.Emsley P, Cowtan K. Coot: model-building tools for molecular graphics. Acta Crystallogr., Sect. D: Biol. Crystallogr. 2004;60:2126–2132. doi: 10.1107/S0907444904019158. [DOI] [PubMed] [Google Scholar]
- 76.Laskowski RA, MacArthur MW, Moss DS, Thornton JM. PROCHECK: a program to check the stereochemical quality of protein structures. J. Appl. Crystallogr. 1993;26:283–291. [Google Scholar]
- 77.Laskowski RA, MacArthur MW, Thornton JM. Validation of protein models derived from experiment. Curr. Opin. Struct. Biol. 1998;8:631–639. doi: 10.1016/s0959-440x(98)80156-5. [DOI] [PubMed] [Google Scholar]
- 78.Yap KL, Ames JB, Swindells MB, Ikura M. Diversity of conformational states and changes within the EF-hand protein superfamily. Proteins: Struct. Funct. Genet. 1999;37:499–507. doi: 10.1002/(sici)1097-0134(19991115)37:3<499::aid-prot17>3.0.co;2-y. [DOI] [PubMed] [Google Scholar]
- 79.Gagné SM, Tsuda S, Li MX, Smillie LB, Sykes BD. Structures of the troponin C regulatory domains in the apo and calcium-saturated states. Nat. Struct. Biol. 1995;2:784–789. doi: 10.1038/nsb0995-784. [DOI] [PubMed] [Google Scholar]
- 80.Berman HM, Westbrook J, Feng Z, Gilliland G, Bhat TN, Weissig H, et al. The Protein Data Bank. Nucleic Acids Res. 2000;28:235–242. doi: 10.1093/nar/28.1.235. [DOI] [PMC free article] [PubMed] [Google Scholar]
- 81.Yang H, Guranovic V, Dutta S, Feng Z, Berman HM, Westbrook JD. Automated and accurate deposition of structures solved by X-ray diffraction to the Protein Data Bank. Acta Crystallogr., Sect. D: Biol. Crystallogr. 2004;60:1833–1839. doi: 10.1107/S0907444904019419. [DOI] [PubMed] [Google Scholar]