Abstract
The primary events in the all-trans to 13-cis photoisomerization of retinal in bacteriorhodopsin have been investigated with femtosecond time-resolved absorbance spectroscopy. Spectra measured over a broad range extending from 7000 to 22,400 cm−1 reveal features whose dynamics are inconsistent with a model proposed earlier to account for the highly efficient photoisomerization process. Emerging from this work is a new three-state model. Photoexcitation of retinal with visible light accesses a shallow well on the excited state potential energy surface. This well is bounded by a small barrier, arising from an avoided crossing that separates the Franck–Condon region from the nearby reactive region of the photoisomerization coordinate. At ambient temperatures, the reactive region is accessed with a time constant of ≈500 fs, whereupon the retinal rapidly twists and encounters a second avoided crossing region. The protein mediates the passage into the second avoided crossing region and thereby exerts control over the quantum yield for forming 13-cis retinal. The driving force for photoisomerization resides in the retinal, not in the surrounding protein. This view contrasts with an earlier model where photoexcitation was thought to access directly a reactive region of the excited-state potential and thereby drive the retinal to a twisted conformation within 100–200 fs.
Bacteriorhodopsin (bR) is a 26-kDa protein found in the purple membrane of Halobacterium halobium, an archaebacterium that thrives in the harsh environment of salt marshes (1). Under aerobic conditions, this organism synthesizes ATP through the respiratory chain. Under anaerobic conditions, it survives by producing a prodigious amount of bR, a light-harvesting protein that converts photon energy to chemical energy by pumping protons unidirectionally across the membrane. The proton-motive force generated drives the synthesis of ATP (2). The light-absorbing chromophore within this proton “pump” is retinal, a polyene that is linked to Lys-216 of the protein by a protonated Schiff base (3, 4). Upon absorbing a single visible photon, the retinal isomerizes from the all-trans form to the 13-cis form (5, 6). This photoisomerization event triggers a thermally driven cascade involving several spectroscopically distinguishable intermediates (7), during which the Schiff base donates its proton to the extracellular channel and accepts a proton from the cytoplasmic channel (8, 9). Within 100 ms, the retinal isomerizes back to the all-trans form and the bR is ready for another photocycle (10).
Retinal linked to a protonated Schiff base can, in principle, isomerize about the 7, 9, 11, 13, or 15 position. Enumerating all the cis/trans isomers yields 25 = 32 different possibilities. Photoexcitation of all-trans retinal linked to a protonated Schiff base in methanol solution yields cis isomers with an overall quantum efficiency of ≈0.15, with 11-cis accounting for ≈75% of the photoproducts (11, 34). In bR, photoexcitation of all-trans retinal yields the 13-cis form with quantum efficiency of ≈0.6 (12–14). This quantum efficiency is especially remarkable because the 13-cis form must store sufficient potential energy in the protein for it to pump a proton across the membrane and revert thermally back to its all-trans form. Clearly, the protein cavity in which the retinal is embedded directs the photoreaction pathway toward the 13-cis form, ensuring highly specific isomerization and high quantum efficiency while storing potential energy. The overall quantum efficiency for this proton pump appears to be dictated by the quantum efficiency of the photoisomerization event. The focus of this work is on the mechanism of this critical first step.
Investigations into the dynamics of photoisomerization have a long history theoretically and experimentally. A semiclassical trajectory approach to photoisomerization was reported for 2-butene (15) and later extended to retinal in a constrained environment (16). Around that time the first picosecond time-resolved spectra of photoexcited bR were reported (17). These seminal studies laid the foundation for the vast literature that was to follow on photoisomerization in proteins. In 1988, two independent groups used the technique of femtosecond time-resolved spectroscopy to investigate the dynamics of photoisomerization in bR (18, 19). Both groups proposed independently a two-state model (Fig. 1) for understanding the primary photoisomerization process in bR. They concluded that photoexcitation of bR triggers an ultrafast (100- to 200-fs) torsional motion toward a minimum in the excited-state potential energy surface. From this twisted conformation, relaxation to the ground electronic state produces either 13-cis or all-trans retinal. To account for ultrafast torsional motion, an excited-state potential that was repulsive in the Franck–Condon active region was invoked. This contrasts with retinal in solution, where the Franck–Condon active region of the excited state is at an extremum, corresponding to a region of zero slope. This is required by the symmetry of clockwise vs. counterclockwise rotation about the C13=C14 double bond. A repulsive potential in the Franck–Condon active region can result only if the protein shifts the extrema of the ground- and excited-state potential energy surfaces relative to one another in coordinate space. An implication that emerged from some of the earlier work is that such a bias might facilitate rapid conversion to the 13-cis form and may even be necessary to achieve a high quantum yield for photoisomerization. On the other hand, recent studies of bR mutants revealed quantum efficiencies for photoisomerization that were remarkably constant and similar to the efficiency for native bR, despite excited-state lifetimes that varied by an order of magnitude (14, 20–22). This suggests that rapid conversion to the 13-cis form might not be necessary to attain a high quantum efficiency for photoisomerization. Whether the Franck–Condon active region of the excited state potential energy surface is repulsive can be tested by monitoring the time dependence of the stimulated emission spectrum. As the photoexcited retinal progresses toward the minimum of the excited-state potential energy surface, the energy difference between the ground and excited state would decrease over time, leading to a red-shift of the stimulated emission spectrum. To observe this shift and to investigate further the primary processes associated with the photoisomerization of retinal in bR, we constructed a pump-probe time-resolved spectrometer that provides broad tunability of both pump and probe pulses, <200-fs time resolution, and high sensitivity. The time-resolved absorbance spectra obtained with this instrument were found to be incompatible with the two-state model for the photoisomerization of bR and required that we invoke the participation of a third electronic state.§ A three-state model was also proposed recently on theoretical grounds (23). This new model also explains how the quantum efficiency for photoisomerization might be uncorrelated with the excited-state lifetime.
Figure 1.
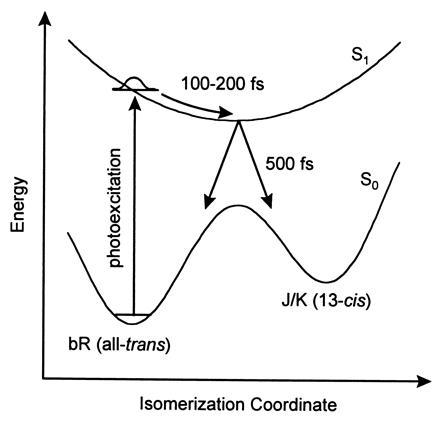
Two-state model proposed earlier for the photoisomerization of bR (18, 19).
MATERIALS AND METHODS
bR (Sigma) was suspended in a Hepes buffer (pH 7.4; 10 mM) and dispersed by sonication (Fisher model 550). To minimize sample heating during sonication (140 W), the ultrasound was delivered in 0.1-s bursts every 10 s for a period of approximately 5 min. The bR sample was confined within a circular sample cell composed of two 2-mm-thick calcium fluoride windows and a 1-mm spacer. The absorbance at 568 nm, the peak of the bR absorbance, was 0.95. Light-adaptation of the bR sample was accomplished prior to use by illumination with a quartz–halogen lamp. Ambient light and the femtosecond pump pulses were sufficient to maintain the bR in the light-adapted form during the experiments.
A tunable femtosecond pump pulse was used to photoexcite the retinal in bR, and a broadband continuum probe pulse was used to measure the absorbance. The pump pulse was generated by frequency doubling the signal output of a home-built β-barium borate-based optical parametric amplifier which was powered by regeneratively amplified pulses (780 nm, 120 fs, 1 kHz) from a mode-locked Ti:sapphire laser (Clark–MXR, Dexter, MI). The excitation wavelength was tuned to 620 nm and the pulse energy was attenuated to ≈100 nJ. This energy was sufficient to excite approximately 10% of the retinal molecules within the pump beam diameter of 200 μm. The sample cell was rotated so that each pump pulse photoexcited a fresh bR sample.
The probe pulse consisted of a “white-light” continuum generated by focusing the output of a second optical parametric amplifier into either a sapphire or a CaF2 window. The probe beam was split into sample and reference arms and directed through a monochromator onto two photodiode detectors. The pump beam was chopped at half of the 1-kHz repetition rate of the laser, such that every other pulse was prevented from hitting the sample. The difference between the sample/reference ratio when pumped vs. unpumped was used to compute the pump-induced change in the absorbance of the sample at the wavelength selected by the monochromator and at a time determined by an optical delay. The instrument response function was determined by measuring the pump-induced optical Kerr rotation signal and the cross-phase modulation between the pump and probe pulses in a blank solution cell.
RESULTS
Time-Resolved Absorbance Spectra.
Time-resolved absorbance spectra of photoexcited bR are shown in Fig. 2, where the spectral range explored is significantly broader than that covered in earlier femtosecond studies. The pump-induced change in the absorbance of the sample, ΔA, has contributions from four sources: ground-state bleach, excited-state absorbance, stimulated emission, and photoproduct absorbance. The negative-going feature near 17,500 cm−1 corresponds to the ground-state bleach. This feature arises from pump-induced depletion of the ground-state population and approximates the equilibrium absorbance spectrum of light-adapted bR. The positive-going feature near 21,700 cm−1 corresponds to an excited-state absorbance. The negative-going feature near 11,000 cm−1 corresponds to stimulated emission from the excited state. The persistent positive-going feature near 15,500 cm−1 arises from the photoproduct, the 13-cis isomer of retinal. As the stimulated emission and the excited-state absorbance decay the bleach recovers partially and the photoproduct grows. The fraction of the bleach that does not recover corresponds to the quantum efficiency for photoisomerization.
Figure 2.
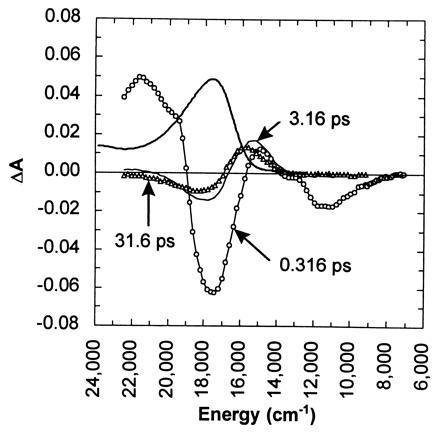
Time-resolved absorbance spectra of light-adapted bR in purple membrane after photoexcitation with 100-fs 620-nm pulses. The spectra shown were recorded at 0.316 ps (○), 3.16 ps (thin line), and 31.6 ps (▵) with the pump and probe polarizations set at the magic angle (54.7°) relative to one another. For comparison, a scaled (÷20) equilibrium spectrum of bR is shown (thick line).
Excited-State Relaxation Dynamics.
According to Fig. 3, the shape of the stimulated emission spectrum evolves negligibly from 178 fs to 1 ps. Consequently, the time-dependent stimulated emission measured at its peak provides an incisive probe of the excited-state population. Because both stimulated emission and excited-state absorbance originate from the same electronic state, one would expect their dynamics to be the same. The dynamics of the excited state were determined by probing the time-dependent rise and decay of both the excited-state absorbance and the stimulated emission (Fig. 4). The data were modeled by convoluting the measured instrument response function with the fitting function, and the parameters of the function were optimized by the least-squares method. The decay of the excited-state absorbance and stimulated emission were fit simultaneously, using the same decay function. A single exponential function yields a decay time of approximately 490 fs, similar to that reported elsewhere (18, 19, 24). However, the decay is rather poorly modeled with a single exponential function, especially for times beyond 1 ps. Much better agreement was obtained with a biexponential function. The least-squares time constants for the fast and slow decay components of the biexponential function were 370 fs (87%) and 2.1 ps (13%), respectively, with the fast decay component dominating.
Figure 3.
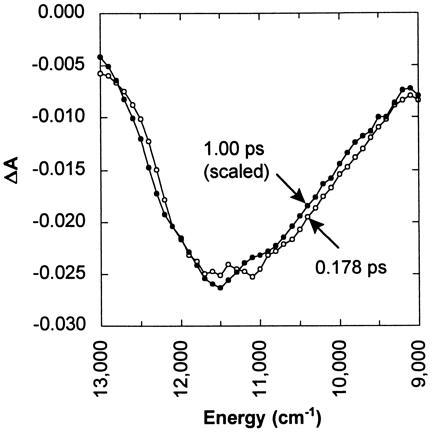
Comparison of stimulated emission spectra recorded at 178 fs (○) and 1.00 ps (•). The 1.00-ps spectrum has been scaled by a factor of 3.59. The similarity shows that the stimulated emission spectrum shifts negligibly beyond 178 fs.
Figure 4.
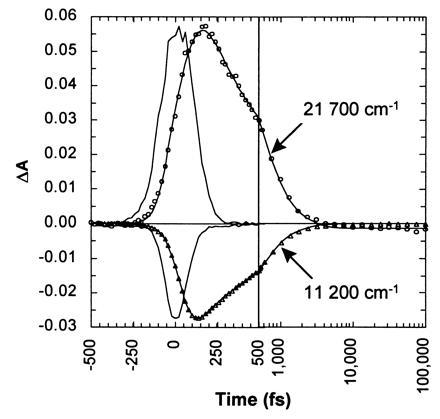
Transient absorbance at the peak of the excited-state absorbance (21,700 cm−1; ○) and at the peak of the red-shifted stimulated emission (11,200 cm−1; ▵). The data were modeled (lines) by convoluting functions having both rise and fall times, i.e., ∝ [exp(−t/τfall) − exp(−t/τrise)], with the measured instrument response function. The instrument response function (Gaussian-like curve) was measured by an optical Kerr effect in a sample cell loaded with water.
An exponential rise time was incorporated into each component of the biexponential model according to [exp(−t/τfall) − exp(−t/τrise)], which corresponds to the time dependence of B in the kinetic scheme A → 1/τrise B → 1/τfall C. The rise times recovered when modeling several data sets averaged 10 fs and never exceeded 30 fs. While a rise time of 10 fs is clearly unresolved, the consistency of the measurements suggests that the stimulated emission grows with a nonzero time constant that may very well be shorter than 30 fs.
DISCUSSION
Evidence for an Excited-State Absorbance near 13,000 cm−1.
The early time spectra in Fig. 2 are complex due to overlap of the features. However, it is possible to decompose the early time spectrum into its various contributions. For example, the stimulated emission spectrum of photoexcited bR can be derived from its fluorescence emission spectrum by a ν2-scaling of the fluorescence intensity (25). Fluorescence emission spectra reported elsewhere (18, 26, 27) suggest that the maximum of the stimulated emission should be near 13,000 cm−1. However, the stimulated emission feature in Fig. 2 is peaked near 11,000 cm−1. Moreover, the integrated stimulated emission at a time short compared with excited-state relaxation should be comparable to the integrated bleach. However, the stimulated emission in Fig. 2 is much smaller. Where is the “missing” stimulated emission? It is not observed in the early time transient absorbance spectrum because of an overlapping positive-going excited state absorbance that was hitherto uncharacterized. To characterize the excited-state absorbance, the ground-state bleach and the stimulated emission contributions to the transient absorbance spectrum at 316 fs were estimated and subtracted. The resulting excited-state absorbance spectrum, shown in Fig. 5, reveals a feature near 13,000 cm−1 that is nearly as intense as the previously characterized feature near 21,700 cm−1. Because the 13,000-cm−1 feature overlaps with the photoproduct absorbance, the ground-state bleach, and the stimulated emission spectrum, its presence complicates the characterization of the early time intermediates in the photoisomerization of bR. Interestingly, the combination of bleach, stimulated emission, and excited state absorbance appears to give rise to a positive-going feature near 15,000 cm−1 that has heretofore been assigned to the elusive J intermediate. Instead of being assigned to a ground-state photoproduct, this feature may well correspond to an excited-state absorbance.
Figure 5.
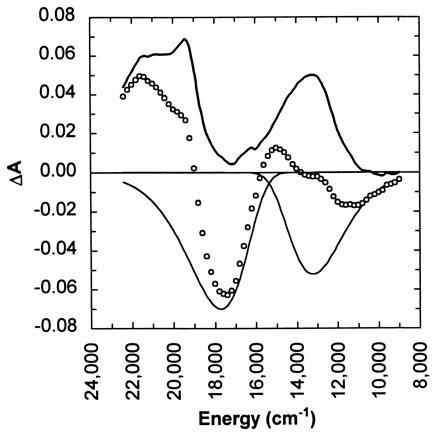
Time-resolved absorbance spectrum measured 0.316 ps after photoexcitation with 620-nm pump pulses (○). The excited-state absorbance spectrum was constructed (thick line) by removing the bleaching and stimulated emission contributions (thin lines) to the measured time-resolved spectra. The pump and probe polarizations were set at the magic angle (54.7°) relative to one another.
Spectral and Kinetic Inconsistencies with Earlier Model for Photoisomerization.
According to the scheme presented in Fig. 1, photoexcitation of bR would access a repulsive region of the excited-state potential, causing the stimulated emission spectrum to red-shift over a time scale of 100–200 fs as the photoisomerization proceeds along its reaction coordinate. However, Fig. 3 shows that the stimulated emission spectrum evolves negligibly from 178 fs to 1 ps, apart from decaying in magnitude. Moreover, the rise time of the stimulated emission near its red edge appears to be less than 30 fs. This ultrafast appearance and negligible evolution of the stimulated emission spectrum suggest that photoexcitation of bR accesses a relatively flat region of the excited-state potential energy surface, not a repulsive region.
The peak of the fluorescence emission spectrum of bR is Stokes shifted approximately 4000 cm−1 from the peak of the absorbance. According to our results, this shift apparently occurs with a time constant of less than 30 fs. An extremely fast process was also seen by Dexheimer et al. (28), using 12-fs pulses. They reported a transient increase in absorbance at 568 nm due to an excited-state absorbance that blue-shifted completely out of this wavelength region in less than 70 fs. More recently, Du and Fleming (27) performed time-resolved fluorescence measurements on bR with 40-fs time resolution and were unable to resolve any rise time of the fluorescence emission over the wavelength range 680–900 nm. Evidently, the ultrafast Stokes shift is dominated by relaxation along high-frequency vibrational coordinates that experience a large displacement upon photoexcitation. A contribution from the ≈70-fs polarization response of the protein is also expected (29). The ultrafast nuclear rearrangement appears not to project along the photoisomerization reaction coordinate.
Three-State Model for Photoisomerization of bR.
The spectral dynamics reported here suggest that the potential energy surface in the Franck–Condon active region of the excited electronic state is relatively flat, not repulsive. Consequently, the structure of the protein surrounding the retinal does not “drive” the reaction toward the 13-cis form; rather, the driving force that leads to photoisomerization must be intrinsic to the retinal. To account for this propensity to photoisomerize, we invoke a third electronic state which couples to the initially excited state as well as to the cis and trans ground electronic states (Fig. 6). Following the prescription of Schulten et al. (23), the adiabatic surfaces labeled S0, S1, and S2 are constructed from three diabatic surfaces, two of which vary sinusoidally along the C13=C14 dihedral angle and one of which is angle invariant. Coupling between these diabatic surfaces results in avoided crossings. The protein contribution to the energy is approximated as another sinusoid which raises the energy of all three electronic states by 12 kcal/mol (1 kcal = 4.18 kJ) (30) as the retinal goes from the all-trans to the 13-cis isomer. The surfaces labeled S0, S1, and S2 correspond to ground, singly, and doubly excited singlet states. Spectroscopic transitions between S0 and S1 are one-photon allowed and transitions between S0 and S2 are two-photon allowed. However, mixing between the excited electronic states can weaken these selection rules.
Figure 6.
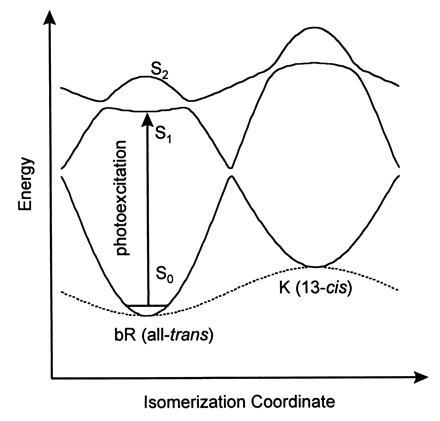
Three-state model for the photoisomerization of bR. The free energy of the 13-cis isomer is elevated above all-trans (broken line). The splitting for all crossing regions was set arbitrarily to 1 kcal/mol.
The S1 surface reveals a small barrier separating the Franck–Condon active region from the steeply sloped “reactive” region of the isomerization coordinate. When torsional diffusion within this shallow well surmounts the barrier, the retinal is driven rapidly toward a twisted conformation and a second avoided crossing region. The measured excited-state lifetime is therefore the approximate time required to cross this barrier. The twisted conformation is the transition state for photoisomerization: from here the reaction path leads to the ground state of either the all-trans isomer or the 13-cis isomer. In either case, the electronic energy is converted into vibrational energy, rendering the retinal vibrationally hot. The photoproduct spectrum develops fully when the retinal cools back to ambient temperature, a process which occurs on a time scale of several picoseconds.
The height of the barrier that must be crossed to access the reactive surface depends on the shape of S1, the position of S1 relative to S2, and the strength of the coupling between S1 and S2. In general, when S1 is higher (i.e., closer to but below S2), the barrier is smaller, the distance to the crossing region is smaller, and the excited-state lifetime would be shorter. The absorbance spectrum of retinal in bR is strongly red-shifted compared with that in solvents, demonstrating that the protein environment modulates the energy gap between S0 and S1. The retinal environment should also affect the energy gap between S1 and S2 and hence the barrier to be surmounted in the first avoided crossing region. The magnitude of this barrier can be estimated from the temperature dependence of the excited-state lifetime. When bR is cooled from room temperature down to 77 K, its fluorescence lifetime increases from 0.5 ps to 60 ± 15 ps (26). Interestingly, over that temperature range, the quantum efficiency for formation of the photoproduct K remains unchanged (31, 32). Because 60 ps is still much shorter than the radiative lifetime (estimated to be several nanoseconds), virtually all of the molecules will make the adiabatic transition to the reactive surface. A factor of 120 increase in the lifetime upon cooling from room temperature to 77 K corresponds to an Arrhenius barrier of 1 kcal/mol or 350 cm−1.
A three-state model for photoisomerization was proposed more than 20 years ago by Orlandi and Siebrand (33) to account for the photoisomerization of stilbene. The third state corresponds to a doubly excited electronic state, S2, which Hudson and Kohler (35) calculated to be somewhat lower in energy than S1 for several polyenes. The two-photon absorbance spectrum of all-trans retinal in EPA (ethyl ether/isopentane/alcohol) solvent at 77 K (36) reveals this inversion as well. However, this inversion is absent in bR: its two-photon absorption spectrum reveals a resonance at ≈21,000 cm−1, about 3500 cm−1 higher than the peak of the one-photon absorption (37). Consequently, for bR, placement of S1 below S2 in Fig. 6 is justified on experimental grounds. Because these states are strongly mixed, they can both be accessed with one photon. However, when bR is excited on the red edge of its absorbance spectrum, as was done here, excitation into S1 predominates.
Origin of Nonexponential Relaxation.
According to the data of Fig. 4, both the excited-state absorbance at 21,700 cm−1 and the stimulated emission at 11,200 cm−1 decay nonexponentially with the same function. Nonexponential relaxation can arise when two or more species with different lifetimes contribute to the measured signal. However, the stimulated emission spectra measured at 178 fs and 1 ps are virtually identical, requiring that the kinetically different populations be spectroscopically similar. This can arise if the electronic transition to the first excited state is broadened inhomogeneously, and if that heterogeneity modulates the barrier leading to the reactive region of the excited-state surface. Hole-burning experiments have shown that there is a significant inhomogeneous contribution to the absorbance spectrum of bR (38–40). This conformational heterogeneity affects not only the energy difference between S0 and S1 but also the relative energies of S1 and S2 and, hence, the magnitude of the barrier to be surmounted to access the “reactive” region of the photoisomerization coordinate. Should the conformational heterogeneity persist for a time longer than the excited-state relaxation, one would expect the excited-state decay to proceed nonexponentially, as is reported here. This may also account for the results of Du and Fleming (27), who reported nonexponential fluorescence decay of bR as well as a modest emission wavelength dependence to the decay dynamics.
One could model the nonexponential decay with a distribution of barriers; however, the number of parameters required by such a model is probably not warranted by the data reported here. Instead, we report parameters obtained by modeling the data of Fig. 4 with a biexponential function. Whereas the two time constants and their amplitudes serve to reflect the degree of heterogeneity, they should not be viewed too quantitatively. The fast and slow rate coefficients represent only approximate bounds on the distribution of rate coefficients for photoexcited bR.
Predictions Arising from the Three-State Model.
The three-state model postulates a small barrier on the excited-state surface which localizes the excited population near the region of zero rotation for a few hundred femtoseconds. Upon crossing this barrier, the reaction progresses to the second avoided crossing region. As this reaction proceeds, the energy separation between S0 and S1 diminishes, leading to a red-shift and a diminution of the stimulated emission spectrum. Because motion along the “reactive” surface is expected to be fast compared with the first barrier crossing rate, the population of retinal chromophores that could be caught in the act of isomerizing is small and would be very difficult to detect spectroscopically, as is observed. If the retinal were to remain trapped for a time at the minimum of the S1 surface, it may prove possible to detect that excited intermediate spectroscopically. This transiently trapped population would be the precursor to K and would correspond to the transition state for photoisomerization.
According to the three-state model, the excited-state lifetime is dictated by the magnitude of the barrier in the first avoided crossing region, and the quantum efficiency for photoisomerization is controlled by the nature of the motion through the second avoided crossing region as well as the coupling between the two surfaces in that region. Mutations to bR that decrease the energy gap between S0 and S1 would increase the height of the first barrier and would lead to a longer-lived excited state. However, this perturbation need not influence the quantum efficiency for photoisomerization. Indeed, mutations that alter the excited state lifetime by more than an order of magnitude were found to have a negligible impact on the quantum efficiency for photoisomerization (14, 22). The role of the protein in mediating the all-trans to 13-cis photoisomerization appears be largely as a catalyst along the C13=C14 bond and as an inhibitor along all other double bonds (21).
Because photoisomerization to 13-cis retinal stores energy in the protein, the protein is able to “drive” the reverse photoisomerization process, 13-cis to all-trans retinal. When this bias is built into the three-state model, the potential energy surface for photoexcited 13-cis retinal (K) reveals no barrier between the Franck–Condon active region and the reactive region leading to the twisted conformation. Consequently, photoexcitation of 13-cis retinal would be expected to reveal a shorter-lived excited state. Indeed, preliminary femtosecond studies of photogenerated 13-cis in our laboratory have revealed an excited-state lifetime that is much shorter than that for all-trans retinal. To explore this other half of the photoisomerization reaction coordinate in more detail, we are performing additional femtosecond time-resolved studies on the 13-cis photoproduct.
Because of the remarkable photoisomerization selectivity achieved in bR, it may be reasonable to portray this complex process with the simple one-dimensional three-state photoisomerization reaction coordinate proposed here.
Note Added in Proof.
Transient absorption measurements were recently carried out by R. M. Hochstrasser and coworkers (41), who reported similar conclusions regarding the inadequacy of the conventional bR potential energy surface.
Acknowledgments
This work was supported in part by National Institutes of Health Grant DK45306, the National Science Foundation Young Investigator Program, the Beckman Foundation, and the Mitsubishi Kasei Corp.
Footnotes
Abbreviation: bR, bacteriorhodopsin.
These results were presented at the Tenth Conference on Ultrafast Phenomena, San Diego, CA, May 28–June 1, 1996.
References
- 1.Oesterhelt D, Stoeckenius W. Nature New Biol. 1971;233:149–152. doi: 10.1038/newbio233149a0. [DOI] [PubMed] [Google Scholar]
- 2.Racker E, Stoeckenius W. J Biol Chem. 1974;249:662–663. [PubMed] [Google Scholar]
- 3.Lewis A, Spoonhower J, Bogomolni R A, Lozier R H, Stoeckenius W. Proc Natl Acad Sci USA. 1974;71:4462–4466. doi: 10.1073/pnas.71.11.4462. [DOI] [PMC free article] [PubMed] [Google Scholar]
- 4.Katre N V, Wolber P K, Stoeckenius W, Stroud R M. Proc Natl Acad Sci USA. 1981;78:4068–4072. doi: 10.1073/pnas.78.7.4068. [DOI] [PMC free article] [PubMed] [Google Scholar]
- 5.Pettei M J, Yudd A P, Nakanishi K, Henselman R, Stoeckenius W. Biochemistry. 1977;16:1955–1959. doi: 10.1021/bi00628a031. [DOI] [PubMed] [Google Scholar]
- 6.Braiman M, Mathies R A. Proc Natl Acad Sci USA. 1982;79:403–407. doi: 10.1073/pnas.79.2.403. [DOI] [PMC free article] [PubMed] [Google Scholar]
- 7.Lozier R H, Bogomolni R A, Stoeckenius W. Biophys J. 1975;15:955–962. doi: 10.1016/S0006-3495(75)85875-9. [DOI] [PMC free article] [PubMed] [Google Scholar]
- 8.Braiman M S, Mogi T, Marti T, Stern L J, Khorana H G, Rothschild K J. Biochemistry. 1988;27:8516–8520. doi: 10.1021/bi00423a002. [DOI] [PubMed] [Google Scholar]
- 9.Gerwert K, Hess B, Soppa J, Oesterhelt D. Proc Nat Acad Sci USA. 1989;86:4943–4947. doi: 10.1073/pnas.86.13.4943. [DOI] [PMC free article] [PubMed] [Google Scholar]
- 10.Varo G, Lanyi J K. Biochemistry. 1991;30:5016–5022. doi: 10.1021/bi00234a025. [DOI] [PubMed] [Google Scholar]
- 11.Freedman K A, Becker R S. J Am Chem Soc. 1986;108:1245–1251. [Google Scholar]
- 12.Govindjee R, Balashov S P, Ebrey T G. Biophys J. 1990;58:597–608. doi: 10.1016/S0006-3495(90)82403-6. [DOI] [PMC free article] [PubMed] [Google Scholar]
- 13.Rohr M, Gartner W, Schweitzer G, Holzwarth A R, Braslavsky S E. J Phys Chem. 1992;96:6055–6061. [Google Scholar]
- 14.Logunov S L, El-Sayed M A, Song L. J Phys Chem. 1996;100:2391–2398. [Google Scholar]
- 15.Warshel A, Karplus M. Chem Phys Lett. 1975;32:11–17. [Google Scholar]
- 16.Warshel A. Nature (London) 1976;260:679–683. doi: 10.1038/260679a0. [DOI] [PubMed] [Google Scholar]
- 17.Kaufmann K J, Rentzepis P M, Stoeckenius W, Lewis A. Biochem Biophys Res Commun. 1976;68:1109–1115. doi: 10.1016/0006-291x(76)90310-7. [DOI] [PubMed] [Google Scholar]
- 18.Dobler J, Zinth W, Kaiser W, Oesterhelt D. Chem Phys Lett. 1988;144:215–220. [Google Scholar]
- 19.Mathies R A, Brito Cruz C H, Pollard W T, Shank C V. Science. 1988;240:777–779. doi: 10.1126/science.3363359. [DOI] [PubMed] [Google Scholar]
- 20.Song L, El-Sayed M A, Lanyi J K. J Phys Chem. 1996;100:10479–10481. [Google Scholar]
- 21.Song L, El-Sayed M A, Lanyi J K. Science. 1993;261:891–894. doi: 10.1126/science.261.5123.891. [DOI] [PubMed] [Google Scholar]
- 22.Logunov S L, El-Sayed M A, Lanyi J K. Biophys J. 1996;70:2875–2881. doi: 10.1016/S0006-3495(96)79857-0. [DOI] [PMC free article] [PubMed] [Google Scholar]
- 23.Schulten K, Humphrey W, Logunov I, Sheves M, Xu D. Isr J Chem. 1995;35:447–464. [Google Scholar]
- 24.Petrich J W, Breton J, Martin J L, Antonetti A. Chem Phys Lett. 1987;137:369–375. [Google Scholar]
- 25.Birks J B. Photophysics of Aromatic Molecules. New York: Wiley; 1970. [Google Scholar]
- 26.Shapiro S L, Campillo A J, Lewis A, Perreault G J, Spoonhower J P, Clayton R K, Stoeckenius W. Biophys J. 1978;23:383–393. doi: 10.1016/S0006-3495(78)85457-5. [DOI] [PMC free article] [PubMed] [Google Scholar]
- 27.Du M, Fleming G R. Biophys Chem. 1993;48:101–111. [Google Scholar]
- 28.Dexheimer S L, Wang Q, Peteanu L A, Pollard W T, Mathies R A, Shank C V. Chem Phys Lett. 1992;188:61–66. [Google Scholar]
- 29.Xu D, Martin C, Schulten K. Biophys J. 1996;70:453–460. doi: 10.1016/S0006-3495(96)79588-7. [DOI] [PMC free article] [PubMed] [Google Scholar]
- 30.Birge R R, Cooper T M, Lawrence A F, Masthay M B, Zhang C F, Zidovetski R. J Am Chem Soc. 1991;113:4327–4328. [Google Scholar]
- 31.Hurley E B, Ebrey T G, Honig B, Ottolenghi M. Nature (London) 1977;270:540–542. doi: 10.1038/270540a0. [DOI] [PubMed] [Google Scholar]
- 32.Balashov S P, Imasheva E S, Govindjee R, Ebrey T G. Photochem Photobiol. 1991;54:955–961. [Google Scholar]
- 33.Orlandi G, Siebrand W. Chem Phys Lett. 1975;30:352–354. [Google Scholar]
- 34.Koyama Y, Kubo K, Komori M, Yasuda H, Mukai Y. Photochem Photobiol. 1991;54:433–443. doi: 10.1111/j.1751-1097.1991.tb02038.x. [DOI] [PubMed] [Google Scholar]
- 35.Hudson B S, Kohler B E. J Chem Phys. 1973;59:4984–5002. [Google Scholar]
- 36.Birge R R, Bennett J A, Hubbard L M, Fang H L, Pierce B M, Kliger D S, Leroi G E. J Am Chem Soc. 1982;104:2519–2525. [Google Scholar]
- 37.Birge R R, Zhang C F. J Chem Phys. 1990;92:7178–7195. [Google Scholar]
- 38.Lee I J, Gillie J K, Johnson C K. Chem Phys Lett. 1989;156:227–232. [Google Scholar]
- 39.Loppnow G R, Mathies R A, Middendorf T R, Gottfried D S, Boxer S G. J Phys Chem. 1992;96:737–745. [Google Scholar]
- 40.Kamalov V F, Masciangioli T M, El-Sayed M A. J Phys Chem. 1996;100:2762–2765. [Google Scholar]
- 41.Haran G, Wynne K, Xie A, He Q, Chance M, Hochstrasser R M. Chem Phys Lett. 1996;261:389–395. [Google Scholar]


