

Abstract
Objective
To determine whether Smurf2, an E3 ubiquitin ligase known to inhibit transforming growth factor β (TGFβ) signaling, is expressed in human osteoarthritic (OA) cartilage and can initiate OA in mice.
Methods
Human OA cartilage was obtained from patients undergoing knee arthroplasty. Samples were graded histologically using the Mankin scale and were examined immunohistochemically for Smurf2 expression. A transgene driven by the collagen 2α1 promoter was used to overexpress Smurf2 in mice. Smurf2 overexpression in mouse sternal chondrocytes was confirmed by reverse transcription–polymerase chain reaction and Western blotting. Changes in articular cartilage area, chondrocyte number, and chondrocyte diameter were assessed histomorphometrically using OsteoMeasure software. Alterations in type X collagen and matrix metalloproteinase 13 (MMP-13) in articular chondrocytes were examined by in situ hybridization and immunohistochemistry, respectively. Joint bone phenotypes were evaluated by microfocal computed tomography. The effects of Smurf2 overexpression on TGFβ signaling were examined using a luciferase-based reporter and immunoprecipitation/Western blotting.
Results
Human OA cartilage strongly expressed Smurf2 as compared with nonarthritic human cartilage. By 8 months of age, Smurf2-transgenic mice exhibited decreased articular cartilage area, fibrillation, clefting, eburnation, subchondral sclerosis, and osteophytes. Increased expression of type X collagen and MMP-13 were also detected in articular cartilage from transgenic mice. Transgenic sternal chondrocytes showed reduced TGFβ signaling as well as decreased expression and increased ubiquitination of pSmad3.
Conclusion
Smurf2 is up-regulated during OA in humans, and Smurf2-transgenic mice spontaneously develop an OA-like phenotype that correlates with decreased TGFβ signaling and increased pSmad3 degradation. Overall, these results suggest a role of Smurf2 in the pathogenesis of OA.
Arthritis is the number one cause of disability in the US (1). It has been projected that by 2020, 59.4 million Americans will be affected (18.2%) (2). Osteoarthritis (OA), the most common form of arthritis, is a noninflammatory degenerative joint disease characterized by articular chondrocyte dysfunction, articular cartilage degradation, osteophyte formation, and subchondral sclerosis (3). There is limited understanding of the seminal molecular and/or cellular events in articular cartilage degeneration, and there are few therapeutic options for OA patients. Thus, understanding these events would have a tremendous impact on the development of more-effective therapeutic paradigms.
Biochemical, genetic, and mechanical factors contribute to OA progression (4). In the early stages of the disease, the production of catabolic cytokines by the synovium induces transient articular chondrocyte proliferation and increased matrix synthesis (type II collagen, aggrecan) in an attempt to initiate repair (5,6). However, the chronic production of these cytokines, including interleukin-1 (IL-1), tumor necrosis factor α (TNFα), IL-17, and IL-18, as well as prostaglandin E2, leads to the enhanced synthesis of collagenases (matrix metalloproteinase 1 [MMP-1], MMP-8, MMP-9, and MMP-13) and aggrecanases (ADAMTS4 and ADAMTS5), which drive matrix degradation and progressively erode the articular surface (4,6-10). Coupled with the progressive degradation of the matrix is the dysregulation of articular chondrocytes, denoted by the inappropriate expression of genetic and morphologic markers of endochondral ossification, including type X collagen and alkaline phosphatase, and increased apoptosis (5,7,11,12). It has been hypothesized that this altered articular chondrocyte phenotype is an initiating step in the disease process.
Since inappropriate maturation of articular chondrocytes may be a central mechanism in the process of articular cartilage degeneration, it is essential to investigate the impact of signaling pathways that regulate chondrogenesis and chondrocyte maturation. For example, mice with reduced transforming growth factor β (TGFβ) signaling due to overexpression of a dominant-negative form of the TGFβ receptor type II (TGFβRII) have accelerated chondrocyte maturation in the growth plate and articular chondrocyte hypertrophy coupled with an OA-like form of cartilage erosion (13). A similar growth plate and articular cartilage phenotype is present in mice lacking Smad3, a critical TGFβ signaling molecule (14). Since the TGFβ pathway inhibits chondrocyte maturation (15-17), loss of TGFβ signaling in these mice results in inappropriate articular chondrocyte maturational progression, leading to defects in the cartilage matrix. Thus, loss of TGFβ signaling in chondrocytes is likely a contributing mechanism in the progression of OA.
While these studies indicate that loss of TGFβ signaling can lead to OA, it is not clear how this reduced signaling situation arises during normal pathogenesis. Given the role of the E3 ubiquitin ligase Smurf2 as an endogenous negative regulator of TGFβ signaling, we hypothesized that up-regulation of Smurf2 reduces TGFβ signaling and induces articular chondrocyte hypertrophy and cartilage degradation. In this study, we found that Smurf2 is up-regulated in cartilage from humans with knee OA. Consistent with this, we also found that overexpression of Smurf2 in mouse cartilage leads to the development of a severe cartilage arthropathy characterized by hypertrophy of articular chondrocytes, progressive degradation of the articular cartilage, up-regulation of type X collagen and MMP-13 by articular chondrocytes, and development of osteophytes and subchondral sclerosis. This phenotype was associated with inhibition of TGFβ signaling and induction of phosphorylated Smad3 (pSmad3) degradation. These findings, which suggest that inappropriate articular chondrocyte maturation is a seminal event that precedes joint degeneration during disease, implicate Smurf2 as a candidate etiologic mechanism in the development of OA.
MATERIALS AND METHODS
Procurement and fixation of human tissues
An Institutional Review Board–approved protocol was executed to collect discarded cartilage from patients undergoing orthopedic surgery. Normal cartilage was collected from trauma/amputation patients, and arthritic cartilage was collected from patients undergoing total knee arthroplasty. Tissues were fixed for 2–10 days in 10% neutral buffered formalin at 23°C. Samples were decalcified for 3 weeks in 10% weight/volume EDTA and embedded in paraffin. Three-micrometer–thick sections were cut and mounted on positively charged slides, baked at 60°C for 30 minutes, deparaffinized in xylene, and rehydrated in decreasing concentrations of ethanol.
Mankin grading and Smurf2 immunohistochemistry of human tissues
Human tissue sections were stained with Safranin O–fast green and were graded according to a modification of the Mankin scale (18). Specifically, cartilage was assigned a grade of 0–6, where 0 = normal cartilage, 1 = localized fibrillation, 2 = broadly distributed fibrillation, 3 = clefts to the transitional zone, 4 = clefts to the radial zone, 5 = clefts to calcified cartilage, and 6 = complete disorganization. Two independent blinded observers (QW and MJZ) graded all of the samples that were collected.
Sections evaluated by immunohistochemistry were treated with 3% hydrogen peroxide for 20 minutes, followed by a 1:20 dilution of normal goat serum for 20 minutes. Slides were incubated overnight at 4°C with primary antibody (polyclonal rabbit anti-human Smurf2 or polyclonal rabbit anti-mouse vimentin), rinsed with phosphate buffered saline (PBS), and incubated for 30 minutes at room temperature with a biotinylated goat anti-rabbit secondary antibody. After a final rinse with PBS, slides were placed in deionized H2O containing Tween 20 (1:10,000 dilution). Binding of antibody to antigen was detected following application of horseradish peroxidase (HRP)–conjugated streptavidin (1:250 dilution) using a 5-minute application of Romulin aminoethylcarbazole (AEC) chromogen (BioCare Medical, Concord, CA), which was terminated by rinsing with deionized H2O. Nuclei were counterstained for 20 seconds with Tacha's bluing solution (BioCare Medical). Two blinded observers (QW and MJZ) scored the samples according to a scale of 1–4, where 1 = 0–25% positive staining, 2 = 26–50% positive staining, 3 = 51–75% staining, and 4 = >75% staining.
Transgene construction and genotyping
High-fidelity polymerase chain reaction (PCR) was used to generate a FLAG-tagged human Smurf2 complementary DNA (cDNA; obtained from Dr. Jeffrey Wrana, Samuel Lunenfeld Research Institute, Toronto, Ontario, Canada) that was subcloned into the Not I site of an expression vector containing promoter and enhancer sequence of the mouse Col2a1 gene (EMBL/GenBank/DDBJ no. M65161) (19,20). The orientation and sequence of the Smurf2 cDNA were confirmed by sequence analysis. A Pvu II-Hind III digest of this transgene plasmid liberated a 7.2-kb fragment that was microinjected into fertilized C57BL/6-SJL hybrid oocytes to generate transgenic mice. Founder mice were identified via Southern blot analysis of tail biopsy DNA, and subsequent generations of mice were genotyped via PCR using the following primers: 5′-GGTCATCATCCTGCCTTT-3′ (forward) and 5′-TCCAGAGGCGGTTCTCCT-3′ (reverse).
Processing of tissue for histologic analysis
Mouse knee joints were fixed for 4 days in 10% neutral buffered formalin at 23°C. All samples were decalcified for 3 weeks in 10% w/v EDTA, embedded in paraffin, and cut with a microtome to generate 3-μm–thick sections. Sections were mounted on positively charged slides, baked at 60°C for 30 minutes, deparaffinized in xylene, and rehydrated in decreasing concentrations of ethanol.
Immunohistochemistry of the mouse knee
Mouse knee sections were treated with 3% H2O2 for 20 minutes, and nonspecific antibody binding sites were blocked by incubation with a 1:20 dilution of normal goat serum for 20 minutes. Slides were incubated overnight with rabbit anti–MMP-13 polyclonal antibody (1:100 dilution; Chemicon, Temecula, CA), rinsed with PBS, and incubated for 30 minutes at room temperature with a biotinylated goat anti-rabbit secondary antibody (1:2,000 dilution for MMP-13). After a final rinse with PBS, the slides were placed in deionized H2O containing Tween 20, and antibody binding to antigen was detected following application of HRP-conjugated streptavidin (1:250 dilution), with a 5-minute application of Romulin AEC chromogen. Nuclei were counterstained for 20 seconds with Tacha's bluing solution.
Histologic assessment and grading of arthritis in mouse knee cartilage
Mouse knee joint sections were stained with both Safranin O–fast green and Alcian blue–hematoxylin to allow for visualization of cartilage tissue. Semiquantitative histopathologic grading of Alcian blue–stained knee joint cartilage was performed on sagittal sections using a modified Chambers scoring system (21), where 0 = normal cartilage, 1 = mild superficial fibrillation, 2 = fibrillation and/or clefting extending below the superficial zone, 3 = mild (<20%) loss of noncalcified cartilage, 4 = moderate (20–80%) loss of noncalcified cartilage, 5 = severe (>80%) loss of noncalcified cartilage, and 6 = loss of cartilage to the calcified zone.
Quantification of cartilage/chondrocyte morphologic features
Three-micrometer–thick sagittal sections were harvested every 30 μm from the medial joint compartment of the right knee (4–6 serial sections per joint; 1 joint per mouse) and evaluated for cartilage area using OsteoMeasure software (OsteoMetrics, Decatur, GA). Articular cartilage, which was defined as the area from the tidemark to the joint surface, including the entire surface from the anterior to the posterior edges of both the tibia and the femur, was quantified in each section using an area-calculating algorithm in the software. The area of outlined regions was quantified, and the area values (i.e., numbers of pixels) for every section from a given joint were averaged. Articular chondrocytes were counted per unit area, and the average diameter of articular chondrocytes was determined following calibration of the microscope at a convenient magnification (100×). Five randomly chosen regions of interest from each joint were chosen, and the diameter of all cells within each region of interest was determined. All 3 parameters were determined and averaged in all sections from each mouse; 4–5 mice were analyzed per group.
In situ hybridization
Mice were perfused with 4% paraformaldehyde, and the knees were harvested and further fixed in 4% paraformaldehyde for 3 days at 4°C. After fixation, the samples were decalcified with diethyl pyrocarbonate–treated 10% w/v EDTA, embedded in paraffin, and 6-μm sections were cut. A riboprobe complementary to the type X collagen messenger RNA (mRNA) sequence was labeled with 35S-UTP (Amersham Pharmacia Biotech, Piscataway, NJ), and in situ hybridization was performed using a technique that we have described previously (22).
Microfocal computed tomography (micro-CT) evaluation of mouse knee joints
Prior to histologic processing, knee joints were evaluated via micro-CT using either a Scanco μCT 40 scanner with 55-kVp source (Scanco, Southeastern, PA) or a GE in vitro scanner with a 70-kVp source (GE Medical, Piscataway, NJ). Using one or both of these scanners, joints were scanned at a resolution of 12 μm, with a slice increment of 10 μm. Images from each group were reconstructed at identical thresholds to allow 3-dimensional structural rendering of each joint. Histomorphometric analyses were performed on selected regions between the femoral and tibial growth plates. Parameters assessed included bone volume, bone mineral content, trabecular thickness, and trabecular number in the region.
Mouse sternal chondrocyte cultures
Neonatal mouse sternal chondrocytes were isolated using a previously described method (23). Briefly, tail samples were obtained from 2-dayold pups to establish genotype via PCR. Sternae were harvested and washed in sterile Hanks' balanced salt solution (HBSS), and cells were extracted via a 30-minute digestion with 0.2% Pronase in PBS, a 90-minute digestion with 0.3% collagenase D (Roche Molecular Biochemicals, Indianapolis, IN) in Dulbecco's modified Eagle's medium (DMEM; Gibco, Grand Island, NY), and a 5-hour digestion with fresh 0.3% collagenase D in DMEM. All digestions were performed at 37°C. Cells were filtered through 70-μm filters, washed by centrifugation with fresh HBSS, and cultured in DMEM plus 10% fetal bovine serum (Gibco). Cells were plated in 6-cm dishes (3 × 10⁶/dish) for RNA harvest or in 6-well plates (2 × 10⁵/well) for luciferase reporter assays.
Luciferase-based detection of TGFβ1 signaling
Mouse sternal chondrocytes cultured in 6-well plates were transfected with p3TP-luciferase plasmid using Superfect (Qiagen, Chatsworth, CA) according to the manufacturer's instructions. The SV40 Renilla luciferase plasmid was cotransfected to determine transfection efficiency, as previously described (17). The ratio of DNA to transfection reagent used for all experiments was 1:3 (w/v). Three hours after transfection, cultures were treated as described, and 40 hours later, cells were lysed, and extracts were prepared and analyzed using the Dual Luciferase Assay System (Promega, Madison, WI) according to the manufacturer's instructions.
Western blotting
After rinsing sternal chondrocytes with PBS, protein was extracted using Golden lysis buffer containing protease inhibitor cocktail tablets (Roche Molecular Biochemicals) as previously described (24). Lysates were centrifuged at 12,000g, and insoluble material was removed. Protein concentration was determined according to the Bradford method, and 25-μg aliquots of protein extract were separated by sodium dodecyl sulfate–polyacrylamide gel electrophoresis (SDS-PAGE; 10% polyacrylamide) and then transferred to a polyvinylidene difluoride membrane (Schleicher & Schuell, Keene, NH). The blots were probed overnight at 4°C with antibodies against Smad2, pSmad2, and pSmad3 (all from Cell Signaling Technology, Beverly, MA), Smad3 (Santa Cruz Biotechnology, Santa Cruz, CA), and the TGFβRI (R&D Systems, Minneapolis, MN). All primary antibodies were applied at a dilution of 1:1,000. Blots were further incubated for 1 hour at 20°C in the presence of HRP-conjugated secondary antibodies against rabbit or mouse (both from Bio-Rad, Richmond, CA) at a dilution of 1:3,000. The immune complexes were detected using ECL-Femto (Pierce, Rockford, IL) and visualized via exposure to Kodak X-Omat AR film (Kodak, Rochester, NY).
Immunoprecipitation
Sternal chondrocytes were cultured for 30 hours in 6-cm dishes and then pretreated for 3 hours with the proteasome inhibitor MG132 (10 μM) or with vehicle (DMSO; 10 μM), followed by a 30-minute treatment with 5 ng/ml TGFβ1. Protein lysates extracted using Golden lysis buffer as described above were incubated with protein A/G–Sepharose beads (Amersham Pharmacia Biotech) that had been preconjugated with the rabbit anti-mouse pSmad3 antibody used for Western blotting. After a 90-minute incubation, immune complexes were precipitated via centrifugation. The pelleted beads were washed once in fresh Golden lysis buffer, and the bound proteins were eluted in gel-loading buffer and separated by SDS–PAGE using 10% gels. Western analyses were performed as described above using a ubiquitin antibody diluted 1:1,000 (Cell Signaling Technology), followed by incubation with an anti-rabbit secondary antibody and exposure to Kodak X-Omat AR film.
Real-time reverse transcription–PCR (RT-PCR)
Total RNA was extracted from sternal chondrocytes using the RNeasy kit (Qiagen). One-microgram aliquots were reverse transcribed into cDNA using the Reverse-iT Max kit (ABgene Thermo Fisher Scientific, Rockford, IL) followed by treatment with RNase (Invitrogen, San Diego, CA) at 37°C for 20 minutes. Samples were diluted 5-fold prior to PCR amplification. Real-time PCR was performed as previously described (25) using the Rotor-Gene real-time DNA amplification system (Corbett Research, San Francisco, CA), with the double-strand–specific dye SYBR Green I used to monitor DNA synthesis. Data from each sample were normalized to β-actin. Primers used for real-time RT-PCR were designed to generate products between 150 bp and 220 bp in length. The following primer sequences were used: for β-actin, 5′-AGATGTGGATCAGCAAGCAG-3′ (forward) and 5′-GCGCAAGTTAGGTTTTGTCA-3′ (reverse); for Smurf2, 5′-GATCCAAAGTGGAATCAGCA-3′ (forward) and 5′-TGGCATTGGAAAGAAGACG-3′ (reverse); for type II collagen, 5′-GCCAAGACCTGAAACTCTGC-3′ (forward) and 5′-GCCATAGCTGAAGTGGAAGC-3′ (reverse); for type X collagen, 5′-CTTTGTGTGCCTTTCAATCG-3′ (forward) and 5′-GTGAGGTACAGCCTACCAGTTTT-3′ (reverse); for alkaline phosphatase, 5′-TGACCTTCTCTCCTCCATCC-3′ (forward) and 5′-CTTCCTGGGAGTCTCATCCT-3′ (reverse); and for vascular endothelial growth factor, 5′-CAGGCTGCTGTAACGATGAA-3′ (forward) and 5′-GCATTCACATCTGCTGTGCT-3′ (reverse).
Statistical analysis
Results of all quantitative assays were analyzed via analysis of variance (ANOVA) with sample sizes between 3 and 5, and calculated P values less than 0.05 were considered significant between-group differences. Semiquantitative histologic and immunohistochemical grading of cartilage was analyzed using the Mann-Whitney-Wilcoxon test, and as with the ANOVA, P values less than 0.05 were considered significant between-group differences.
RESULTS
Association between Smurf2 expression and arthritis in human articular cartilage
Samples of articular cartilage from patients undergoing total knee arthroplasty because of OA and from trauma/amputation patients were processed for histologic assessment according to the Mankin scale to determine the severity of arthritis (18) and for immunohistochemical analysis with an anti-human Smurf2 polyclonal antibody. The initial Mankin grading facilitated the stratification of OA samples into 2 groups: low Mankin grade (mild/early OA; average score 1.7) and high Mankin grade (severe OA; average score 5.0). While the normal cartilage group did not show detectable immunoreactivity with the Smurf2 antibody (Figure 1A), both the low and high Mankin grade OA groups displayed significant cellular Smurf2 staining (Figures 1B and 1C). As expected, staining was generally localized to the nucleus. Immunohistochemical detection of vimentin showed strong cellular expression in all groups, confirming the integrity of all samples tested (data not shown). Immunograding of all samples revealed a statistically significant up-regulation of Smurf2 in both the low and high Mankin grade groups as compared with the normal controls (Figure 1D). These results establish a strong association between human OA and Smurf2 expression.
Figure 1.
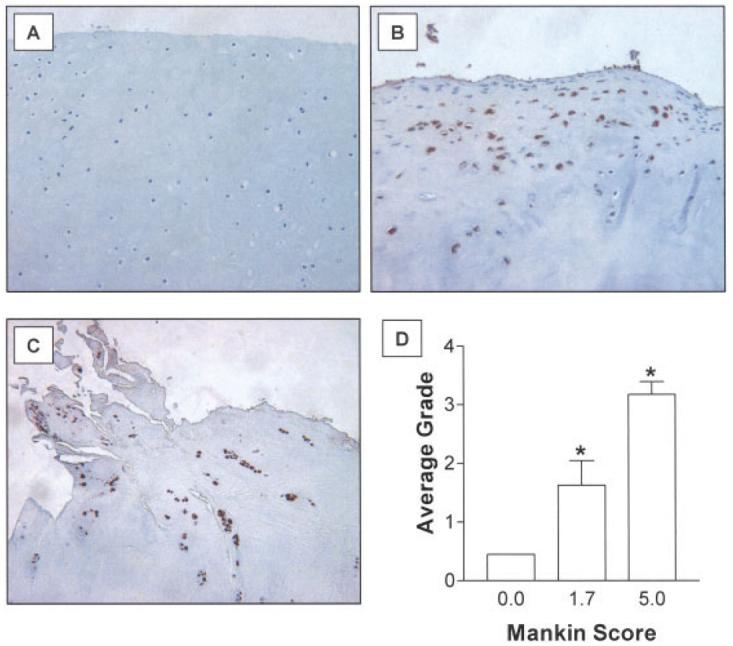
Up-regulation of Smurf2 in human osteoarthritis (OA). Samples of normal cartilage from trauma patients and OA cartilage from patients undergoing knee arthroplasty were fixed, processed for immunohistochemical assessment, and 3-μm–thick sections were cut and stained. OA severity was assessed using the Mankin grading system, and Smurf2 immunostaining was graded as described in Materials and Methods. OA samples were stratified into 2 groups: low Mankin grade (average score 1.7 [range 0–2.7]; mild/early OA) and high Mankin grade (average score 5.0 [range 3.3–8.7]; severe OA). A–C, Representative cartilage sections from a normal subject (A), an OA patient with a low Mankin grade (B), and an OA patient with a high Mankin grade (C). (Original magnification × 100.) D, Scoring of cartilage samples for the level of Smurf2 immunoreactivity. Values are the mean ± SEM of 20 normal samples, 9 low Mankin grade OA samples, and 13 high Mankin grade OA samples. * = P < 0.05 versus the normal group, by Mann-Whitney-Wilcoxon test.
Smurf2 transgene overexpression
To further establish the role of Smurf2 in articular cartilage, transgenic mice were engineered to overexpress FLAG-tagged human Smurf2 protein in chondrocytes. Cartilage-specific expression was achieved using a construct that combines promoter and enhancer sequences of the Col2a1 gene (26). (A schematic of the structure of the type II collagen–human Smurf2 transgene is available upon request from the corresponding author.) Three founder mice and subsequent generations of heterozygous progeny were identified by Southern blotting and by PCR using a probe and PCR primers oriented as in the schematic (available upon request from the corresponding author). All 3 founders were bred to establish 3 independent lines. Transgenic mice were of similar size as their wild-type (WT) littermates and showed no gross abnormalities of phenotype.
Complementary approaches were used to assess the expression of exogenous Smurf2 protein in transgenic mice. First, sternal chondrocytes were isolated from WT and type II collagen α1-Smurf2 (Col2a1-Sf2)–transgenic mice, and real-time RT-PCR was performed to assess mRNA expression of the Smurf2 transcript. The primers used amplify a region in the Smurf2 coding sequence that is identical in mice and humans. Chondrocytes from 3 separate Col2a1-Sf2–transgenic mouse lines showed a >2-fold increase in transcript levels as compared with cells from the WT mice. (PCR data from Col2a1-Sf2–transgenic and WT mouse lines are available upon request from the corresponding author.) Furthermore, Western analysis showed that transgenic chondrocytes from line 3 expressed a FLAG-tagged protein consistent with the molecular weight of Smurf2 (86 kd), whereas WT chondrocytes did not. (Western blot data are available upon request from the corresponding author.) All subsequent analyses were performed on tissues and cells harvested from line 3 animals.
To establish in vivo evidence that articular chondrocytes overexpressed the transgene, immunohistochemical analyses were performed. Articular chondrocytes from 2-month-old and 4-month-old transgenic mice showed expression of FLAG-tagged Smurf2, whereas articular chondrocytes from the WT mice did not. (Photomicrographs showing transgene expression in articular cartilage are available upon request from the corresponding author.) This finding is consistent with a recently published study demonstrating strong activation of the Col2a1 promoter in mouse articular chondrocytes, even at 6 months of age (27). It should be noted that weak, but detectable, expression was also seen in the growth plate of Col2a1-Sf2–transgenic mice, whereas all other tissues were transgene-negative (data not shown). Taken together, these findings establish that there is overexpression of Smurf2 in chondrocytes from these transgenic mice.
Assessment of arthritis phenotype in transgenic mice
To determine whether Smurf2 overexpression leads to cartilage degradation in vivo, knees were harvested from WT and Col2a1-Sf2 mice at ages 2 months, 4.5 months, 6.5 months, and 8 months, and the cartilage was evaluated histologically and histomorphometrically. Compared with age-matched WT controls, cartilage from Col2a1-Sf2 mice had less Safranin O staining at all ages examined. Transgenic mice did not typically have defects in the femoral or tibial articular surfaces at 2 months (data not shown) or at 4.5 months (Figure 2A). By 6.5 months, however, fibrillation and clefting appeared in the joints of transgenic mice (Figure 2B). This mild surface degeneration was often accompanied by pericellular Safranin O staining, suggestive of compensatory proteoglycan synthesis by articular chondrocytes (28). The reduction in Safranin O staining in the transgenic group was most pronounced at 8 months of age, when a significant degeneration of the articular cartilage was observed (Figure 2C). This degeneration was present in all 3 founder lines between the ages of 8 months and 10 months and ranged from extensive fibrillation and clefting (Figure 2C) to erosion beyond the tidemark into the subchondral bone area in both the tibial plateau and the femoral condyle (Figure 2D). These changes were not accompanied by pannus formation or synovial inflammation, distinguishing the Col2a1-Sf2 phenotype from an inflammation-related arthritis.
Figure 2.

Osteoarthritis-like phenotype of knee joints from Col2a1–Smurf2 (Col2a1-Sf2)–transgenic mice. Knee joints were harvested, processed for histologic assessment, and 3-μm–thick sections were stained with Safranin O–fast green. Representative sections from Col2a1-Sf2 mice at ages 4.5 months (A), 6 months (B), and 8 months (C and D) are shown. Red arrows in C indicate areas of fibrillation and clefting in the cartilage. Black arrows in D indicate eburnation of subchondral bone. (Original magnification × 40.)
To extend the histologic analysis of articular cartilage, the OA-like phenotype was subsequently examined in mouse knee joints obtained at ages 2 months (5 WT and 7 Col2a1-Sf2 mice), 4.5 months (7 WT and 7 Col2a1-Sf2 mice), and 8 months (12 WT and 22 Col2a1-Sf2 mice) and graded according to a modified Chambers scoring system, as previously described (21). Joints from 2-month-old and 4.5-month-old Col2a1-Sf2 mice had a mean ± SEM OA grade of 1 ± 0.32 and 1.1 ± 0.29, respectively, which was significantly different from the OA grade in WT mice of the same ages (grade 0 at both time points; P < 0.05 for each comparison, by Mann-Whitney-Wilcoxon test). By 8 months of age, Col2a1-Sf2 joints had a higher mean grade of 4.8 ± 0.99, indicating extensive cartilage destruction, as compared with a mean grade of 0.1 ± 0.02 in WT joints (P < 0.05 by Mann-Whitney-Wilcoxon test). These findings confirm the age-dependence and severity of joint degeneration in the Col2a1-Sf2 population.
To corroborate the grading data, we performed histomorphometry to quantify the cartilage area in WT and Col2a1-Sf2 mice. At 2 months of age, there was a 25% decrease in cartilage area in joints from the Col2a1-Sf2 mice (Figure 3A), indicating a reduction of cartilage volume even before the surface defects emerged. Interestingly, at 4.5 months of age, transgenic mice displayed a 35% increase in cartilage volume as compared with the WT controls (Figure 3A). This finding is consistent with the histology section shown in Figure 2A and is reminiscent of the cartilage “swelling” that is typically seen in OA patients. While there was no difference between the cartilage area values in WT and transgenic mice at 6.5 months of age, by 8 months, significant cartilage loss was apparent (Figure 3A), confirming the erosion and degradation seen in the representative histology section (Figure 2D). These findings provide quantitative evidence of a cartilage phenotype in Col2a1-Sf2 mice that resembles the progression of cartilage degeneration that is seen in the course of human OA.
Figure 3.
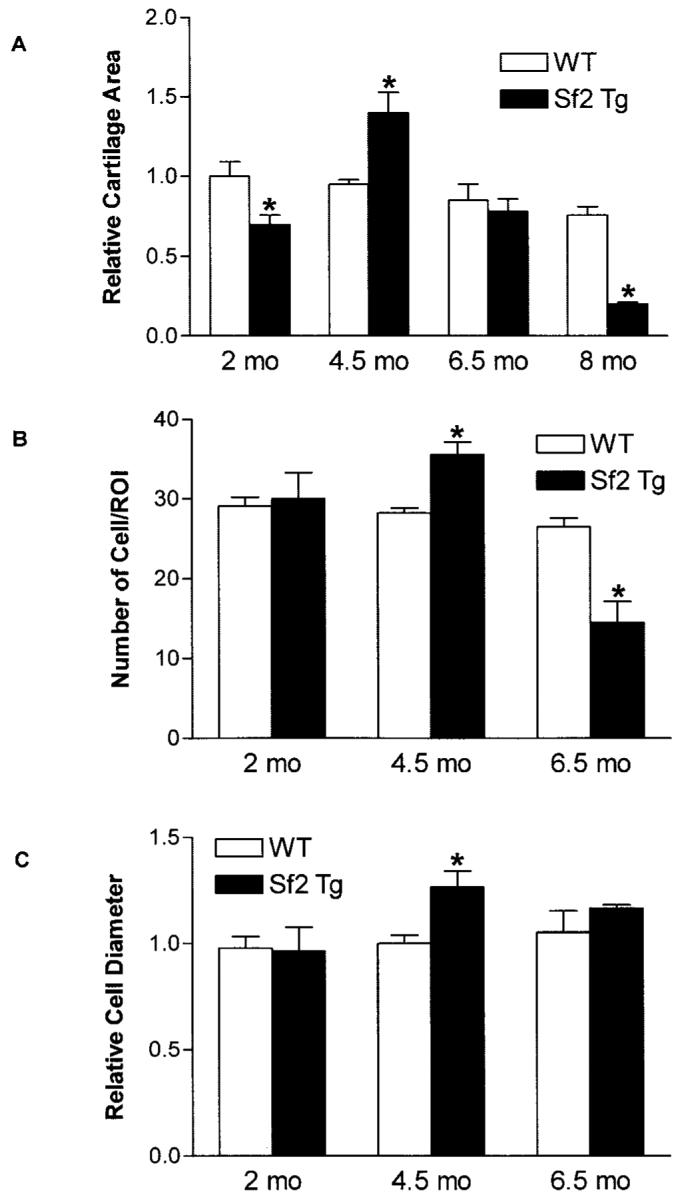
Histomorphometric analysis of the osteoarthritis (OA) phenotype in Col2a1–Smurf2 (Col2a1-Sf2)–transgenic (Sf2 Tg) mice. Quantitative histomorphometry was performed in wild-type (WT) and Col2a1-Sf2 mice to compare the relative cartilage area at ages 2, 4.5, 6.5, and 8 months (A), the relative number of chondrocytes per region of interest (ROI) at ages 2, 4.5, and 6.5 months (B), and the relative chondrocyte diameter at ages 2, 4.5, and 6.5 months (C). Values are the mean and SEM of 3–4 mice per group. * = P < 0.05 versus WT mice, by analysis of variance.
In both human disease and animal models of OA, common morphologic features include increased cellular proliferation (cloning) and increased cell diameter. Thus, OsteoMeasure software was used to compare the cell number per unit area and the average cell diameter in the same sections that were used for grading and evaluation of the cartilage area in mice ages 2 months, 4.5 months, and 6.5 months (Figure 2A). While there was no appreciable difference in knees from 2-month-old Col2a1-Sf2–transgenic mice, a 28% greater number of chondrocytes per unit area was seen in 4.5-month-old mice and 45% fewer cells per unit area at in 6.5-month-old mice, as compared with WT mice (Figure 3B). Furthermore, at 4.5 months of age, the cells were 32% larger in the Col2a1-Sf2–transgenic cartilage compared with WT cartilage (Figure 3C). The cell number and size phenotypes can be seen in the histology section presented in Figure 2A (cell number) and in Figure 2C (cell diameter). These findings provide further support for the hypothesis that Col2a1-Sf2 mice exhibit a cartilage disorder resembling OA.
To further assess the arthritis phenotype of articular chondrocytes in Col2a1-Sf2–transgenic mice, we performed immunohistochemistry to examine the expression of MMP-13, as well as in situ hybridization to examine the expression of type X collagen. As expected, there was increased type X collagen mRNA in joints from transgenic mice as compared with WT mice (Figures 4A and B). Furthermore, MMP-13 was up-regulated in the articular cartilage of 8-month-old Col2a1-Sf2–transgenic mice as compared with age-matched WT controls (Figures 4C and D). Overall, these findings support the idea that articular chondrocytes from Col2a1-Sf2–transgenic mice display a molecular phenotype that is consistent with OA.
Figure 4.

Increased type X collagen mRNA and matrix metalloproteinase 13 (MMP-13) protein in knee joints from Col2a1–Smurf2 (Col2a1-Sf2)–transgenic (Sf2 Tg) mice compared with wild-type (WT) mice. Knee joints from 6-month-old (A and B) or 8-month-old (C and D) Col2a1-Sf2 and WT mice were harvested and processed for analysis by immunohistochemistry or in situ hybridization. Sections were evaluated for type X collagen (colX) expression (A and B) (arrows) via in situ hybridization in the 6-month-old mice and for MMP-13 expression (C and D) (arrows) via immunohistochemistry in the 8-month-old mice. Representative sections are shown (original magnification × 10 in A and B; × 40 in C and D).
In addition to the various articular cartilage phenotypes that manifest during human OA, there are bone phenotypes, including osteophyte formation and subchondral sclerosis. Micro-CT assessment of the mineralized tissues in WT and Col2a1-Sf2–transgenic mouse knee joints revealed increased mineralization of the meniscus and periarticular ectopic bone formation in joints from 8-month-old transgenic mice as compared with joints from age-matched WT mice (Figures 5A–C). The sites of ectopic mineralization were consistent with osteophytes. Quantification of various bone parameters within the volume between the femoral and tibial growth plates supported these general conclusions about the morphologic features. Compared with WT joints, transgenic joints had a 22% increase in bone volume and a 26% increase in bone mineral content, which is consistent with ectopic mineralization and the sclerotic nature of the subchondral bone (Figure 5D). While we detected no significant difference between WT and transgenic mice in terms of the overall thickness of the trabeculae within the subchondral regions, there was a 25% reduction in the trabecular number in transgenic mice as compared with WT mice (Figure 5D). Overall, these findings suggest that the arthritis arising in the cartilage of Col2a1-Sf2 mice leads to changes in the bony tissues of the joint, findings that are consistent with the characteristic osteophyte formation and subchondral sclerosis seen in humans with OA.
Figure 5.
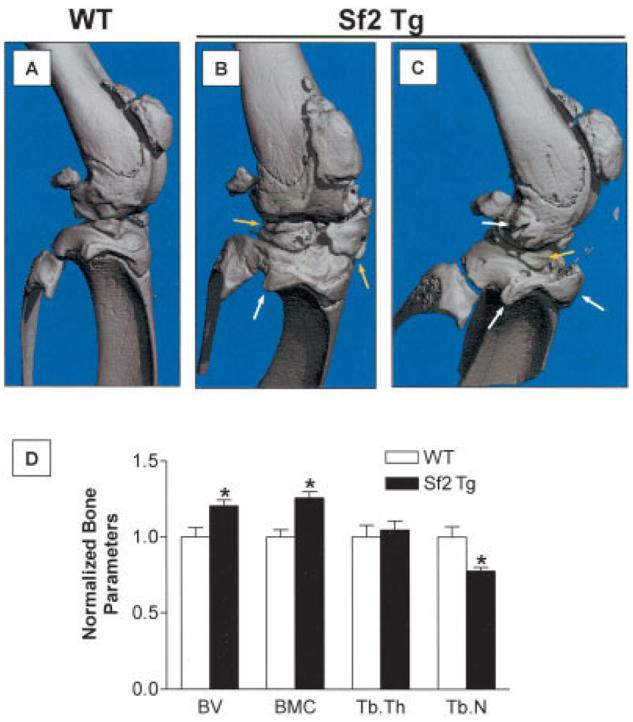
Osteophyte formation and subchondral sclerosis in the knee joints of Col2a1–Smurf2 (Col2a1-Sf2)–transgenic (Sf2 Tg) mice. Knee joints from 8-month-old wild-type (WT) and Col2a1-Sf2 mice were evaluated. Microfocal computed tomography was performed to evaluate mineralized tissue in the joint region. A–C, Representative 3-dimensional reconstructions of joints from a WT mouse (A) and from 2 different Col2a1-Sf2 mice (B and C), showing meniscal ossification (yellow arrows) and periarticular ectopic bone formation (osteophytes) (white arrows). D, Quantification of bone parameters in WT and Col2a1-Sf2 mice. Bone volume (BV), bone mineral content (BMC), trabecular thickness (TbTh), and trabecular number (TbN) in the region between the femoral and tibial physes were determined. Average values for each parameter in the Col2a1-Sf2 mice were normalized to those in the WT mice. Values are the normalized mean and SEM of 6 mice per group. * = P < 0.05 versus WT mice, by analysis of variance.
Assessment of TGFβ signaling in chondrocytes overexpressing Smurf2
The functionality of the overexpressed Smurf2 protein in chondrocytes was assessed in sternal chondrocytes from neonatal (3-day-old) Col2a1-Sf2–transgenic mice. To assess TGFβ signaling, chondrocytes from WT and Col2a1-Sf2 mice were transfected with the p3TP-luciferase reporter and then treated with 5 ng/ml of TGFβ1 or with vehicle. Smurf2 overexpression in transgenic cells led to a decrease in both basal and TGFβ1-stimulated signaling of the p3TP-luciferase reporter (Figure 6A), and this diminished TGFβ signaling correlated with the increased expression of markers of hypertrophy. (Data on the induction of chondrocyte hypertrophy by overexpression of Smurf2 are available upon request from the corresponding author).
Figure 6.

Inhibition of transforming growth factor β (TGFβ) signaling in neonatal sternal chondrocytes overexpressing Smurf2. Sternal chondrocytes were isolated from 3-day-old wild-type (WT) and Col2a1–Smurf2 (Col2a1-Sf2)–transgenic (Sf2 Tg) mice. A, Sternal chondrocytes were cotransfected with the p3TP-luciferase (p3TP-Luc) reporter and the SV40 Renilla luciferase plasmid. Cells were treated with 5 ng/ml of TGFβ1 or with vehicle (control [con]), and after 48 hours, cells were lysed, and extracts were evaluated for luciferase activity. Values are the mean and SEM of 3 mice per group. * = P < 0.05 and ** = P < 0.05 versus vehicle-treated WT chondrocytes; *** = P < 0.05 versus TGFβ1-treated WT chondrocytes, by analysis of variance. B and C, Sternal chondrocytes were treated with 5 ng/ml of TGFβ1 for 30 minutes, and total cellular protein was extracted, and the expression of pSmad3, Smad3, and β-actin proteins was evaluated by Western blotting. Fold changes in protein levels are indicated at the top of each representative blot (from 3 repeats), after controlling for protein loading (versus β-actin), using National Institutes of Health ImageJ software. Molecular weight markers are shown at the left. D, Using an anti-pSmad3 antibody, immunoprecipitation (IP) was performed on extracts of sternal chondrocytes that had been pretreated for 3 hours with 10 μM MG132 or vehicle, followed by a 30-minute treatment with 5 ng/ml of TGFβ1. The immunoprecipitated proteins were analyzed by Western blotting (WB) using a polyclonal anti-ubiquitin antibody. Western analysis of input samples was performed using anti-pSmad3 or anti–β-actin antibodies. Blots are representative of a series of 3 repeats. Ub-pSmad3 = ubiquitinated pSmad3.
To elucidate the molecular mechanisms behind the effects on TGFβ signaling in Col2a1-Sf2 chondrocytes, we performed Western analyses, assessing the levels of several candidate Smurf2 substrates (Figures 6B and C). Thirty hours after plating, sternal chondrocytes were treated for 30 minutes with either 5 ng/ml of TGFβ1 or vehicle. While overexpression of Smurf2 had little effect on basal or TGFβ1-stimulated pSmad2, Smad2, or TGFβRI levels in Col2a1-Sf2 chondrocytes (data available upon request from the corresponding author), there was a significant decrease in the pSmad3 pool as compared with WT control cells following stimulation with TGFβ1 (59% reduction, as quantified by NIH ImageJ software [National Institutes of Health, Bethesda, MD; online at: http://rsbweb.nih.gov/ij/]) (Figure 6B). In contrast, total Smad3 levels were reduced by only 16% in the transgenic cell population (Figure 6C). These findings strongly implicate pSmad3 as a molecular target that mediates the effects of Smurf2 overexpression on TGFβ signaling in these mice.
Immunoprecipitation Western blotting was performed to examine whether the reduction in pSmad3 seen in transgenic chondrocytes was due to Smurf2-mediated ubiquitination and degradation. Thirty hours after plating, neonatal sternal chondrocytes from WT and Col2a1-Sf2–transgenic mice were preexposed to the proteasome inhibitor MG132 (10 μM) or vehicle (DMSO) for 3 hours, followed by a 30-minute exposure to 5 ng/ml of TGFβ1 or vehicle. Total cell protein extracts were prepared and immunoprecipitations were performed using anti-pSmad3 antibody conjugated to protein A/G–Sepharose beads. Western analysis using an anti-ubiquitin antibody revealed enhanced ubiquitination of pSmad3 in Col2a1-Sf2 chondrocytes during blockade of proteasomal degradation by MG132 (Figure 6D) both under basal conditions (lane 8 versus lane 4) and following stimulation with TGFβ1 (lane 7 versus lane 3). As expected, the ubiquitin ladder for pSmad3 was not present in WT or Col2a1-Sf2 cells that had not been treated with MG132 (Figure 6D, lanes 1, 2, 5, and 6).
To demonstrate that the ubiquitination pattern correlated with the absolute amount of pSmad3 in each sample prior to immunoprecipitation, we performed Western analyses of pSmad3 and β-actin in the input lysates. As expected, increased pSmad3 ubiquitination correlated with decreased pSmad3 levels in the input lysates (Figure 6D). MG132 preserved pSmad3 in both WT and transgenic cells, confirming that these transgenic mice indeed had reduced levels of pSmad3 because of proteasomal degradation. Overall, these findings establish pSmad3 as a target for Smurf2 ubiquitination and suggest that its reduction in Col2a1-Sf2–transgenic mice could be a participating mechanism in the observed OA-like phenotype.
DISCUSSION
Despite the significant health and financial burden of OA on the general population, progress toward understanding the molecular mechanism(s) of the disease has been limited. This may be due to the historical viewpoint that OA results simply from aging (29). While there are several transgenic/knockout mouse models of OA that identify important roles of key matrix molecules, enzymes, and cytokines in the disease process (for review, see refs. 30 and 31), the underlying cellular and molecular changes that precede and dictate these contributing factors are unknown. In this regard, in vitro and in vivo evidence suggests that reduced TGFβ signaling leads to inappropriate maturation of articular chondrocytes and the emergence of an OA-like phenotype in mice (13,14). By proceeding to a hypertrophic state during reduced TGFβ signaling, articular chondrocytes recapitulate endochondral ossification, reduce their expression of important matrix molecules, such as aggrecan (32) and type II collagen (33), and begin to produce matrix-degrading enzymes, such as MMP-9 and MMP-13 (34,35). The emergence of other hypertrophic hallmarks, such as type X collagen (11), and the production of other fibrillar collagens occurs (5), with the cells frequently becoming apoptotic (12). Thus, evidence suggests that the cellular phenotype may partly drive the disease process. Establishing how the cellular phenotype is controlled in this context is essential.
With this in mind, we initially hypothesized that endogenous negative regulators of the TGFβ pathway represent possible initiators of disease. Given our finding that the endogenous negative regulator Smurf2 was highly up-regulated in human OA cartilage (Figure 1), our aim became to address the role of Smurf2 as an inhibitor of the TGFβ pathway and a candidate initiator of articular chondrocyte maturation leading to OA-like disease. Col2a1-Sf2–transgenic mice were generated specifically to evaluate the impact of forced overexpression of Smurf2 on the integrity of the murine joint.
As expected, use of the type II collagen promoter/enhancer in the generation of the Col2a1-Sf2 mice facilitated chondrocyte-specific overexpression of the FLAG-tagged transgene at both the mRNA and protein levels (data available upon request from the corresponding author). Although the main phenotype that we observed in transgenic mice was in the articular cartilage, a mild growth-plate phenotype was also present. This phenotype was characterized by an increase in the size of the hypertrophic zone and disorganization of the columnar organization of the cells. Despite this, no developmental or growth effect was detected.
In correlation with an accelerated maturation of sternal chondrocytes ex vivo (data available upon request from the corresponding author), Col2a1-Sf2 mice displayed the progressive development of an OA-like degradation of articular cartilage, as shown by histologic/histomorphometric (Figures 2 and 3) and micro-CT (Figure 5) analyses. The phenotype resembled OA based on the slow disease progression (8 months), the early tissue and cellular changes, including proteoglycan loss, minor fibrillation, and cloning and hypertrophy of the articular chondrocytes, as well as the emergence of periarticular ectopic bone formation and changes in the subchondral bone in advanced disease that are consistent with the osteophyte formation and sclerosis seen in OA in humans.
Compared with other genetic mouse models of OA, the presentation of cartilage degeneration in the Col2a1-Sf2–transgenic mouse coupled with the finding that Smurf2 is up-regulated in human OA suggest that these mice represent an important murine-based recapitulation of the disease process. This is in contrast to other mouse models of OA that are genetic constructions used to assess molecular or signaling pathway mechanisms of disease. For example, gene deletion of aggrecan or the α1 chain of type II collagen leads to increased prevalence of arthritis, but the phenotype is difficult to assess because of the development of a cartilage deficiency syndrome in the aggrecan mutant (36) and the complete lack of endochondral bone in the skeleton of the type II collagen mutant (37). In the case of the fibromodulin/biglycan double-knockout mouse, a severe OA-like phenotype occurs by the age of 6 months in the temporomandibular joint and in the knee, but the arthritis may be secondary to tendon ossification and joint/gait impairment (38,39). Finally, consistent with the role of MMP-13 as a collagenase that degrades type II collagen, a tetracycline-inducible cartilage-specific overexpression of MMP-13 leads to an OA-like degeneration of knee articular cartilage (40). The arthritis phenotype, which occurs rapidly following doxycycline induction of the transgene (within 21 days), does not mimic the slow progression of disease that is a hallmark of OA. While these and other examples of experimental OA establish the idea that altered matrix biochemistry is a critical participant in the genesis of disease, they do not replicate the degenerative process with fidelity and do not suggest how fundamental changes in cell behavior, which ultimately govern the process of matrix maintenance, may actually be induced at the onset of disease.
It is likely that the precursor step to a critical defect in matrix biochemistry involves an initial alteration of the phenotype of articular chondrocytes, followed by subsequent dysregulation of the matrix-maintaining function of the cells. The models of OA that have led to the development of this concept are the dominant-negative TGFβRII-transgenic mouse (13) and the Smad3-knockout mouse (14). Loss of signaling in the TGFβ axis in these models leads to the inappropriate maturation of articular chondrocytes and the emergence of an OA-like phenotype characterized by progressive fibrillation, clefting, and loss of articular cartilage, with the emergence of osteophytes. From a signaling perspective, the Col2a1-Sf2 mouse is most similar to the Smad3-knockout mouse, since both of these models involve reduction of Smad3 function. Additionally, our group has recently determined that chondrocytes from Smad3-knockout mice display not only reduced TGFβ/Smad3 signaling, but also enhanced bone morphogenetic protein (BMP) signaling and, thus, an even stronger drive to undergo hypertrophy (41). Overall, the findings in these genetic models of OA support the hypothesis that induction of an OA-like cartilage arthropathy is initiated by inappropriate maturation of articular chondrocytes, which then likely leads to a failure of the cells to maintain the matrix.
Given the robust arthritic disease in mice with reduced TGFβ signaling, as well as the implication that Smurf2 is a negative regulator of the TGFβ pathway, we performed experiments to study the TGFβ signaling phenotype. Indeed, Smurf2 overexpression in transgenic mice targeted the TGFβ pathway, as evidenced by reduced basal and TGFβ1-induced levels of p3TP-luciferase activity. Although we do not provide direct evidence of a physical interaction between pSmad3 and Smurf2, we do show the reduced level and enhanced ubiquitination of pSmad3 in sternal chondrocytes from Col2a1-Sf2–transgenic mice as compared with sternal chondrocytes from WT mice (Figure 6). Interestingly, WT and Col2a1-Sf2 chondrocytes had similar levels of Smad2, pSmad2, Smad3, and TGFβRI (data available upon request from the corresponding author), which suggests that the TGFβ signaling phenotype in transgenic cells was not likely due to their targeted degradation.
These ex vivo signaling results are in contrast to several previously published reports that have identified multiple substrates for Smurf2. Several studies have indicated that Smurf2 ubiquitinates and degrades Smad1 and Smad2 (42), pSmad2 (43), and the TGFβRI in a Smad7-dependent manner (44). There are 2 fundamental differences between these earlier studies and our present study. First, the previous experiments were performed on TGFβ/BMP signaling–depleted 293T or COS-1 cells, whereas our study was performed on chondrocytes that are known to possess functional pathways. Second, all participating signaling molecules used in the previous studies (i.e., the Smad/receptor targets, Smurf2, ubiquitin) were typically overexpressed via transfection, whereas our study evaluated the signaling activity of endogenous proteins. While the previous studies that mapped the function of Smurf2 provide information about possible protein–protein interactions and the potential for given substrates to be ubiquitinated, these fundamental interactions may not accurately reflect the physiology that occurs in a specific cell, either in vivo or ex vivo. We suggest that the findings presented herein firmly establish a physiologically relevant targeting of pSmad3 by Smurf2, which leads to signaling alterations in the chondrocyte system, with the caveat that our results were collected in sternal chondrocytes and not in articular chondrocytes.
In conclusion, the findings presented herein identify a strong up-regulation of Smurf2 in the articular cartilage of OA patients, establish that in vivo overexpression of Smurf2 in cartilage leads to inappropriate articular chondrocyte maturation and the development of an OA-like phenotype, and document that the physiologically relevant action of Smurf2 in chondrocytes includes ubiquitination and degradation of pSmad3. We speculate that these specific signaling effects are candidate contributors to the OA process seen in the transgenic mice. Overall, the Col2a1-Sf2–transgenic mouse provides an advance in the effort to identify mechanisms that can drive inappropriate articular chondrocyte maturation and can initiate the OA disease process in particular. We therefore suggest that up-regulation of Smurf2 represents a novel candidate pathogenic mechanism of OA.
Acknowledgments
Dr. O'Keefe's work was supported by NIH grants R01-AR-048681 and R01-AR-38945. Dr. Zuscik's work was supported by a pilot grant funded through NIH grant P01-AG-018254 and by an Arthritis Investigator award from the Arthritis Foundation. Dr. Rosier's work was supported by NIH grants R01-AR-045700 and 5P50-AR-054041-03.
REFERENCES
- 1.Prevalence of disabilities and associated health conditions among adults—United States, 1999 [published erratum appears in MMWR Morb Mortal Wkly Rep 2001;50:149] MMWR Morb Mortal Wkly Rep. 2001;50:120–5. [PubMed] [Google Scholar]
- 2.Lawrence RC, Helmick CG, Arnett FC, Deyo RA, Felson DT, Giannini EH, et al. Estimates of the prevalence of arthritis and selected musculoskeletal disorders in the United States. Arthritis Rheum. 1998;41:778–99. doi: 10.1002/1529-0131(199805)41:5<778::AID-ART4>3.0.CO;2-V. [DOI] [PubMed] [Google Scholar]
- 3.Buckwalter JA, Mankin HJ, Grodzinsky AJ. Articular cartilage and osteoarthritis. Instr Course Lect. 2005;54:465–80. [PubMed] [Google Scholar]
- 4.Goldring MB. The role of the chondrocyte in osteoarthritis [review] Arthritis Rheum. 2000;43:1916–26. doi: 10.1002/1529-0131(200009)43:9<1916::AID-ANR2>3.0.CO;2-I. [DOI] [PubMed] [Google Scholar]
- 5.Aigner T, Gluckert K, von der Mark K. Activation of fibrillar collagen synthesis and phenotypic modulation of chondrocytes in early human osteoarthritic cartilage lesions. Osteoarthritis Cartilage. 1997;5:183–9. doi: 10.1016/s1063-4584(97)80013-1. [DOI] [PubMed] [Google Scholar]
- 6.Martel-Pelletier J, Mineau F, Jovanovic D, Di Battista JA, Pelletier JP. Mitogen-activated protein kinase and nuclear factor κB together regulate interleukin-17-induced nitric oxide production in human osteoarthritic chondrocytes: possible role of transactivating factor mitogen–activated protein kinase–activated protein kinase (MAPKAPK) Arthritis Rheum. 1999;42:2399–409. doi: 10.1002/1529-0131(199911)42:11<2399::AID-ANR19>3.0.CO;2-Y. [DOI] [PubMed] [Google Scholar]
- 7.Buckwalter JA, Mankin HJ. Articular cartilage. J Bone Joint Surg Am. 1997;79:600–32. [Google Scholar]
- 8.Martel-Pelletier J, Pelletier JP, Fahmi H. Cyclooxygenase-2 and prostaglandins in articular tissues. Semin Arthritis Rheum. 2003;33:155–67. doi: 10.1016/s0049-0172(03)00134-3. [DOI] [PubMed] [Google Scholar]
- 9.Smith GN., Jr The role of collagenolytic matrix metalloproteinases in the loss of articular cartilage in osteoarthritis. Front Biosci. 2006;11:3081–95. doi: 10.2741/2034. [DOI] [PubMed] [Google Scholar]
- 10.Nagase H, Kashiwagi M. Aggrecanases and cartilage matrix degradation. Arthritis Res Ther. 2003;5:94–103. doi: 10.1186/ar630. [DOI] [PMC free article] [PubMed] [Google Scholar]
- 11.Aigner T, Reichenberger E, Bertling W, Kirsch T, Stoss H, von der Mark K. Type X collagen expression in osteoarthritic and rheumatoid articular cartilage. Virchows Arch B Cell Pathol Incl Mol Pathol. 1993;63:205–11. doi: 10.1007/BF02899263. [DOI] [PubMed] [Google Scholar]
- 12.Aigner T, Kim HA, Roach HI. Apoptosis in osteoarthritis. Rheum Dis Clin North Am. 2004;30:639–53. doi: 10.1016/j.rdc.2004.04.002. xi. [DOI] [PubMed] [Google Scholar]
- 13.Serra R, Johnson M, Filvaroff EH, LaBorde J, Sheehan DM, Derynck R, et al. Expression of truncated, kinase-defective TGF-β type II receptor in mouse skeletal muscle promotes terminal chondrocyte differentiation and osteoarthritis. J Cell Biol. 1997;139:541–52. doi: 10.1083/jcb.139.2.541. [DOI] [PMC free article] [PubMed] [Google Scholar]
- 14.Yang X, Chen L, Xu X, Li C, Huang C, Deng CX. TGF-β/Smad3 signals repress chondrocyte hypertrophic differentiation and are required for maintaining articular cartilage. J Cell Biol. 2001;153:35–46. doi: 10.1083/jcb.153.1.35. [DOI] [PMC free article] [PubMed] [Google Scholar]
- 15.O'Keefe RJ, Puzas JE, Brand JS, Rosier RN. Effects of transforming growth factor-β on matrix synthesis by chick growth plate chondrocytes. Endocrinology. 1988;122:2953–61. doi: 10.1210/endo-122-6-2953. [DOI] [PubMed] [Google Scholar]
- 16.Ballock RT, Heydemann A, Wakefield LM, Flanders KC, Roberts AB, Sporn MB. TGF-β1 prevents hypertrophy of epiphyseal chondrocytes: regulation of gene expression for cartilage matrix proteins and metalloproteases. Dev Biol. 1993;158:414–29. doi: 10.1006/dbio.1993.1200. [DOI] [PubMed] [Google Scholar]
- 17.Ferguson CM, Schwarz EM, Reynolds PR, Puzas JE, Rosier RN, O'Keefe RJ. Smad2 and 3 mediate TGF-β1-induced inhibition of chondrocyte maturation. Endocrinology. 2000;141:4728–35. doi: 10.1210/endo.141.12.7848. [DOI] [PubMed] [Google Scholar]
- 18.Mankin HJ, Dorfman H, Lippiello L, Zarins A. Biochemical and metabolic abnormalities in articular cartilage from osteo-arthritic human hips. II. Correlation of morphology with biochemical and metabolic data. J Bone Joint Surg Am. 1971;53:523–37. [PubMed] [Google Scholar]
- 19.Metsaranta M, Toman D, de Crombrugghe B, Vuorio E. Mouse type II collagen gene: complete nucleotide sequence, exon structure, and alternative splicing. J Biol Chem. 1991;266:16862–9. [PubMed] [Google Scholar]
- 20.Bruggeman LA, Xie HX, Brown KS, Yamada Y. Developmental regulation for collagen II gene expression in transgenic mice. Teratology. 1991;44:203–8. doi: 10.1002/tera.1420440208. [DOI] [PubMed] [Google Scholar]
- 21.Glasson SS, Askew R, Sheppard B, Carito BA, Blanchet T, Ma HL, et al. Characterization of and osteoarthritis susceptibility in ADAMTS-4–knockout mice. Arthritis Rheum. 2004;50:2547–58. doi: 10.1002/art.20558. [DOI] [PubMed] [Google Scholar]
- 22.Zhang X, Schwarz EM, Young DA, Puzas JE, Rosier RN, O'Keefe RJ. Cyclooxygenase-2 regulates mesenchymal cell differentiation into the osteoblast lineage and is critically involved in bone repair. J Clin Invest. 2002;109:1405–15. doi: 10.1172/JCI15681. [DOI] [PMC free article] [PubMed] [Google Scholar]
- 23.Ranger AM, Gerstenfeld LC, Wang J, Kon T, Bae H, Gravallese EM, et al. The nuclear factor of activated T cells (NFAT) transcription factor NFATp (NFATc2) is a repressor of chondro-genesis. J Exp Med. 2000;191:9–22. doi: 10.1084/jem.191.1.9. [DOI] [PMC free article] [PubMed] [Google Scholar]
- 24.Samuels ML, Weber MJ, Bishop JM, McMahon M. Conditional transformation of cells and rapid activation of mitogen-activated protein kinase cascade by an estradiol-dependent human raf-1 protein kinase. Mol Cell Biol. 1993;13:6241–51. doi: 10.1128/mcb.13.10.6241. [DOI] [PMC free article] [PubMed] [Google Scholar]
- 25.Wittwer CT, Herrmann MG, Moss AA, Rasmussen RP. Continuous fluorescence monitoring of rapid cycle DNA amplification. Biotechniques. 1997;22:134–8. doi: 10.2144/97221bi01. [DOI] [PubMed] [Google Scholar]
- 26.Yamaguchi M, Nakamoto M, Honda H, Nakagawa T, Fujita H, Nakamura T, et al. Retardation of skeletal development and cervical abnormalities in transgenic mice expressing a dominant-negative retinoic acid receptor in chondrogenic cells. Proc Natl Acad Sci U S A. 1998;95:7491–6. doi: 10.1073/pnas.95.13.7491. [DOI] [PMC free article] [PubMed] [Google Scholar]
- 27.Chen M, Lichtler AC, Sheu TJ, Xie C, Zhang X, O'Keefe RJ, et al. Generation of a transgenic mouse model with chondrocyte-specific and tamoxifen-inducible expression of Cre recombinase. Genesis. 2007;45:44–50. doi: 10.1002/dvg.20261. [DOI] [PMC free article] [PubMed] [Google Scholar]
- 28.Buckwalter JA, Brown TD. Joint injury, repair, and remodeling: roles in post-traumatic osteoarthritis. Clin Orthop Relat Res. 2004 June;:7–16. [PubMed] [Google Scholar]
- 29.Karsenty G. An aggrecanase and osteoarthritis. N Engl J Med. 2005;353:522–3. doi: 10.1056/NEJMcibr051399. [DOI] [PubMed] [Google Scholar]
- 30.Van den Berg WB. Lessons from animal models of osteoarthritis. Curr Opin Rheumatol. 2001;13:452–6. doi: 10.1097/00002281-200109000-00019. [DOI] [PubMed] [Google Scholar]
- 31.Helminen HJ, Saamanen AM, Salminen H, Hyttinen MM. Transgenic mouse models for studying the role of cartilage macro-molecules in osteoarthritis. Rheumatology (Oxford) 2002;41:848–56. doi: 10.1093/rheumatology/41.8.848. [DOI] [PubMed] [Google Scholar]
- 32.Pfander D, Heinz N, Rothe P, Carl HD, Swoboda B. Tenascin and aggrecan expression by articular chondrocytes is influenced by interleukin 1β: a possible explanation for the changes in matrix synthesis during osteoarthritis. Ann Rheum Dis. 2004;63:240–4. doi: 10.1136/ard.2002.003749. [DOI] [PMC free article] [PubMed] [Google Scholar]
- 33.Seguin CA, Bernier SM. TNFα suppresses link protein and type II collagen expression in chondrocytes: role of MEK1/2 and NF-κB signaling pathways. J Cell Physiol. 2003;197:356–69. doi: 10.1002/jcp.10371. [DOI] [PubMed] [Google Scholar]
- 34.Kevorkian L, Young DA, Darrah C, Donell ST, Shepstone L, Porter S, et al. Expression profiling of metalloproteinases and their inhibitors in cartilage. Arthritis Rheum. 2004;50:131–41. doi: 10.1002/art.11433. [DOI] [PubMed] [Google Scholar]
- 35.Davidson RK, Waters JG, Kevorkian L, Darrah C, Cooper A, Donell ST, et al. Expression profiling of metalloproteinases and their inhibitors in synovium and cartilage. Arthritis Res Ther. 2006;8:R124. doi: 10.1186/ar2013. [DOI] [PMC free article] [PubMed] [Google Scholar]
- 36.Watanabe H, Kimata K, Line S, Strong D, Gao LY, Kozak CA, et al. Mouse cartilage matrix deficiency (cmd) caused by a 7 bp deletion in the aggrecan gene. Nat Genet. 1994;7:154–7. doi: 10.1038/ng0694-154. [DOI] [PubMed] [Google Scholar]
- 37.Li SW, Prockop DJ, Helminen H, Fassler R, Lapvetelainen T, Kiraly K, et al. Transgenic mice with targeted inactivation of the Col2α1 gene for collagen II develop a skeleton with membranous and periosteal bone but no endochondral bone. Genes Dev. 1995;9:2821–30. doi: 10.1101/gad.9.22.2821. [DOI] [PubMed] [Google Scholar]
- 38.Ameye L, Aria D, Jepsen K, Oldberg A, Xu T, Young MF. Abnormal collagen fibrils in tendons of biglycan/fibromodulin-deficient mice lead to gait impairment, ectopic ossification, and osteoarthritis. FASEB J. 2002;16:673–80. doi: 10.1096/fj.01-0848com. [DOI] [PubMed] [Google Scholar]
- 39.Wadhwa S, Embree MC, Kilts T, Young MF, Ameye LG. Accelerated osteoarthritis in the temporomandibular joint of biglycan/fibromodulin double-deficient mice. Osteoarthritis Cartilage. 2005;13:817–22. doi: 10.1016/j.joca.2005.04.016. [DOI] [PubMed] [Google Scholar]
- 40.Neuhold LA, Killar L, Zhao W, Sung ML, Warner L, Kulik J, et al. Postnatal expression in hyaline cartilage of constitutively active human collagenase-3 (MMP-13) induces osteoarthritis in mice. J Clin Invest. 2001;107:35–44. doi: 10.1172/JCI10564. [DOI] [PMC free article] [PubMed] [Google Scholar]
- 41.Li TF, Darowish M, Zuscik MJ, Chen D, Schwarz EM, Rosier RN, et al. Smad3-deficient chondrocytes have enhanced BMP signaling and accelerated differentiation. J Bone Miner Res. 2006;21:4–16. doi: 10.1359/JBMR.050911. [DOI] [PMC free article] [PubMed] [Google Scholar]
- 42.Zhang Y, Chang C, Gehlin DJ, Hemmati-Brivanlou A, Derynck R. Regulation of Smad degradation and activity by Smurf2, an E3 ubiquitin ligase. Proc Natl Acad Sci U S A. 2001;98:974–9. doi: 10.1073/pnas.98.3.974. [DOI] [PMC free article] [PubMed] [Google Scholar]
- 43.Lin X, Liang M, Feng XH. Smurf2 is a ubiquitin E3 ligase mediating proteasome-dependent degradation of Smad2 in transforming growth factor-β signaling. J Biol Chem. 2000;275:36818–22. doi: 10.1074/jbc.C000580200. [DOI] [PubMed] [Google Scholar]
- 44.Kavsak P, Rasmussen RK, Causing CG, Bonni S, Zhu H, Thomsen GH, et al. Smad7 binds to Smurf2 to form an E3 ubiquitin ligase that targets the TGF-β receptor for degradation. Mol Cell. 2000;6:1365–75. doi: 10.1016/s1097-2765(00)00134-9. [DOI] [PubMed] [Google Scholar]