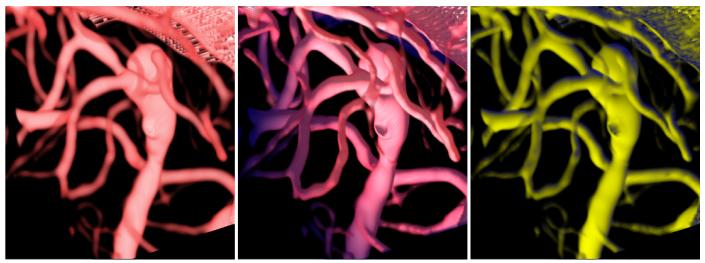
Abstract
The effective visualization of vascular structures is critical for diagnosis, surgical planning as well as treatment evaluation. In recent work, we have developed an algorithm for vessel detection that examines the intensity profile around each voxel in an angiographic image and determines the likelihood that any given voxel belongs to a vessel; we term this the “vesselness coefficient” of the voxel. Our results show that our algorithm works particularly well for visualizing branch points in vessels. Compared to standard Hessian based techniques, which are fine-tuned to identify long cylindrical structures, our technique identifies branches and connections with other vessels.
Using our computed vesselness coefficient, we explore a set of techniques for visualizing vasculature. Visualizing vessels is particularly challenging because not only is their position in space important for clinicians but it is also important to be able to resolve their spatial relationship. We applied visualization techniques that provide shape cues as well as depth cues to allow the viewer to differentiate between vessels that are closer from those that are farther. We use our computed vesselness coefficient to effectively visualize vasculature in both clinical neurovascular x-ray computed tomography based angiography images, as well as images from three different animal studies. We conducted a formal user evaluation of our visualization techniques with the help of radiologists, surgeons, and other expert users. Results indicate that experts preferred distance color blending and tone shading for conveying depth over standard visualization techniques.
Keywords: Vessel identification, Vessel visualization, Evaluation of visualization techniques
1 Introduction
Visualizing vessels is important in many clinical situations, such as detection of anomalous growths and stenosis. Volume rendering of the image data can provide spatial relationships but require tedious manipulation of the transfer function. To effectively visualize the vessels, removing the bones and other irrelevant detail is essential. The lower threshold of the transfer function specifies the intensity below which the voxel intensities are classified as transparent. For visualizing vessels, this approach is of limited use as thin vessels with low intensity will get eliminated, which causes the formation of islands of vessels in the final visualization.
Researchers have discussed techniques to specifically identify vessels from surrounding anatomy. Frangi et al. [5] introduced techniques to perform multiscale analysis to identify a “vesselness” coefficient that identifies vessels. The technique and subsequent improvements [9] have focused on identifying long tubular, cylindrical structures in a dataset. Their algorithm performs poorly at branch points in vessels and is therefore limited in its use. Previously, we have developed a technique that identifies vessels by analyzing the neighborhood of the voxel under consideration [12]. We use our computed “vesselness” coefficient in combination with visualization techniques, to generate vascular visualizations that convey shape, depth and connectivity information to the viewer.
We conducted a evaluation of our techniques in the form of a user study where we asked surgeons, radiologists and technicians to identify which visualizations were preferred by them, since they are the daily users of the techniques. Users consistently preferred distance color blending and tone shading over the volume rendering techniques.
The rest of this paper reads as follows. We discuss related work in Section 2. Next we present our new methodology in Section 3. This is divided into two parts, namely (i) the description of a our vessel enhancement strategy that does not rely on the single cylinder assumption (Section 3.1) and (ii) the development of new visualization techniques that take advantage of this enhancement strategy (Section 3.2). We present applications from our work in Section 4, including a formal user evaluation. Finally we presents some concluding remarks in Section 5.
2 Related work
Vascular visualization has seen enormous interest in the last few years. Some of the early work [17], which is actually still widely used by cardiologists and neurosurgeons, was conducted using Maximum intensity projection (MIP) of thresholded images of the anatomy. Pommert et al. [10] applied volume visualization techniques for vascular structures to allow 3D visualizations of vessels. Higuera et al. [7] have proposed the use of multi-dimensional transfer functions to better identify boundaries of the vessels based on a predefined template. Techniques such as curved planar reformation (CPR) have been used to visualize vessels for CT angiography [8]. Bühler et al. [2] present an excellent survey of the challenges as well as the advances in vessel visualization for clinical purposes.
Recently, isosurface based techniques have been applied to identify and generate smooth vascular images from three-dimensional medical data. Schumann et al. [15] used segmentation information to generate improved isosurfaces using an implicit surface generation technique.
Illustration-based techniques too have been explored for their ability to convey spatial information succinctly. Ritter et al. [14] discussed distanced-based hatching style visualization for providing contextual cues to more effectively visualize vascular structures. They conducted a study evaluating their techniques and found that subjects were able to perceive depth better using their techniques but there was no significant benefit for shape perception as compared to Gouraud shading.
Preim and Oeltze [11], in their comprehensive overview of the state-of-the-art of 3D visualization of vasculature, mention the need to investigate volume rendering based techniques for visualizing vessels. Our paper addresses some of those challenges by using the computed vesselness coefficient to improve the visualization of thin vessels.
Hessian Based Enhancement
Most of the proposed vessel segmentation algorithms consist of two steps. First, a filtering operation is used to enhance (or detect) tubular structures on a voxelwise basis, based on the local intensity characteristics. Then, global segmentation methods, varying from level sets [3], region growing [16], to Kalman or particle filters, are applied to finally segment vascular structures via the global connectivity constraints.
Most voxel enhancement methods (e.g. see [5]) impose a strong single cylinder assumption at each voxel of the image. They often proceed by computing the Hessian tensor at each voxel and examine this tensor for the presence of a cylindrical structure. While this type of method, in theory, is only valid at the centerline of a cylinder, the use of multiscale techniques enhances the output away from the centerline as well. The key limitations of this type of method are (i) the strong single cylinder assumption which fails at vessel branch points and (ii) the assumption that vessels are mostly circular in cross-section which causes problems in stenotic vessels and aneurysms.
3 Approach
3.1 The Polar Profile-Based Vesselness Coefficient
In this paper instead of using the tensor model we invoke a newly developed method that replaces the single cylinder assumption [12]. This approach uses a non-parametric formulation to enhance regions where vascular structures are present and seamlessly enhances both cases of single vessels as well as branch points. It also has significantly better response away from vessel centerline.
3.1.1 Polar Neighborhood Intensity Profile
The polar neighborhood intensity profile underlies the new vessel enhancement method. In this method, we explicitly exploit the characteristics of sampled intensities in an appropriate neighborhood. We show visually that the necessary information deciding whether the points belong to vascular structures can be captured from the variation of neighborhood intensities.
The Polar profile of a voxel is defined as the collection of the outputs from a set of filters whose basis span a sphere around the voxel, as shown in Figure 1. The output of these filters is the average (weighted) square of the intensity deviation of the intensity within the sector. To calculate the average squared intensity deviation along different relative directions θ = {ψ,ϕ} (ψ and ϕ are the azimuth and elevation angles; ψ ∈ [0,2π) and ϕ ∈ [0,π]) with respect to location of any voxel in the image x = {x,y,z}:
| (1) |
where I is the image intensity and h(u) is a function of relative position of neighborhood points from x defined in a local neighborhood N(x). Different h(u) gives different partition functions or weighting schemes to collect statistics in the neighborhood. We propose to use spherically separable filters h(u) = hr(u) · hθ (u) = hr(r) · hθ (ψ,ϕ), where r is the radial coordinate and ψ = arctan(y/x), . Both the radial and angular parts of the filter can be either a Gaussian function or a simple rectangle function as shown in Fig. 1. The neighborhood region N(x) is uniformly partitioned into nψ × nϕ regions along different directions covering the whole sphere as shown in Fig. 1(a).
Fig. 1.
Partition 3D neighborhood regions into oriented regions: (a) Partitions; (b) Radial part of the filter (k is the radius/size of the filter); (c) Angular part of the filter
The intuition behind this non-parametric method is that vascular structures exist only if:
The polar intensity profile contains tight clusters with small intensity variation: In the neighborhood of vessel points, there must exist at least one narrow orientation cluster along which the variation of the intensities is low.
Locally bright structures: Since we are looking for bright vessels, it is important to exclude locally dark structures so that we can distinguish true vessel points from the points between two nearby vessels.
We present our new measure in two separate parts in the rest of the section.
3.1.2 Tight Orientation Clusters with Small Intensity Variation
We express the probability, pv(x,θ), of having small intensity variation within the discretized orientation region Sθ as:
| (2) |
where c is the normalization factor and β can be set to a constant. Since the entropy [4] for a given density function measures the spread (or tightness) of the function, we can use the entropy to derive the tightness measure. The entropy gets smaller when the spread of the distribution decreases. We define our tightness measure as:
| (3) |
3.1.3 Locally Bright Structures
To account for intensity inhomogeneities in images, we label vessel candidate voxels as being locally brighter than the background.
Hence, we define a brightness function for each pixel x:
| (4) |
where s(d) = 1/(1 + e-αd) is a sigmoid function; μ(ISθmin (x)) is the mean intensity within the orientation region with the minimum deviation; and μ(ISθmax (x)) is the mean within the region with the maximum intensity deviation. These values come at no additional computational cost since we have them from the calculation of Dev(x,θ).
3.1.4 The Polar Profile Vesselness Measure
Finally, our polar profile vesselness measure (entropy-based measure) is the product of the local brightness constraint (equation (4)) and the local orientation constraint (equation (3)):
| (5) |
The polar profile vesselness algorithm was implemented in MATLAB and requires approximately 4 hours for each MRA image (image size = 101 × 256 × 101), on a 2.0 GHz Intel Xeon CPU under Windows XP.
3.2 Visualizing vesselness
The vesselness computed from Hessian (as introduced by Frangi et al. [5]) as well as our polar profile-based technique can be qualitatively compared using a visual representation of the images generated from using the vesselness. We use a modified volume rendering pipeline, as shown in Figure 2, where the intensity-based classification is augmented by the computed vesselness and the shading is enhanced by adding depth and shape enhancing cues. As the ray traverses through the volume, if the intensity of the voxel under consideration is low but its computed vesselness is high, the opacity of the voxel during classification stage is boosted. Visualization techniques to accentuate shape and provide depth cues are added in the shading stage. The color and opacity from the two stages is combined in the composition phase to generate the final image. This enables the visualization of thin vessels that have low intensity value but a high vesselness value.
Fig. 2.
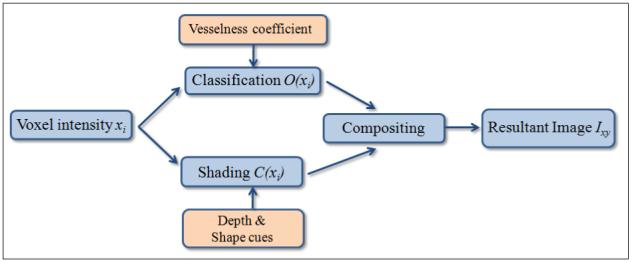
The vessel enhancing volume rendering pipeline. The volume rendering pipeline was modified to incorporate for the needs of vessel visualization. The identified vessels are incorporated into the classification stage to boost the opacity of voxels with low intensity (thin vessels) but high vesselness. Depth and shape cues are provided in the shading phase.
In Figure 3 we compare an image generated using the standard volume rendering pipeline and an image generated using our modified vesselness-based pipeline. Transfer function-based visualization results in islands being formed due the lower intensity-based threshold which ends up removing thin regions in vessels or thin vessels completely. The left image, especially in the region marked by the green rectangle, shows islands of vessels. The right image shows a visualization generated using the modified volume rendering pipeline. Vessels in the top right region of the image are connected due to the fact that low opacity voxels with high vesselness have been considered in the volume rendering process.
Fig. 3.
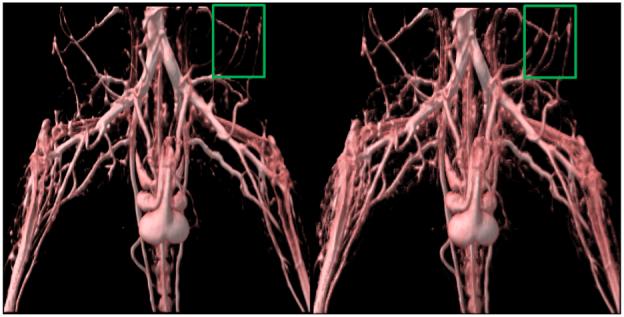
A comparison of standard transfer function-based volume rendering with the modified vesselness-based volume rendering. Islands caused due to transfer function-based lower threshold cutoffs are visible, particularly in the region marked by the green rectangle. Comparing that with the right image, one can see that almost all vessels are completely connected. The modified vesselness pipeline leads to the visualization of vessels with far fewer islands as can be seen in the right image.
Hessian vs Polar Profile Vesselness
Visualizing the raw data using the Hessian vesselness as compared to the polar profile vesselness allows a visual comparison of the techniques. Figure 4 shows a volume rendering with Hessian vesselness enhancing the visualization on the left and polar profile-based vesselness enhancing the visualization on the right. The regions marked by the yellow circles shows regions where the images differ significantly. Our polar profile based measure clearly works very well at branch points as compared to the Hessian measure. The Hessian measure works well on long tubular vessels but fares poorly at branch points.
Fig. 4.
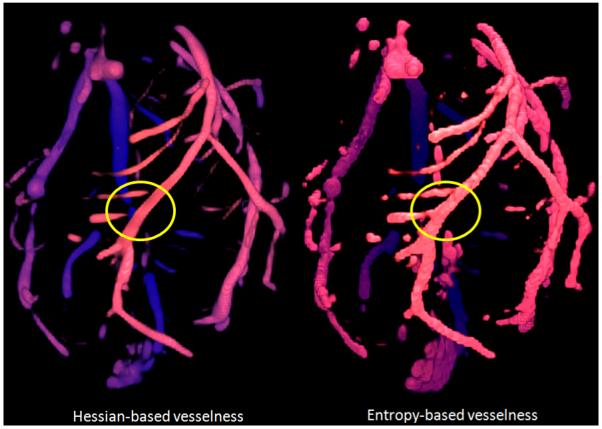
Visualization using polar profile compared to visualization using Hessian techniques. The regions marked with a yellow circle clearly show that our technique performs better at branch points.
Figure 5 shows a visualization of the raw data from a lamb MRA colored by Hessian-based vesselness coefficient on the left and by our polar profile-based vesselness coefficient on the right. Here, the raw data is rendered in greyscale and the voxels identified by a vesselness algorithm are colored in red. The left image shows that the Hessian-based technique identified long structures such as the vessel in the background which has no branches, but for the vessel in the foreground with branches, it cannot identify branch points. The right image, visualizing polar profile-based vesselness, shows that the branches and the vessels are effectively identified using the polar profile-based vesselness coefficient.
Fig. 5.
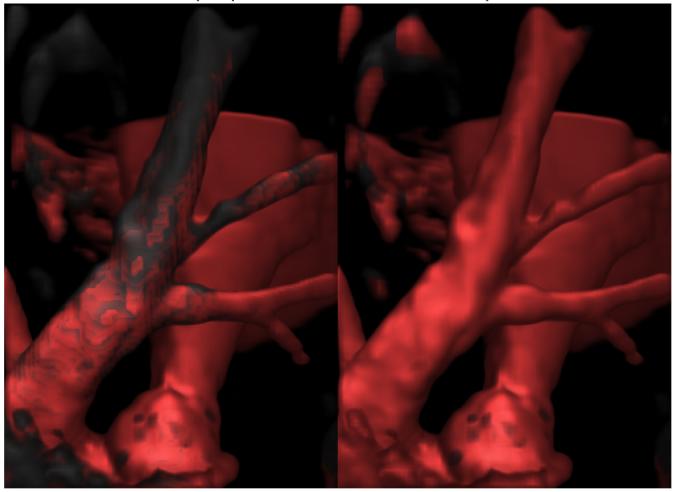
Visualizations of vesselness for lamb MR angiography. The left image shows the raw data (in greyscale) colored with the Hessian coefficient (in red) being used with our modified volume rendering pipeline. Even though the Hessian technique can identify vessels, it cannot identify branch points as can be seen by the grey regions in the front vessel. The right image shows our polar profile-based vesselness which identifies the vessels as well as the branch points.
3.3 Improved Vessel Visualization using the Vesselness Coefficient
We use the computed vesselness to generate an improved visualization of the underlying data using the modified volume rendering pipeline. Understanding the shape and spatial relationships of vessels in a static image can be challenging. We apply some visualization techniques and evaluate their effectiveness in conveying shape and depth to the viewer.
3.3.1 Distance Color Blending
Distance color blending is a technique inspired by artists to convey depth cues in a static image. Cool colors (such as shades of blue, violet) are used to convey depth in an image. The following equation is used to implement it in the raycasting process,
| (6) |
where cd is the resultant color after distance color blending, kds and kde are coefficients that determine the extent of the color blending, dv is the ratio of the distance traveled by the ray to the total distance that the ray will eventually travel and cb is the blue color component which is generally set to (0,0,0.15) but can be varied to get different effects.
Figure 6 shows a volume rendered image of a microCT of a mouse lower abdomen without and with distance color blending. The bottom image provides depth cues in the form of a dark blue shade being applied to vessels that are farther away from the viewer.
Fig. 6.
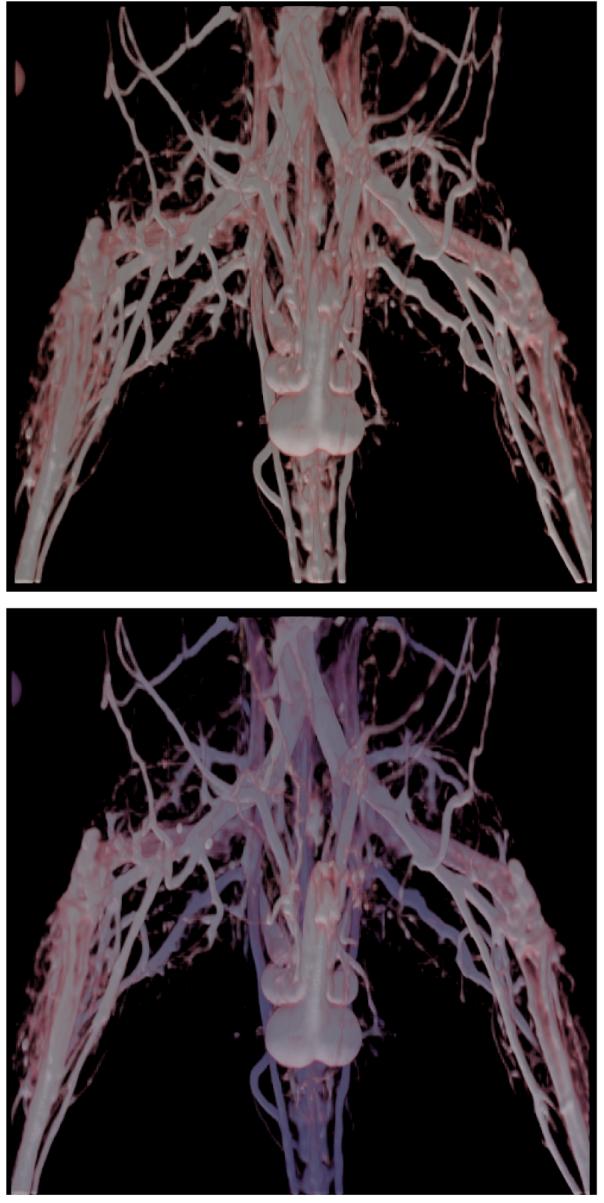
The top image shows a volume rendered image with lighting. The bottom image shows the same image with distance color blending added on to provide depth cues. The vessels that are farther from the viewer are shaded with a darker shade of blue mixed with their original color.
Figure 7 shows a visualization of the lamb MRA data. The left image shows a greyscale volume rendering, while the right image shows a visualization with distance color blending. The depth cues provide a sense of depth for the vessel behind the vessel in the foreground.
Fig. 7.
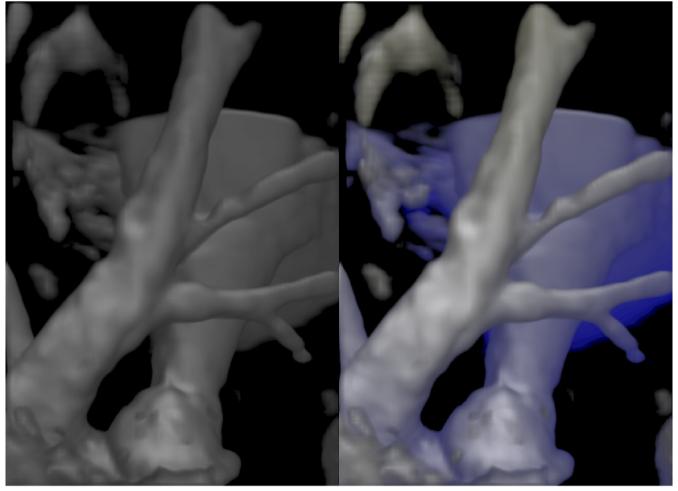
The left image shows a vesselness enhanced volume rendered visualization of the pulmonary artery of a lamb obtained from a MR angiography study. The right image shows a visualization with distance color blending conveying depth to the viewer. The parameters used for distance color blending are kds = 1.0,kde = 0.5,cb = (0,0,0.15).
Standard volume rendering provides limited information regarding the location of the vessels in the data set. The left image in Figure 8 shows a volume rendering of MR angiography of an ex-vivo rat heart. It is important to note that many thin vessels are not clearly visible. Using the computed polar profile-based vesselness coefficient, we can improve the visualization of our data. The right image in Figure 8 shows the vesselness parameter being used to enhance the opacity of thin, stringy vessels. Distance color blending allows the viewer to differentiate between vessels closer to the viewer from those that are farther. The region marked by a blue rectangle, shows a vessel that is barely visible in the left image. The coloring of the vessel implies that the vessel is closer to the viewer but because of its low intensity and small thickness, it was not as clearly seen in the left image.
Fig. 8.
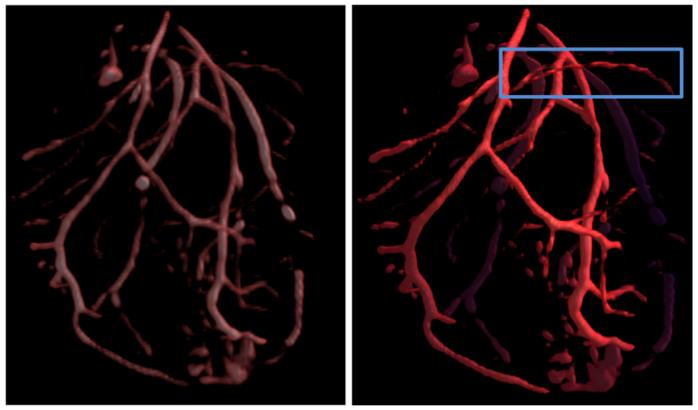
Visualization with volume rendering and distance color blending with enhanced vesselness. The right enhanced vesselness visualization shows thin vessels more clearly, particularly in the region marked by the blue rectangle. Distance color blending helps us understand that the vessel is closer to the viewer than farther away.
3.3.2 Tone Shading
Tone shading has been widely used to convey shape and orientation cues in a static visualization. Tone shading, as introduced by Gooch et al. [6], uses a warm-to-cool color scheme to visualize the data. The lighting equation is given by
| (7) |
where Kcool = (0,0,Tc) and Kwarm = (Tw,Tw,0) and Tc stands for the cool component, Tw stands for the warm component, L stands for the light vector, N stands for the normal, which in our case is the normalized gradient of the voxel, and Color is the final color resulting from the shading.
Figure 9 shows an example of tone shading applied to mouse microCT data. The top image shows a volume rendered image of the mouse microCT data. The bottom image shows a tone shading representation which provides considerable shape and depth cues. The shape and orientation of the vessels is conveyed due to tone shading. In particular, near the center of the image, in the region marked by red rectangles, the structural shape and depth of local features can be seen due to the dark blue mixed in.
Fig. 9.
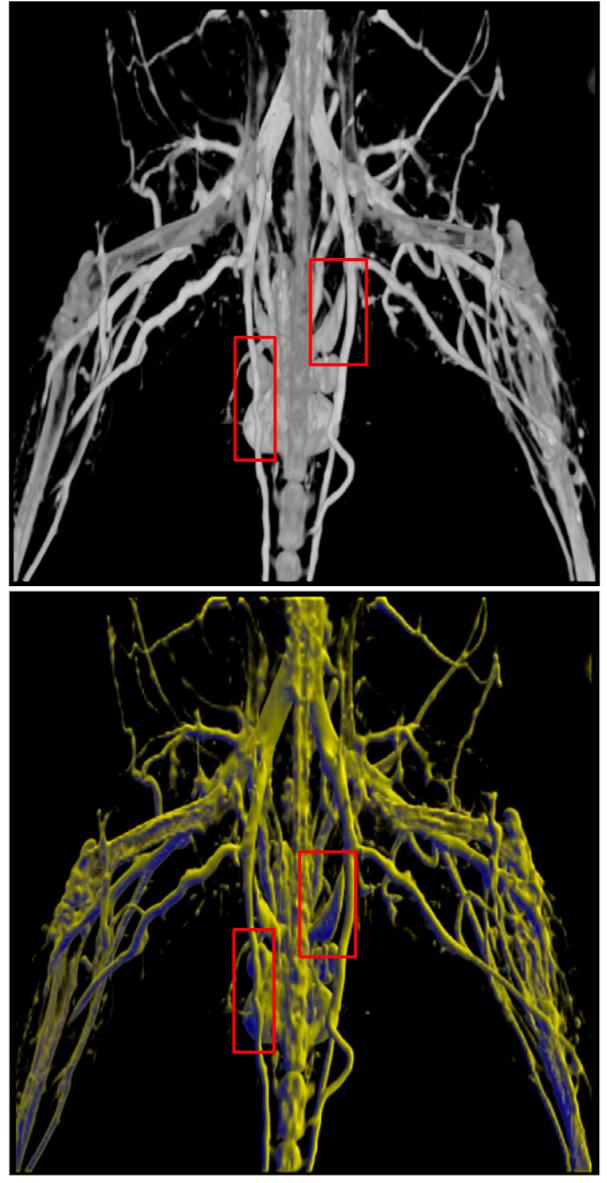
The top image shows a volume rendered image where distance and shape cues are not clearly seen. The bottom image shows a visualization with tone shading. Particularly, in the regions marked by the red rectangles, shape and orientation is being conveyed due to tone shading.
3.3.3 Halos
Halos have been well studied to delineate features from their neighboring structures. Rheingans and Ebert [13] used halos effectively to accentuate features surrounding the structures in the abdomen. Recently, Bruckner et al. [1] applied depth enhancing halos using graphics hardware and discussed their benefits for conveying depth.
Halos can be obtained by identifying a halo effect of a feature on its surrounding voxels. It can be identified by
| (8) |
where hn is maximum possible influence of a neighbor on that voxel. Pi and Pn are the positions of voxel i and its neighbor n, ∇f is the gradient of that voxel and ∇fn stands for the normalized gradient. The haloing influence, hn, is inversely proportional to the distance of the neighboring voxel from the current voxel and is given by
| (9) |
where V stands for the view vector, khpe controls the effect of the neighboring voxel’s gradient and khse controls the extent of the halos being orthogonal to the view vector.
Figure 10 shows a visualization of an aneurysm with halos. The halos provide perceptual cues to allow viewers to resolve depth relationships between vessels. The right image provides crucial shape information, but the left image provides information regarding the shape of vessels. Particularly, the left vessel’s loop-shaped structure is better conveyed in the right image using halos than the left image where it is hard to tell whether it is looping or is being hidden by another vessel in front of it.
Fig. 10.
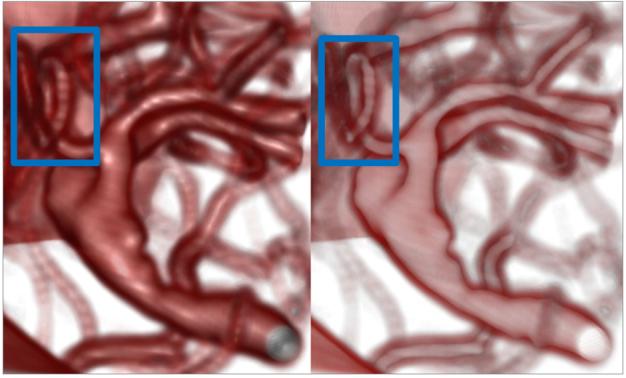
Volume rendering of an aneurysm with lighting and with halos. In particular, the shape of the left vessel coming out of the top of the aneurysm is clearly seen in the right image, as compared to the left image. The parameters for halos were khpe = 2.0,khse = 5.0
4 Experimental Results
The polar profile-based techniques have been applied to various application domains such as lamb MRA angiography, microCT mouse data and clinical neurovascular images. The strength of the polar profile-based techniques are in the wide applicability over multiple modalities of data.
4.1 Visualizing Lamb MR Angiography
We used lamb MRA data obtained as part of a study in the growth of tissue engineering vascular grafts. In this project we need to both quantify the vascular growth, as well as visualize the data to inspect and explore it further for the growth of new vessels and for the change in properties of older vessels over time. The polar profile-based vesselness is computed using the following parameters: k = 55, β = 800, nψ = 16, and nϕ = 8. Figure 5 shows a comparison of the polar profile-based technique for visualizing the pulmonary artery. Figure 7 shows the benefits of using distance color blending.
4.2 Visualizing MicroCT Mouse Vessels
The microCT images were acquired as part of a study on angiogenesis, the formation of new blood vessels in the context of a mouse of model of peripheral vascular disease. We extracted vessels in microCT mouse lower body image data (roughly from below the lungs) using the polar profile-based method. The polar profile-based vesselness is computed using the following parameters: k = 23, β = 600, nθ = 12, and nϕ = 6 along the azimuth and elevation directions. Figure 11 shows the volume rendering of the data with the Hessian vesselness, the polar profile-based technique and a combination of the two. The yellow arrows in the zoomed in representations highlight the difference between the Hessian and the polar profile-based technique, where the branch points are much better identified using the polar profile-based method. But as can be seen in the left zoomed-in image of the polar profile image (middle image in Figure 11), the vessel is not continuous near the top, as indicated by the arrow.
Fig. 11.
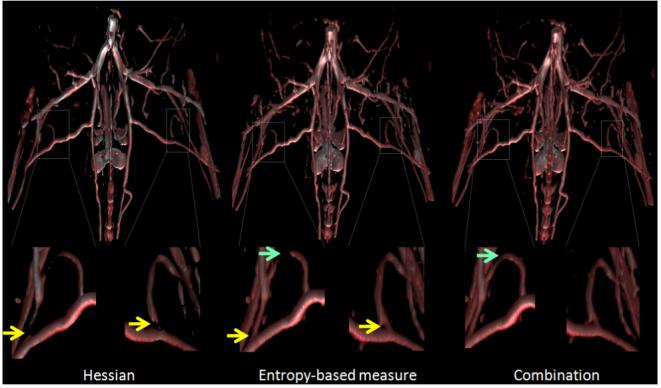
Vascular visualization of lower mouse pelvic data using Hessian, polar neighborhood profile and a combination technique. The yellow arrows indicate regions where the polar profile-based technique identifies vessel branch points better than Hessian technique. The green arrows indicate where the combination technique works better than both Hessian or polar profile used independently.
It was found that in some cases, using a combination of the two techniques was more effective than using only one vesselness coefficient. If the voxel under consideration was identified as a vessel by either of the two techniques, then its opacity was increased to ensure visibility. Such a combination-based technique was used to generate the rightmost image in Figure 11. The combination technique performs considerably well as can be seen by regions marked by the green arrows in the figure. The arch of that vessel is accurately captured using the combination-based technique.
4.3 Visualizing Brain Vessels
Intracranial vessels are usually visualized using a maximum intensity projection rendering of the raw data. A preprocessing step of thresholding out the surrounding bone is followed by a MIP rendering. The disadvantage of a MIP rendering is that though it provides a clear representation of the data, it does not provide shape and depth cues. A clear understanding of the shape and spatial relationships of the vessels is understood only after interaction or animation. We apply the techniques to visualize intracranial vessels of patients to convey shape and depth cues in a static image. The polar profile-based vesselness is computed for the intracranial vessels using the following parameters: k = 41, β = 800, nθ = 16, and nϕ = 8
To investigate the strength of halos as compared to regular lighting and shading, we generated visualizations such those shown in Figure 10. The left image provides more spatial information regarding which vessel is in front of which vessel and helps physicians understand the structure of the surrounding vessels.
Figure 12 shows an example of visualization techniques being applied to intracranial vessels around an aneurysm. The left image shows standard volume rendering, while the middle image provides depth cues and allows for disambiguating which vessel is in front of its surround vessels. The right image provides improved shape and orientation cues as compared to the standard volume rendering image.
Fig. 12.
Visualizations of vessels around a brain aneurysm. The left image shows a standard volume rendering of the vessels. The clutter of vessels makes its hard to resolve which vessels are in front of which vessels. The middle image shows a vesselness enhanced visualization with distance color blending where the vessels that are farther away are colored in a shade of blue. The rightmost image is obtained by using tone shading. The shape and orientation of the vessels comes through, but depth information is not as clearly conveyed.
4.4 Evaluation
In order to evaluate our techniques, we conducted a formal user evaluation where we asked neurosurgeons, cardiologists, radiologists and technicians to identify which visualizations were preferred for effectively visualizing vessels, since they need to visualize vessels for various reasons in their fields of expertise. We asked the experts to pick a visualization technique based on its capability to convey depth to the viewer. The web-based user study consisted of 12 experts (9 males and 3 females aged 22 to 49). We performed a full-factorial preference analysis by asking the experts to compare volume rendered images, volume rendering with lighting, with distance color blending, with tone shading and with halos. A pairwise comparison allowed us to identify which of the techniques were consistently preferred over which one regardless of the modality (CTA - CT Angiography, MRA - MR angiography) of the data.
Our testable hypothesis was that novel ways of visualizing vascular data are more effective at conveying depth than standard volume rendering techniques. The independent variable for the user study is the visualization technique being used to visualize the vascular data. For the user study, we used real world data obtained from mouse hindlimb microCT, MRA of a sheep heart, CTA of human brains. We performed a pilot study to resolve ambiguous questions or typos in our study. The pilot study was conducted with two subjects who answers were not considered in the final evaluation. During the course of conducting the user study, we first explained the study procedure to the subject. On obtaining consent from the subject for the study, we conducted the user study. The task was to choose one of the two images shown in the user study that better conveys depth.
Table 1 shows the result of a pairwise comparison of the user preference. Distance color blending (DCB) is preferred most of the time (74%) more than all the other visualization techniques. Tone shading was preferred as compared to the other techniques except when compared to distance color blending. Halos was not as preferred when compared to other kinds of visualizations. Figure 13 shows the a graph representation of the user evaluation results. As can be seen in the graph, distance color blending and tone shading were more preferred over the other techniques.
Table 1.
The table shows the average pairwise preference of the users between the visualization techniques. VR - Volume Rendering, LIT - with lighting, DCB - With Distance Color blending, TS - With tone shading and Halos - With halos
| VR | Lit | DCB | TS | Halos | |
|---|---|---|---|---|---|
| VR | 0 | 0 | 0 | 24.58 | 83.17 |
| Lit | 100.0 | 0 | 16.44 | 33.63 | 100.0 |
| DCB | 100.0 | 83.56 | 0 | 74.17 | 100.0 |
| TS | 74.42 | 66.37 | 25.83 | 0 | 60.72 |
| Halos | 16.83 | 0 | 0 | 39.28 | 0 |
Fig. 13.
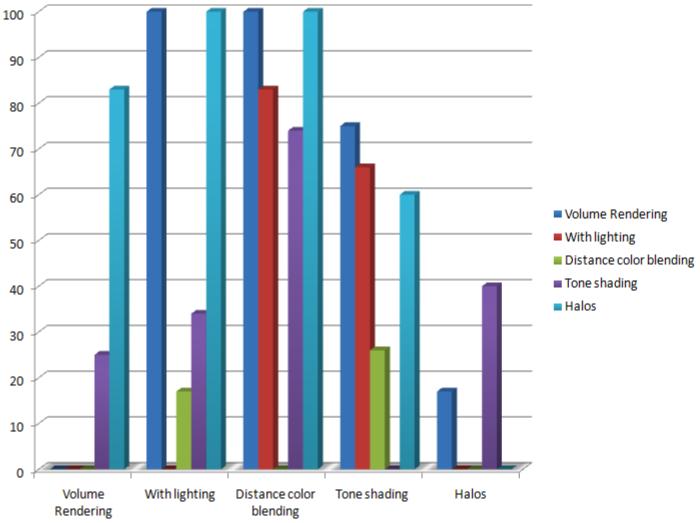
This graph shows the results of the user study. On the X-axis are all the techniques from the user study and on the Y-axis are the user preferences. For example, Volume rendering was preferred over tone shading 24.58% of the time, while subjects preferred plain volume rendering over halos 83.17% of the time. Notably, Distance color blending was preferred over all other techniques (as can be seen by the high preference numbers). Tone shading too was preferred over other techniques. Halos was least preferred over other techniques except in some cases over tone shading.
5 Conclusion
We have compared and discussed the application of visualization techniques for visualizing vessels. These vessels can be identified using the polar profile-based vesselness algorithm and perform much better at branch points than standard Hessian algorithms. A qualitative comparison of the vesselness demonstrates the improvement at branch points.
We discussed techniques to visualize the raw data by incorporating the computed vesselness into the volume rendering pipeline. The primary problem of conveying depth in vessel visualization is addressed by applying distance color blending, tone shading and halos. The techniques produced visualizations that conveyed depth effectively to the viewer. We conducted a user study to evaluate the ability of our techniques to convey depth and found that experts preferred the distance color blending with vesselness technique more than any of the other techniques. Among the other techniques, they preferred tone shading more than the other techniques, but did not seem to prefer halos at all as compared to other techniques.
Acknowledgements
This work was supported in part by the NIH under grants R01HL065662 (AJS) and R01EB006494 (XP).
References
- [1].Bruckner S, Gröller ME. Enhancing depth-perception with flexible volumetric halos. IEEE Transactions on Visualization and Computer Graphics. 2007 Oct;13(6):1344–1351. doi: 10.1109/TVCG.2007.70555. [DOI] [PubMed] [Google Scholar]
- [2].Bühler K, Felkel P, Cruz AL. Geometric methods for vessel visualization and quantification- a survey. In: Brunnett HMG, Hamann B, editors. Geometric Modelling for Scientific Visualization. 2003. Springer [Google Scholar]
- [3].Chen CW, Huang TS. Epicardial motion and deformation estimation from coronary artery bifurcation points; Proc. Int. Conf. on Computer Vision; 1990.Dec., pp. 456–459. [Google Scholar]
- [4].Cover TM, Thomas JA. Elements of Information Theory. Wiley; 1991. [Google Scholar]
- [5].Frangi AF, Niessen WJ, Vincken KL, Viergever MA. Multiscale vessel enhancement filtering. Proc. of MICCAI, Lecture Notes in Computer Science. 1998;1496:130–137. [Google Scholar]
- [6].Gooch A, Gooch B, Shirley P, Cohen E, ACM A non-photorealistic lighting model for automatic technical illustration; SIGGRAPH ’98: Proceedings of the 25th annual conference on Computer graphics and interactive techniques; New York, NY, USA. 1998.pp. 447–452. [Google Scholar]
- [7].Higuera FV, Sauber N, Tomandl B, Nimsky C, Greiner G, Hastreiter P. Enhanced 3d-visualization of intracranial aneurysms involving the skull base. MICCAI (2) 2003:256–263. [Google Scholar]
- [8].Kanitsar A, Wegenkittl R, Fleischmann D, Groeller M. Advanced curved planar reformation: Flattening of vascular structures; Proceedings of the IEEE Visualization Conference 2003; 2003.pp. 43–50. [Google Scholar]
- [9].Krissian K, Malandain G, Ayache N, Vaillant R, Trousset Y. Model-based detection of tubular structures in 3d images. Comput. Vis. Image Underst. 2000;80(2):130–171. [Google Scholar]
- [10].Pommert A, Bomans M, Höhne KH. Volume visualizaiton in magnetic resonance angiography. IEEE Computer Graphics and Applications. 1992;12(5) [Google Scholar]
- [11].Preim B, Oeltze S. 3d visualization of vasculature: An overview. In: Linsen L, et al., editors. Visualization in Medicine and Life Science. 2007. Springer pp. 19–39. [Google Scholar]
- [12].Qian X, Brennan M, Dione D, Dobrucki L, Jackowski M, Breuer C, Sinusas A, Papademetris X. A non-parametric vessel detection method for complex vascular structures. Medical Image Analysis. 2008 doi: 10.1016/j.media.2008.05.005. Accepted for publication. [DOI] [PMC free article] [PubMed] [Google Scholar]
- [13].Rheingans P, Ebert D. Volume illustration: Non-photorealistic rendering of volume models. IEEE Transactions on Visualization and Computer Graphics. 2001;7(3):253–264. [Google Scholar]
- [14].Ritter F, Hansen C, Dicken V, Konrad O, Preim B, Peitgen H-O. Real-time illustration of vascular structures. IEEE Transactions on Visualization and Computer Graphics. 2006;12(5):877–884. doi: 10.1109/TVCG.2006.172. [DOI] [PubMed] [Google Scholar]
- [15].Schumann C, Oeltze S, Bade R, Preim B, Peitgen H-O. Model-free surface visualization of vascular trees. Proceedings of EuroVis 2007. 2007:283–290. [Google Scholar]
- [16].Shim H, et al. Partition-based extraction of cerebral arteries from ct angiography with emphasis on adaptive tracking. IPMI. 2005 doi: 10.1007/11505730_30. [DOI] [PubMed] [Google Scholar]
- [17].Siebert J, Rosenbaum T, Pernicone J. Automated segmentation and presentation algorithms for 3d mr angiography. Book of Abstracts, SMRM. 1991 [Google Scholar]


