

Abstract
Objectives
Defects in memory CD4+ T cells correlate with development of AIDS in SIV-infected monkeys, but the early events leading to these deficits are unknown. We explored the role of SIV-specific and CD8 cells in the determination of CD4 failure and rapid disease course.
Design and Methods
Using MamuA*01-restricted Gag and Tat epitope tetramers, we compared the kinetics of specific response in animals with regular (REG) and rapid (RAP) progression. Expression of memory, activation and proliferation markers were examined on the global CD8 pool, as well as on CD4 T cells in those animals. In vivo CD8 depletion in non-MamuA*01 animals was used to investigate CD8 collapse as a leading event on disease progression and CD4 deficits.
Results
In animals with a rapid disease course, an initial development of SIV-specific CTL is followed by collapse accompanied by global changes in CD8 cells, and occurs in synchrony with the characteristic CD4 deficiencies. Antibody-mediated depletion of CD8 cells early after SIV infection induces similar changes in the CD4 cells and rapid development of AIDS.
Conclusions
CD8 collapse at acute time points may result in uncontrolled viral load and development of a defective and insufficient CD4 population. Our results indicate that early breakdown in CD8 cells leads to CD4 deficits and rapid progression to AIDS, and suggest that therapeutic approaches should aim at strengthening CD8 T cells early after viral infection.
Keywords: AIDS, SIV, acute infection, CD4, CD8, brain
Introduction
SIV infection in rhesus macaques mimics HIV infection in humans and is considered the best experimental system to study AIDS. SIV-infected monkeys exhibit disease course patterns that are similar to humans. Most SIV-infected monkeys develop a prolonged asymptomatic period followed by immunodeficiency, as in humans. Yet another subset of infected monkeys and humans control the virus for a protracted time period. A relatively low percentage of HIV-infected humans develop rapid disease course, but the rate of rapid progression can be higher in some populations [1]. In SIV-infected monkeys, rapid progression is more common: approximately twenty five percent have a rapid progression characterized by development of AIDS within 200 days after virus inoculation. These animals are notable for having a high level of viremia, poor anti-viral antibody response and high rate of encephalitis [2-4].
In SIV-infected monkeys rapidly progressing to disease, the development of fatal immunodeficiency has been linked to an insufficient production of tissue-homing memory CD4+ T cells [5, 6]. Importantly, a subsequent study performed in chronically SIV-infected monkeys with a normal disease progression revealed that such deficits in memory CD4+ T cells were a common pathway leading to AIDS [6].
The role of the CD8 T cell response in CD4 deficits has not been examined. A crucial role for CD8 cells in controlling initial viremia and disease course has been well documented in SIV-infected monkeys. Administration of a CD8 depleting antibody leads high levels of plasma virus, rapid disease course, and encephalitis [7-9]. However, there are only a few reports in SIV and HIV on the role of CD8 cells, specifically cytotoxic T lymphocytes (CTL), on spontaneous rapid progression. In monkeys, assessment of rapid progressors revealed poor CTL response to SIV [10-12]. Similarly, a study in HIV-infected rapid progressing individuals showed a failure to develop initial CTL response [13]. Two other studies identified initial development of CTLs in rapidly progressive HIV infection, which become functionally defective, independently of escape [14, 15].
CTL reactivity to SIV has been best studied in monkeys bearing the MamuA*01 class I MHC allele, which restricts immunodominant epitopes in the Gag (Gag181-189; CM9) [17] and Tat (Tat28-35; SL8) [18] proteins of SIV, allowing the study of epitope-specific CD8+ T-cell frequencies by staining with MHC-tetramer-peptide complexes [19]. In early infection, reactivity to these two epitopes comprises approximately 50% of the anti-SIV CTL response. Tat-specific cells are typically abundant at early phases of infection but soon disappear, whereas Gag-specific cells are in general maintained for long periods [20].
Here, we first analyze the peripheral kinetics and the frequency of these immunodominant CTLs in organs at necropsy, in rapid progressors, compared to regular progressors which we have recently reported [21]. We observed that rapid progressors suffer a collapse of the anti-Gag and Tat CD8 response, which is accompanied by a decrease of memory and activated CD8+ T cells. Although CD8+ T cells still accumulate in the CNS, these two anti-viral CD8 populations are greatly decreased relative to what is found in regular progressors, and negatively correlate with viral load. Loss of CD4 memory cells, as well as total CD4 T cell activation, was found in these animals. In order to assess the relationship of the CD8 deficits to those in the CD4 compartment, we then examined experimental collapse of CD8 response in SIV-infected monkeys, modeled by a CD8 cell-depleting antibody. This also led to loss of memory and activated CD4 cells. We propose an alternative model to explain rapid progression, in which a collapse of CD8 responsiveness could lead to relatively uncontrolled virus replication, potentially driving the disease and the eventual failure in maintaining memory CD4 cell pool.
Material & Methods
Animals and Infection
SIV-type D and Herpes B Virus-free rhesus macaques, purchased from Labs of Virginia and Charles River Laboratory, were infected with a cell-free SIV stock derived from SIVmac251 [22]. All animal experiments were performed with approval from the Institutional Animal Care and Use Committee following NIH guidelines. Animals were anesthetized with 10-15 mg/kg of ketamine intramuscularly prior to experimental procedures. Blood was serially drawn from the femoral vein, and plasma was obtained from EDTA-treated blood. At necropsy, performed after terminal anesthesia, animals were intracardially perfused with sterile PBS containing 1 U/ml heparin. Tissue samples were taken for cell isolation, virus quantification, and formalin fixation for histology.
Viral Quantitation
Plasma and brain SIV RNA was calculated by using quantitative branched DNA (bDNA) signal amplification assay performed by Siemens Clinical Laboratory (Emeryville, CA).
Cells
Cells separated from EDTA-treated blood centrifugation, and 70 μm nylon-mesh sieved cells from spleen, lymph nodes, and liver, were subjected to Histopaque (Sigma-Aldrich, St. Louis, MO) gradient for isolation of the mononuclear fraction.
Brain cells
Following perfusion, the brain was removed and carefully freed of meninges. Brain immune cells were isolated by enzymatic digestion of minced tissue, followed by Percoll gradient, as previous described [23].
Mamu MHC genotyping
Splenic cells were used for DNA extraction, using QIAamp DNA Mini Kit (Qiagen), following manufacturer’s protocols. Samples were assessed using a PCR-based class I MHC genotyping, at the University of Wisconsin AIDS Vaccine Research Laboratory. The class II genotyping was performed as described [24].
Viral sequencing
Plasma and CSF were ultracentrifuged at 33,000 rpm (Beckman Coulter SW 50.1 rotor) for 35 mins to pellet virus.Viral RNA was then obtained, cDNA synthesized, and corresponding to the tat and gag genes determined as previously described [21].
Flow cytometry
Isolated cells were stained with labeled antibodies in PBS containing 2% FCS and 0.01% NaN3. The antibodies used were anti-monkey CD3-biotin (clone FN-18, Invitrogen Biosource, Carlsbad, CA) followed by Streptavidin-PerCP or APC (BD Pharmingen, San Diego, CA), anti-human CD8-PE, FITC or PeCy5 (clone DK25, Dako, Carpinteria, CA), anti-CD95-FITC (Dako), anti-human CCR5-APC (BD Pharmingen), anti-CD11a-FITC (clone 25.3.1, Immunotech), anti-CD122-PE (BD Pharmingen), anti-CD25-PE (BD Pharmingen) what about the cytokine antibodies or isotype controls (BD Pharmingen). Additionally, PE-labeled Tat and Gag-tetramers (Beckman-Coulter, Fullerton, CA) were employed for specific CD8 cells detection. Cells from SIV-infected non-MamuA*01 monkeys, and uninfected MamuA*01-positive animals, were used as negative controls. For Ki67 and intracellular cytokine staining, cells were washed with FACS Lysis Buffer (BD Pharmingen), fixed with 3% paraformaldehyde and permeabilized with 0.3% Triton X-100. After incubation with anti-Ki67-FITC (clone MIB-1, Dako) or isotype controls (BD Pharmingen) cells were maintained in 3% paraformaldehyde no more than overnight. Prior to the staining with anti-IFNγ, anti-TNFα or anti-IL2 (BD Pharmingen), cells were treated with 10 ng/ml PMA (Sigma), 200 ng/ml ionomycin (Sigma) followed by the addition of 10 μg/ml brefeldin-A (BFA) (Sigma) and incubation for 4 hourss. Stained cells were acquired by a FACSCalibur (BD Biosciences, San Jose, CA) flow cytometer, and analyzed in FlowJo 6.2.1 software (Tree Star Inc., San Carlos, CA).
CD8 depletion
SIV-inoculated, non-MamuA*01 monkeys were transiently depleted of CD8+ lymphocytes by administration of anti-human CD8 monoclonal antibody (MAb), cM-T807, at a dose of 10 mg/kg of body weight, subcutaneously on day 6 post-inoculation, followed by 5 mg/kg intravenously on days 9 and 13, as reported [7].
Results
Initial development and early loss of CTL in rapid progressors
We identified eight MamuA*01 animals in our studies: five had a regular disease course, and three had rapidly progressive disease. In addition to MamuA*01, animals were typed for other disease progression-correlated MHC alleles [24]. However there was not a distinctive pattern of Mamu MHC class I or class II alleles associated with rapid progression (not shown). Clinically, the three MamuA*01-positive animals with rapid disease progression (RAP) showed wasting syndrome and symptoms of neurological disease. Terminal neuropathology revealed SIV encephalitis. We assessed Gag and Tat epitope reactivity using tetramers longitudinally in the blood, and at necropsy, in lymphoid and non-lymphoid organs, in two of the rapidly progressing animals (#s 417 and 418); the third animal (#228) had been studied before these reagents were available. These data were compared to that found in four recently reported MamuA*01 regular progressors (REG, #s 404, 406, 409, and 414; the fifth animal, #324, had been studied before these reagents were available). These were sacrificed following 6-months of infection in the absence of AIDS-like disease.
Following the acute stage, RAP animals 417 and 418 did not control viremia, and maintained high levels of plasma virus (Figure 1A). Both pre-inoculation and in the post-acute phase, RAPs tended to have higher numbers of blood lymphocytes (Figure 1B). The percentage of CD4+ cells did not differ significantly over the time points examined between REG and RAP animals (not shown). However, CD4+ T cell numbers were increased in RAP animals, compared to the REG group (Figures 1C). The percentage of CD8+ cells peaked acutely in REG animals, but not in individual RAP monkeys (not shown). In absolute numbers, blood CD8+ T cells increased acutely (days 14 and 28 p.i., averaging 3-fold over their pre-infection level) in the blood of REG animals following infection, but in the RAP, relative to their pre-infection level (Figure 1D). The absence of an acute increase in the proportion of CD8 cells in RAPs suggests that importance of the CD8 cells in the control of the initial viremia.
Figure 1.
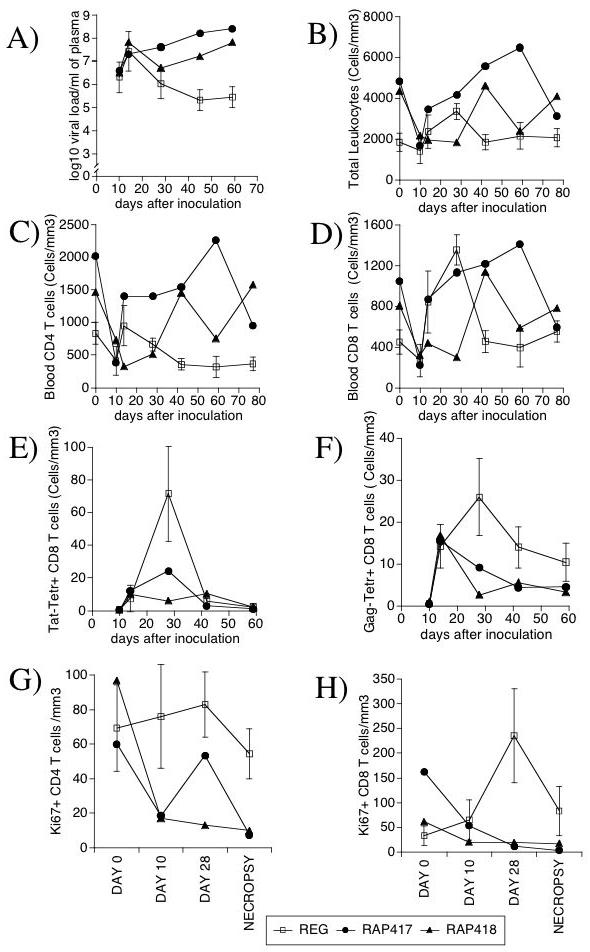
Viral Load, Blood Leukocytes, T cells and proliferating activity in SIV-infected MamuA*01 animals with a regular (REG - open symbol) or rapid (RAP - black symbols) disease course, 417 and 418. (A) Plasma Viral Load. (B) Total blood lymphocyte counts. (C) Number of blood CD3+CD4+ T cells, (D) Number of blood CD3+CD8+ T cells. Enumerated blood leukocytes were simultaneously stained with antibodies anti-CD3, CD8 and Tat-tetramer (E), or Gag-tetramer (F). Values correspond to the number of Tetramer-positive cells per volume of blood. Proliferating activity was measured by the detection of the number of cells expressing Ki-67 nuclear antigen by FACS on gated (G) CD3+ CD8+ T cells and (H) CD3+ CD8- CD4 cells, before infection, at days 10 and 28 after infection, and at necropsy. REG values (open symbols) are expressed as Average ± SD of 4 animals, while RAP animals (closed symbols) are individually displayed.
In order to evaluate the contribution of the specific CTL response against the major SIV epitopes Tat and Gag, tetramer staining was applied to the pool of CD8 cells. Early after inoculation, both Tat and Gag-reactive cells were found in the blood of both RAP and REG animals. As previously described, in both groups Tat-specific cells disappeared from the blood soon after the acute phase (Figure 1E). However, Gag-reactive cells, which are maintained in REG animals and dominant in chronically SIV-infected MamuA*01 animals [20], disappeared from the blood in RAP animals (Figure 1F). This loss was similarly observed in the proportion Tat and Gag-specific CD8 cells within the CD8 cell population (not shown). Thus, extinction of virus-specific CD8 cells was distinctive in rapid progression.
Epitope escape has been suggested as a mechanism for virus-specific CTL decay, particularly within the Tat epitope in MamuA*01 regular progressor animals. Differences in the sequence encoding Tat and Gag epitopes were assessed in viral genomic RNA isolated from plasma and CSF. All clones from animal 418 had escape mutations within the Tat epitope; the most frequent Tat SL8 epitope mutations located at position 26 (Ala to Asp) and 28 (Ser to Pro or Thr). However in the plasma of animal 417 the virus did not exhibit escape mutations either in Tat or in its flanking regions In a similar manner, regardless of the degree of epitope escape, Tat-reactive cells disappear from the blood in regular progressors [18]. In all animals, no mutations were detected within the Gag epitope and flanking regions. Overall, although in 418 the CTLs were efficacious in their ability to select for escape mutants within Tat, the disappearance in CTLs in the RAP animals could not be explained by viral escape.
Global CD8 T cell alterations in rapid progressors
The proliferative status of CD8 and CD4 T cells was assessed by the frequency of cells expressing Ki-67, a nuclear marker of cell cycle (G1, G2, S), acutely and at necropsy. Although there was not a clear separation between the groups in CD4 cells looks to me like there is a clear separation (Figure 1G), following infection REG animals consistently had increased proportion of Ki67+ CD8 T cells relative to RAPs (Figure 1H). This suggests that a failure to respond to SIV infection with CD8 T cell proliferation is a hallmark of rapid progression.
In addition to the disappearance of CD8 cells reactive to the two major MamuA*01-restricted epitopes in RAP animals, a notable decrease of the surface expression of the chemokine receptor CCR5 and the activation marker/adhesion molecule CD11a/LFA-1 occurred in the total CD8 compartment (Figure 2A, B). The lower expression of CCR5 that characterized RAP animals was observed also on the tetramer+ fraction of CD8+ cells, especially early following infection (day 10) and at termination, when RAP animals had disease symptoms (Figure 2C) But you don’t show termination, you show day 59. Representative flow cytometry data for tetramer and CCR5 expression are shown for a REG animal and the two RAPs in Figure 2D-F. Together, these results suggest that the loss of the immunodominant CTL in rapid progressors occurs in correlation with decreased expression of functionally relevant surface molecules on the totality of CD8 cells.
Figure 2.
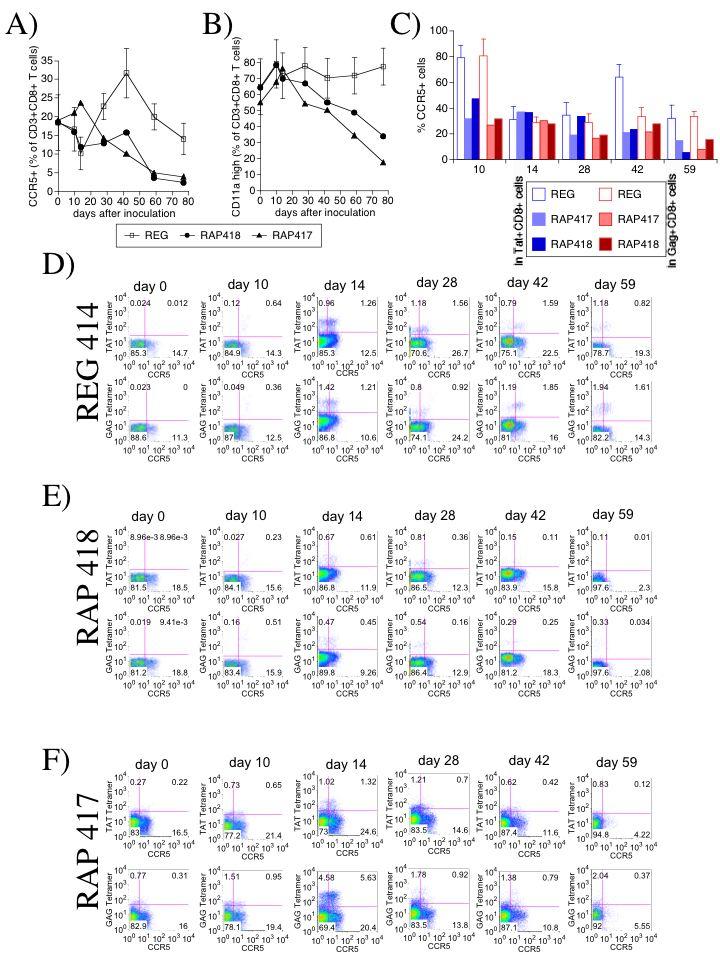
Expression of CCR5 and CD11a on CD8 T cells from blood of monkeys exhibiting regular or rapid disease progression. The percentage of CD8 T cells expressing (A) CCR5 and (B) CD11a/LFA-1was assessed by FACS on CD3 and CD8-positively gated cells. REG values represent the average ± SD of 4 animals, and RAP animals are displayed individually. CCR5 was analyzed also on tetramer-positive CD8 cells in perspective with the total CD8 compartment. (C) Percentage of CCR5+ cells within Tat+ CD8+ fraction (blue) and within Gag+ CD8+ fraction of cells (red) along the infection. FACS plots display Gag or Tat-MamuA*01-restricted tetramer staining in addition to CCR5 on cells gated according to the positive expression of CD3 and CD8. Cells were obtained from blood periodically drawn from animals. Panel D shows one representative animal from REG group. Panels E and F show individual RAP animals (418 and 417, respectively). Upper rows of each one of the panels shows TAT-specific staining in combination with CCR5, and lower rows show GAG-specific staining with CCR5, across infection.
Rapid progressors lack CTL outside of the brain
The disappearance of virus-specific CTL from the blood could be related to tissue demand and migration. This possibility was assessed by the quantification of T cells and tetramer-positive CTLs in various organs at necropsy. In the blood, RAP animals had both relative (Figure 3A) and absolute (not shown) CD4 T cell numbers higher than those found in the REG group. In addition, an increased percentage of CD4 cells were observed in the liver of RAP animals in comparison to REGs, but not in the spleen or in the brain (the latter contained very few CD4+ cells in all animals) (Figure 3A). Neither the percentage of CD8 cells in all sites (Figure 3B) nor the absolute numbers of these cells in the blood differed between RAP and REG groups.
Figure 3.
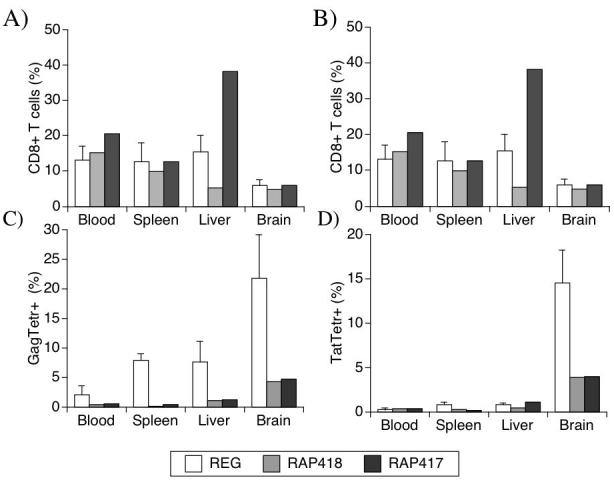
T cell distribution in different peripheral organs and in the brain. At necropsy, cell suspensions from various organs were stained using antibodies against CD3 and CD4, or CD8, for quantification by FACS. The relative values of T cell subsets from blood, spleen, liver and brain are shown. (A) CD3+ CD4+ cells. (B) CD3+CD8+ cells. The percentage of (C) Tat and (D) Gag specific cells within the CD8 population in different sites of regular and rapid progressors was also assessed. Cells suspensions were stained with MamuA*01-restricted Tat or Gag tetramer complexes in addition with specific antibodies. REG values (white bars) correspond to the average ± SD of 4 animals, and RAP animals are displayed individually (gray bar, animal 418 and black bar, animal 417).
The CTL specificity within the CD8+ T cell population was determined in the organs using Gag and Tat tetramers. Similar to blood, neither Tat nor Gag CTLs were found in the organs of RAP monkeys at necropsy, except for the brain (Figures 3C and 3D). Such findings were qualitatively similar to our report of Tat-reactive cells in the CNS, but not elsewhere, in REG monkeys [21]. Here, RAP monkeys also did not have Gag specificity in peripheral sites, but similar to Tat, did have these cells in the brain. Thus, virus-specific CD8 cells, which disappeared from the periphery of RAP animals, could be found in the CNS. However, although REG and RAP monkeys had similar levels of CD8+ T cells in the brain (Figure 3B), in REG animals Tat and Gag-specific cells represented over one-third of all CD8 cells found in the brain [21], while in RAP animals, both specificities together were less than one-tenth of the CD8 cells (Figure 3C and 3D).
Assessment of brain viral load revealed a likely consequence of this decrease in brain CTL. Each RAP animal had over 10,000-fold higher levels of virus in brain (measured in frontal lobe) than did REGs (not shown). Therefore, although the anti-viral specific response is still present in the brain, it is insufficient to control the virus.
The deficiencies in the CD8 compartment in RAP animals were further evidenced by a lower percentage of cells expressing CD25 (IL2 receptor α chain) and CD122 (IL2 receptor β chain) in the blood at terminal time-points (Figure 4A), suggesting a poor responsiveness to stimulation through IL2 as well as IL15. In addition, the ability of blood CD8 T cells to produce the cytokines IFNγ, TNFα and IL2 was determined in the animals both at the peak of CD8 cell increased in the REG monkeys (28 days, Figure 1D) and at termination. A lower percentage of cells from the two RAP animals was capable of producing the pro-inflammatory cytokines IFNγ and TNFα (Figure 4B), in both cases the difference was greater at the terminal point than at 28 days p.i.Together, these data indicate that the CD8 T cellpopulation in RAP animals is deficient in several functional aspects following SIV infection.
Figure 4.
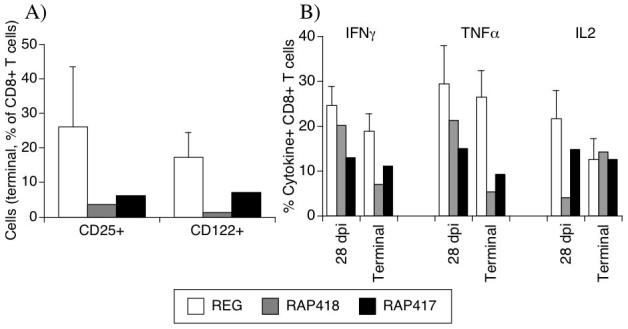
Expression of IL2/IL15 receptors and cytokine secretion pattern in peripheral CD8 T cells. (A) Percentage of CD8 cells expressing CD25 and CD122 in the blood of REG and individual RAP animals at the time point when animals were sacrificed. (B) Percentage of CD8 cells in the peripheral blood that secreted IFNγ, TNFα and IL2 upon PMA and Ionomycin stimulation, 28 days after infection and at the termination time points. REG values (white bars) correspond to the average ± SD of 4 animals, and RAP animals are displayed individually (gray bar, animal 418 and black bar, animal 417).
CD8 T cell deficits parallel those found in CD4 T cells
Since the eventual loss of memory CD4+ T cells has been linked to SIV-induced disease, we assessed CD4 cell memory and activation phenotypes. Despite the relative abundance of the total CD4 cell compartment, RAP animals had a lower percentage of CD4 cells expressing CD95, a correlate of memory phenotype in rhesus macaques, than REG animals in the blood, spleen (Figure 5A), and in other sites such as lymph nodes (not shown). CD95 expression histograms of individual RAP animals and one representative REG (Figure 5B) show the decreased levels of CD95 on CD4 cells from different sites. Moreover, a decrease of CD4 cells expressing high CD11a was observed in the organs (Figure 5C). Representative CD11a expression histograms can be observed in Figure 5D. Interestingly, longitudinal analysis revealed that the decrease of CD11a on CD4 cell surface occurred early in both RAP animals (as percents, Figure 5E, and absolute numbers, Figure 5F). This was also detectable in lymphoid organs such as lymph nodes, in both MamuA*01 animals and in other non-MamuA*01 animals (Figure 5G).
Figure 5.
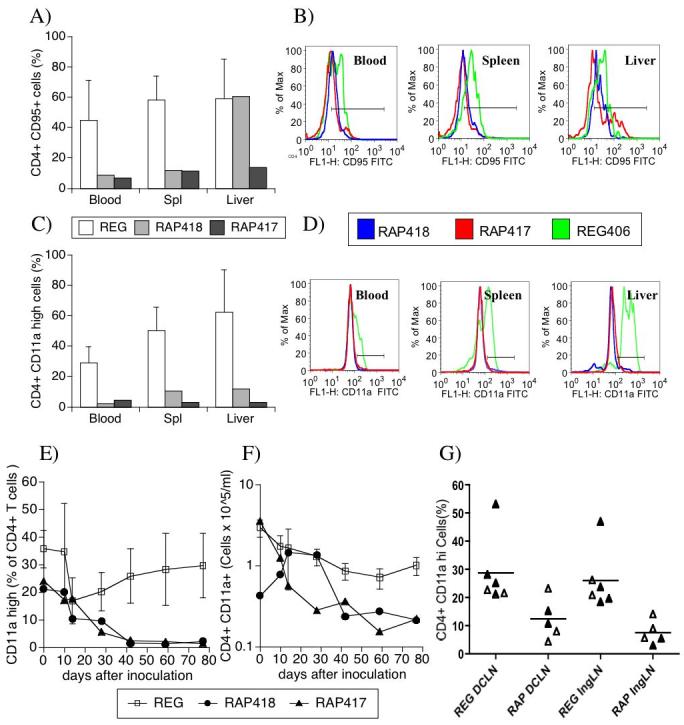
Memory and activation surface markers on CD4 T cells in the blood and in different organs in SIV-infected monkeys exhibiting regular or rapid disease course. The expression of CD95 (A and B) and CD11a (C and D) was accessed on CD4 cells obtained from different sites of REG and RAP animals at necropsy. Panels A and C show the percentage of CD95 and CD11a-positive cells, respectively, within gated CD4 T cells. Additional gates were designed based on isotype controls. REG values (white bars) correspond to the average ± SD of 4 animals, and RAP animals are displayed individually (gray bar, animal 418 and black bar, animal 417). Panels B and D show the profile of CD95 and CD11a expression, respectively on gated CD4 T cells from the different sites, the green line being one representative animal from REG group (animal 406), and the blue and red lines individual RAP animals, 418 and 417, respectively. (E) Percentage of CD4 cells expressing high levels of CD11ain the blood of RAP and REG MamuA*01 animals. (F) Absolute numbers of CD4+ CD11a high expressing cells in the blood of RAP and REG Mamu A*012 animals. Open symbols represent the average ± SD of 4 REG animals, and RAP animals are displayed individually (closed symbols). (G) Percentage of CD4+ CD11a+ cells in the deep cervical (DCLN) and inguinal lymph nodes (IngLN) of RAP and REG animals bearing Mamu A*01 class I MHC (closed triangles), or not (open triangles).
CD8 collapse can drive the characteristic CD4 alterations
We hypothesized that the decrease of memory CD4 cells in SIV infected monkeys may be secondary to intrinsic defects in the CD8 compartment. To assess this hypothesis, we examined the phenotype of CD4 cells in monkeys (not carrying the MamuA*01 allele), which were depleted of CD8 cells (by anti-CD8 MAb) just after viral inoculation, to mimic the physiological collapse in the CD8 population. Indeed, these animals developed a drastic fall of CD11a high CD4+ cells. Upon incomplete recovery of CD8 levels, the CD11a expression on CD4+ cells exhibited a partial regaining before diminishing again (Figure 6A). In contrast, mock-depleted animals did not manifest this compromise of CD4 cells (Figure 6B). Similar to the RAP group, as reported earlier, CD8-depleted animals were unable to control viral load (Figure 6C), developed disease quickly, and at sacrifice (93-111 days p.i.) exhibited encephalitis. At necropsy, CD8 depleted animals had decreased CD8 proportions in all sites in comparison to REG non-MamuA*01 animals (Figure 6D). Furthermore, CD4 cells from different sites of these animals had lower levels of CD95 (Figures 6E and 6F) in comparison to CD4 cells from non-CD8 depleted non-MamuA*01 regular progressors, indicating memory CD4 cell deficiency. Similarly, in the different sites, lower levels of CD11a were found in CD8-depleted animals (Figure 6G). Therefore, mimicking early CD8 deficits by CD8 depletion leads to CD4 changes and AIDS, suggesting that CD8 collapse can be instructive to the CD4 dysfunction.
Figure 6.
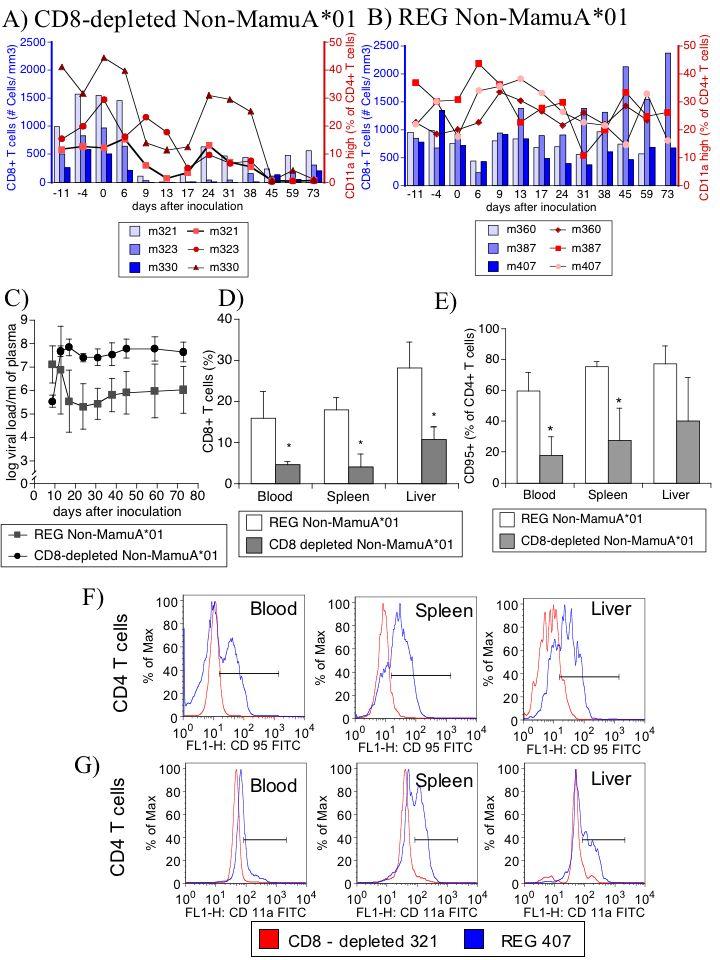
CD8 depletion-induced rapid progression in non-MamuA*01 animals causes CD4 phenotypical alterations that mimic RAP. (A) Percentage of CD11a high-expressing CD4 cells (red symbol lines, right Y-axis) after SIV infection and following CD8 depletion (absolute number of CD3+ CD8+ T cells, blue bars, left Y-axis). (B) Percentage of CD11a high-expressing CD4 cells (red symbol lines, right Y-axis) after SIV infection, and absolute number of CD3+ CD8+ T cells (blue bars, left Y-axis). (C) Viremia of non-MamuA*01 REG animals depleted or CD8 cells (circles) or not (squares). (D) Percentage of CD8+ T lymphocytes in different organs from CD8 depleted animals (gray bars) in comparison to controls (white bars). (E) At necropsy, CD95 expression on CD4 cells from the non-MamuA*01 animals that were CD8 depleted in comparison to SIV-infected non-MamuA*01 animals which did not suffer CD8 depletion. Values correspond to the average ± SD. (* p<0.05, t test). (F) Histograms of expression of CD95 on gated CD4 cells from one representative animal from non-MamuA*01REG group (animal 407 - blue line) and one non-MamuA*01 CD8-depleted animal (animal 321 - red line) in different sites. (G) Histograms of expression of CD95 on CD4 cells from the same animals.
Discussion
Here we find that in rapid progressors SIV-specific CTL develops initially, but quickly disappears from the body, except for the CNS. In the general CD8 T cell compartment, striking changes develop - a decrease in CCR5+ and CD11a high cells, in temporal association with a loss of virus-specific CTL, and a failure to proliferate. In addition to the characteristic decrease in memory CD4 cells, we also find a loss of CD11a+ in the CD4 population. These changes on CD4 cells are closely correlated to changes on CD8 cells in rapid progressors, and inability to control viral load. We then asked whether these CD4 changes could be driven by the CTL loss and resulting high viral load. In infected animals in which CD8 cells were experimentally depleted at infection, rapid progression was accompanied by similar CD4 changes, leading us to consider whether changes in CD4 cells can result from a failure of CD8 responsiveness.
The alterations in the CD8 T cell compartment were beyond the inability to recognize immunodominant epitopes Gag and Tat, reaching the totality of the CD8 population regarding the expression of surface molecules (CCR5 and CD11a). In addition, CD8 proliferation was lower in RAPs than in REGs. In the CD4 compartment we observe a loss of memory CD4 cells, confirming previous reports [5]. In addition, there is a loss of cells expressing high levels of CD11a in the CD4 population.
These experiments reveal a correlation between rapid progression in SIV-infected animals and a failure to enrich and maintain major anti-viral CD8 specificities. Others have reported dysfunctions in the CD4 cell population in rapid progressors as related to defects on memory replenishment [5], as well as defects in CD8 T cells/CTL [11]. Although these facts are interconnected, the instructive events were never well clarified. Our findings reveal that the wheel of rapid progression may reside primarily in the CD8 compartment.
The expression of CD95 and CD11a on CD4 cells was lower in the RAP than in the REG group, confirming the correlation of a restricted availability of memory cells with the development of disease [5, 25]. We determined that such findings could develop following CD8 failure, experimentally induced by CD8 cell depletion. Overall, our data indicates the connection between the collapse of the epitope recognition and immunodominance patterns in CD8 cells and CD4 memory availability. The nature of the CD8 requirements during the early acute phase is not clear, and may not be restricted to priming, recognition and effector activity against viral epitopes. The outcome, in terms of CD4 changes and rapid disease was identical in natural and experimentally induced rapid progression. Thus the dysfunction identified by the decline on memory and activated CD8+ T cells is as profound as if such cells were eliminated.
A similar outcome was previously obtained by an approach that utilizes blockage of co-stimulatory signals, which, as a result, attenuates SIV-specific CTL response and decreases CD8 proliferation, leading to an increase in viremia and rapid progression [26]. In fact, rapid progressors failed to maintain proliferation activity in the whole CD8 population following the acute infection. This could be due to functional exhaustion or impaired induction of CD8 cells, classically attributed to defective CD4 help [27].
The use of CD8 depletion to accelerate disease strongly suggests CD8 cells are pivotal in early viral load control. Moreover, CD8-depleted animals developed CD4 cells that phenotypically resemble those found in spontaneous rapid progression. However, CD8 depletion potentially disturbs homeostatic and antigen-driven proliferation of CD4+ cells, and eliminates NK cells (expressing CD8 in rhesus monkeys). Nevertheless, mathematical models that take into account the balance between virus and target cells, examining both non-manipulated infection and animals in which co-stimulatory blockage was performed to modulate CD8 response, indicate that at early periods of infection (first month after inoculation) viral control is due to CTL, in a positive correlation either with CD8+ T cells as a whole or with the Tat and Gag CTLs individually in MamuA*01 animals [29]. From our work, we suggest that the CD8 functional aspects that define progression at initial time-points result from the viral-host interactions, but are in fact not restricted to the virus-specific population.
Since rapid progression is correlated with encephalitis, the brain findings are particularly interesting. In REG animals, the MamuA*01-restricted immunodominant anti-Tat and anti-Gag CD8 CTL represent close to 50% of the brain accumulating CD8 cells [21]. Interestingly, in RAP animals the brain environment still supports CD8 accumulation, however the proportion of SIV Tat and Gag-specific CD8 cells among the brain-infiltrating CD8 cells is strikingly lower. Thus possibly the proportion of immunodominant CTLs rather than the brain CD8 accumulation per se, affects the viral control and protection from encephalitis.
The development of CD4 deficits and rapid progression to AIDS as a result of loss of control over viral load due to CD8 defects represent an alternative perspective to other concepts, in which loss of CD4 memory and helper activity actually lead to AIDS. Our results indicate that in SIV-infected macaques a collapse of CD8 cells can potentially sign for the damage to the CD4 memory pool related to rapid progression. The basis of the global defect in CD8 cells should be investigated in depth, and may give important clues for the development of therapeutic strategies, aimed at maintaining functional CTL. The importance of these findings resides on the out-of-the-ordinary perspective and understanding of the necessity of therapeutic approaches that focus on better virus-specific CD8 expansion, as well as on the search for mechanisms of global CD8 response regulation, and biomarkers that identify the CD8 collapse related to progression.
Acknowledgments
This work was supported by NIH grants MH062261 and MH073490. We thank Dr. Bianca Mothe’ (California State University San Marcos) for interesting and helpful discussions, and Nancy Delaney for administrative assistance. This is the manuscript #19185 of The Scripps Research Institute.
References
- 1.Anzala OA, Nagelkerke NJ, Bwayo JJ, Holton D, Moses S, Ngugi EN, et al. Rapid progression to disease in African sex workers with human immunodeficiency virus type 1 infection. J Infect Dis. 1995;171:686–689. doi: 10.1093/infdis/171.3.686. [DOI] [PubMed] [Google Scholar]
- 2.Westmoreland SV, Halpern E, Lackner AA. Simian immunodeficiency virus encephalitis in rhesus macaques is associated with rapid disease progression. J Neurovirol. 1998;4:260–268. doi: 10.3109/13550289809114527. [DOI] [PubMed] [Google Scholar]
- 3.Smith SM, Holland B, Russo C, Dailey PJ, Marx PA, Connor RI. Retrospective analysis of viral load and SIV antibody responses in rhesus macaques infected with pathogenic SIV: predictive value for disease progression. AIDS Res Hum Retroviruses. 1999;15:1691–1701. doi: 10.1089/088922299309739. [DOI] [PubMed] [Google Scholar]
- 4.Staprans SI, Dailey PJ, Rosenthal A, Horton C, Grant RM, Lerche N, Feinberg MB. Simian immunodeficiency virus disease course is predicted by the extent of virus replication during primary infection. J Virol. 1999;73:4829–4839. doi: 10.1128/jvi.73.6.4829-4839.1999. [DOI] [PMC free article] [PubMed] [Google Scholar]
- 5.Picker LJ, Hagen SI, Lum R, Reed-Inderbitzin EF, Daly LM, Sylwester AW, et al. Insufficient production and tissue delivery of CD4+ memory T cells in rapidly progressive simian immunodeficiency virus infection. J Exp Med. 2004;200:1299–1314. doi: 10.1084/jem.20041049. [DOI] [PMC free article] [PubMed] [Google Scholar]
- 6.Okoye A, Meier-Schellersheim M, Brenchley JM, Hagen SI, Walker JM, Rohankhedkar M, et al. Progressive CD4+ central memory T cell decline results in CD4+ effector memory insufficiency and overt disease in chronic SIV infection. J Exp Med. 2007;204:2171–2185. doi: 10.1084/jem.20070567. [DOI] [PMC free article] [PubMed] [Google Scholar]
- 7.Roberts ES, Zandonatti MA, Watry DD, Madden LJ, Henriksen SJ, Taffe MA, Fox HS. Induction of pathogenic sets of genes in macrophages and neurons in NeuroAIDS. Am J Pathol. 2003;162:2041–2057. doi: 10.1016/S0002-9440(10)64336-2. [DOI] [PMC free article] [PubMed] [Google Scholar]
- 8.Madden LJ, Zandonatti MA, Flynn CT, Taffe MA, Marcondes MC, Schmitz JE, et al. CD8+ cell depletion amplifies the acute retroviral syndrome. J Neurovirol. 2004;10(Suppl 1):58–66. doi: 10.1080/753312754. [DOI] [PubMed] [Google Scholar]
- 9.Bissel SJ, Wang G, Trichel AM, Murphey-Corb M, Wiley CA. Longitudinal analysis of monocyte/macrophage infection in simian immunodeficiency virus-infected, CD8+ T-cell-depleted macaques that develop lentiviral encephalitis. Am J Pathol. 2006;168:1553–1569. doi: 10.2353/ajpath.2006.050240. [DOI] [PMC free article] [PubMed] [Google Scholar]
- 10.Evans DT, O’Connor DH, Jing P, Dzuris JL, Sidney J, da Silva J, et al. Virus-specific cytotoxic T-lymphocyte responses select for amino-acid variation in simian immunodeficiency virus Env and Nef. Nat Med. 1999;5:1270–1276. doi: 10.1038/15224. [DOI] [PubMed] [Google Scholar]
- 11.Hirsch VM, Santra S, Goldstein S, Plishka R, Buckler-White A, Seth A, et al. Immune failure in the absence of profound CD4+ T-lymphocyte depletion in simian immunodeficiency virus-infected rapid progressor macaques. J Virol. 2004;78:275–284. doi: 10.1128/JVI.78.1.275-284.2004. [DOI] [PMC free article] [PubMed] [Google Scholar]
- 12.Evans DT, Jing P, Allen TM, O’Connor DH, Horton H, Venham JE, et al. Definition of five new simian immunodeficiency virus cytotoxic T-lymphocyte epitopes and their restricting major histocompatibility complex class I molecules: evidence for an influence on disease progression. J Virol. 2000;74:7400–7410. doi: 10.1128/jvi.74.16.7400-7410.2000. [DOI] [PMC free article] [PubMed] [Google Scholar]
- 13.Koup RA, Safrit JT, Cao Y, Andrews CA, McLeod G, Borkowsky W, et al. Temporal association of cellular immune responses with the initial control of viremia in primary human immunodeficiency virus type 1 syndrome. J Virol. 1994;68:4650–4655. doi: 10.1128/jvi.68.7.4650-4655.1994. [DOI] [PMC free article] [PubMed] [Google Scholar]
- 14.Hay CM, Ruhl DJ, Basgoz NO, Wilson CC, Billingsley JM, DePasquale MP, et al. Lack of viral escape and defective in vivo activation of human immunodeficiency virus type 1-specific cytotoxic T lymphocytes in rapidly progressive infection. J Virol. 1999;73:5509–5519. doi: 10.1128/jvi.73.7.5509-5519.1999. [DOI] [PMC free article] [PubMed] [Google Scholar]
- 15.Islam SA, Hay CM, Hartman KE, He S, Shea AK, Trocha AK, et al. Persistence of human immunodeficiency virus type 1-specific cytotoxic T-lymphocyte clones in a subject with rapid disease progression. J Virol. 2001;75:4907–4911. doi: 10.1128/JVI.75.10.4907-4911.2001. [DOI] [PMC free article] [PubMed] [Google Scholar]
- 16.Pantaleo G, Soudeyns H, Demarest JF, Vaccarezza M, Graziosi C, Paolucci S, et al. Evidence for rapid disappearance of initially expanded HIV-specific CD8+ T cell clones during primary HIV infection. Proc Natl Acad Sci U S A. 1997;94:9848–9853. doi: 10.1073/pnas.94.18.9848. [DOI] [PMC free article] [PubMed] [Google Scholar]
- 17.Allen TM, Sidney J, del Guercio MF, Glickman RL, Lensmeyer GL, Wiebe DA, et al. Characterization of the peptide binding motif of a rhesus MHC class I molecule (Mamu-A*01) that binds an immunodominant CTL epitope from simian immunodeficiency virus. J Immunol. 1998;160:6062–6071. [PubMed] [Google Scholar]
- 18.Allen TM, O’Connor DH, Jing P, Dzuris JL, Mothe BR, Vogel TU, et al. Tat-specific cytotoxic T lymphocytes select for SIV escape variants during resolution of primary viraemia. Nature. 2000;407:386–390. doi: 10.1038/35030124. [DOI] [PubMed] [Google Scholar]
- 19.Kuroda MJ, Schmitz JE, Barouch DH, Craiu A, Allen TM, Sette A, et al. Analysis of Gag-specific cytotoxic T lymphocytes in simian immunodeficiency virus-infected rhesus monkeys by cell staining with a tetrameric major histocompatibility complex class I-peptide complex. J Exp Med. 1998;187:1373–1381. doi: 10.1084/jem.187.9.1373. [DOI] [PMC free article] [PubMed] [Google Scholar]
- 20.Newberg MH, McEvers KJ, Gorgone DA, Lifton MA, Baumeister SH, Veazey RS, et al. Immunodomination in the Evolution of Dominant Epitope-Specific CD8+ T Lymphocyte Responses in Simian Immunodeficiency Virus-Infected Rhesus Monkeys. J Immunol. 2006;176:319–328. doi: 10.4049/jimmunol.176.1.319. [DOI] [PubMed] [Google Scholar]
- 21.Marcondes MC, Burdo TH, Sopper S, Huitron-Resendiz S, Lanigan C, Watry D, et al. Enrichment and persistence of virus-specific CTL in the brain of simian immunodeficiency virus-infected monkeys is associated with a unique cytokine environment. J Immunol. 2007;178:5812–5819. doi: 10.4049/jimmunol.178.9.5812. [DOI] [PubMed] [Google Scholar]
- 22.Watry D, Lane TE, Streb M, Fox HS. Transfer of neuropathogenic simian immunodeficiency virus with naturally infected microglia. Am J Pathol. 1995;146:914–923. [PMC free article] [PubMed] [Google Scholar]
- 23.Marcondes MC, Burudi EM, Huitron-Resendiz S, Sanchez-Alavez M, Watry D, Zandonatti M, et al. Highly activated CD8(+) T cells in the brain correlate with early central nervous system dysfunction in simian immunodeficiency virus infection. J Immunol. 2001;167:5429–5438. doi: 10.4049/jimmunol.167.9.5429. [DOI] [PubMed] [Google Scholar]
- 24.Sauermann U, Stahl-Hennig C, Stolte N, Muhl T, Krawczak M, Spring M, et al. Homozygosity for a conserved Mhc class II DQ-DRB haplotype is associated with rapid disease progression in simian immunodeficiency virus-infected macaques: results from a prospective study. J Infect Dis. 2000;182:716–724. doi: 10.1086/315800. [DOI] [PubMed] [Google Scholar]
- 25.Sopper S, Sauer U, Muller JG, Stahl-Hennig C, ter Meulen V. Early activation and proliferation of T cells in simian immunodeficiency virus-infected rhesus monkeys. AIDS Res Hum Retroviruses. 2000;16:689–697. doi: 10.1089/088922200308918. [DOI] [PubMed] [Google Scholar]
- 26.Garber DA, Silvestri G, Barry AP, Fedanov A, Kozyr N, McClure H, et al. Blockade of T cell costimulation reveals interrelated actions of CD4+ and CD8+ T cells in control of SIV replication. J Clin Invest. 2004;113:836–845. doi: 10.1172/JCI19442. [DOI] [PMC free article] [PubMed] [Google Scholar]
- 27.Shedlock DJ, Shen H. Requirement for CD4 T cell help in generating functional CD8 T cell memory. Science. 2003;300:337–339. doi: 10.1126/science.1082305. [DOI] [PubMed] [Google Scholar]
- 28.Milush JM, Reeves JD, Gordon SN, Zhou D, Muthukumar A, Kosub DA, et al. Virally induced CD4+ T cell depletion is not sufficient to induce AIDS in a natural host. J Immunol. 2007;179:3047–3056. doi: 10.4049/jimmunol.179.5.3047. [DOI] [PubMed] [Google Scholar]
- 29.Regoes RR, Antia R, Garber DA, Silvestri G, Feinberg MB, Staprans SI. Roles of target cells and virus-specific cellular immunity in primary simian immunodeficiency virus infection. J Virol. 2004;78:4866–4875. doi: 10.1128/JVI.78.9.4866-4875.2004. [DOI] [PMC free article] [PubMed] [Google Scholar]