

Summary
Controversy surrounds the role and mechanism of mitochondrial cristae remodeling in apoptosis. Here we show that pro-apoptotic BH3-only proteins Bid and Bim induced full cytochrome c release but only a subtle alteration of crista junctions, which involved the disassembly of Opa1 complexes. Both mitochondrial outer membrane permeabilization (MOMP) and crista junction opening (CJO) were caspase-independent and required a functional BH3 domain and Bax/Bak. However, MOMP and CJO were experimentally separable. Pharmacological blockade of MOMP did not prevent Opa1 disassembly and CJO; moreover, expression of a disassembly-resistant mutant Opa1 (Q297V) blocked cytochrome c release and apoptosis but not Bax activation. Thus, apoptosis requires a subtle form of Opa1-dependent crista remodeling induced by BH3-only proteins and Bax/Bak, but independent of MOMP.
Introduction
A key event in apoptosis is mitochondrial outer membrane permeabilization (MOMP). MOMP is triggered by pro-apoptotic BH3-only proteins, is mediated by Bax and Bak, and causes the release of several proteins from the mitochondrial intermembrane space (IMS). These proteins, which include cytochrome c and Smac/DIABLO, then trigger caspase activation and cell death. The release of these proteins is synchronous within a given cell and completed within minutes (Goldstein et al., 2000; Munoz-Pinedo et al., 2006). However, about 85% of total cytochrome c resides within mitochondrial cristae, which are connected to the peripheral portion of the IMS by relatively narrow crista junctions, and it has been suggested that the remodeling of cristae is a required step in the release of this interior pool of cytochrome c (Scorrano et al., 2002; Scorrano and Korsmeyer, 2003).
However, the role of crista remodeling in apoptosis is controversial. In a recent study, mitochondria with grossly altered morphology were indeed observed in cultured HeLa cells undergoing apoptosis (Sun et al., 2007). However, caspase inhibitors prevented the appearance of these vesicularized mitochondria without inhibiting the release of cytochrome c (Sun et al., 2007). Thus, large-scale mitochondrial morphological alterations are secondary caspase-dependent events unnecessary for the efficient release of cytochrome c. Also, in our earlier experiments using isolated mitochondria from Xenopus eggs, we observed no large-scale changes in mitochondrial ultrastructure following treatment with cleaved Bid, which induced complete cytochrome c release (von Ahsen et al., 2000). On the other hand, genetic manipulation has produced mitochondria with altered morphology that are unable to release all of their cytochrome c (Arnoult et al., 2005; Cipolat et al., 2006; Frezza et al., 2006; Griparic et al., 2004; John et al., 2005; Lee et al., 2004). Although such mutations can lead to aberrations in mitochondrial physiology that could render their physiological relevance uncertain, the results do suggest that cytochrome c can be trapped within cristae.
Given this controversy, we set out to determine whether crista remodeling is necessary for the complete release of cytochrome c and other IMS proteins from mitochondria and, if so, whether full IMS protein release is required for apoptosis. When we incubated mitochondria with pro-apoptotic Bcl-2-family proteins, we observed neither the extensive vesicularization of mitochondria nor the widening of crista junctions seen by others (Scorrano et al., 2002). Paradoxically, we found that the diameters of crista junctions were halved, while the accessibility of cytochrome c to the outer membrane was increased. Thus, only a subtle alteration in crista junctions occurs, but is sufficient for complete cytochrome c mobilization and release.
Recent studies correlated the disassembly of Opa1 oligomers with remodeled cristae (Frezza et al., 2006). We also observed that pro-apoptotic BH3-only proteins and BH3 peptides induced the disassembly of Opa1 complexes. However, unlike the results from Scorrano and colleagues, we found that this effect required the presence of either Bak or Bax. Also, a mutant Bid with an inactive BH3 domain did not induce Opa1 disassembly, and peptides derived from the Bid and Bim BH3 domains could also induce the disruption of Opa1 complexes.
Most surprisingly, however, through two distinct approaches (pharmacological and genetic) we could uncouple Bax/Bak-dependent events in the mitochondrial interior (Opa1 complex disassembly and crista remodeling) from Bax/Bak-dependent events at the mitochondrial surface (Bak oligomerization and outer membrane permeabilization.) Finally, expression of a disassembly-resistant mutant Opa1 protein (Q297V) blocked both the full release of cytochrome c and apoptosis. Thus, activated BH3-only proteins induce, in a manner dependent on Bax/Bak, two mitochondrial events that are biochemically and spatially separate: crista junction opening (CJO) and mitochondrial outer membrane permeabilization (MOMP). Both of these events play essential roles in apoptosis.
Results
Disassembly of Opa1 complexes induced by pro-apoptotic BH3-only proteins or BH3 peptides
We incubated isolated mouse liver mitochondria with a recombinant form of Bid activated by proteolytic cleavage, N/C-Bid (von Ahsen et al., 2000; Yamaguchi et al., 2006). As expected, N/C-Bid (10 nM) induced the nearly complete release of cytochrome c in 30 minutes (Fig. 1). As the disassembly of Opa1 complexes is reported to be an indicator of remodeled cristae (Arnoult et al., 2005; Frezza et al., 2006), we examined changes in these complexes by EDC-crosslinking and immunoblotting (Fig. 1a, upper panel). A gradual but nearly complete loss of Opa1 complexes was seen, coinciding with the loss of cytochrome c (Fig. 1a, lower bands in the lower panel). As previously reported (Arnoult et al., 2005), Opa1 was released from mitochondria, at roughly the same rate as cytochrome c (Fig. 1a, lanes 5–8).
Fig. 1. Disassembly of OPA1 complexes by BH3-only proteins and their corresponding peptides.

a. N/C-Bid induced cytochrome c release and OPA1 complex disassembly, with similar kinetics. Isolated mitochondria were suspended in trehalose buffer at 5 mg/ml and incubated with 10 nM N/C-Bid for 0,10, 20 and 30 min. at 37° C. Samples were centrifuged, and pellets were either suspended right away in SDS sample buffer or treated for 45 minutes in 10 mM EDC (Pierce) in PBS at 37° C before the addition of SDS buffer. Proteins in the pellets and supernatants were separated by 4–12% polyacrylamide gradient gels and analyzed by immunoblotting using anti-OPA1, HAX1 and cytochrome c antibodies. b. Bid BH3 peptide produced similar effects. Mitochondrial samples were incubated either with 0–20 µM of BH3 peptide derived from Bid or left untreated for 30 min. c. BimS protein causes a similar disassembly of OPA1 complex, which is inhibited by Bcl-xL. Samples were treated with 10 nM N/C-Bid, 40 nM BimS, 200 nM Bcl-xLΔC, either alone or together for 30 minutes. d. OPA1 disassembly was induced by Bid and Bim BH3 peptides, but not other BH3 peptides. Samples were treated either with 10 nM Bid protein or 20 µM BH3 peptides derived from Bid, Bim, Bad or Noxa or left untreated for 30 min. e. BH3 domain of tBid is necessary for cytochrome c release and disassembly of OPA1 complex. Isolated mitochondria were treated with either 10 nM N/C Bid or its mutants G94E and M97AD98A for 10–30 min. at 37° C.
The nature of Opa1 complexes is not defined by this crosslinking experiment; however, GST pulldown experiments (Fig. 6a) and co-immunoprecipitation using Opa1 fused to two different tags (not shown), confirmed that Opa1 can self-associate, and thus these complexes may be oligomers of Opa1, as previously proposed (Frezza et al., 2006). Opa1 forms oligomers consisting of short and long isoforms (Frezza et al., 2006; Griparic et al., 2007; Song et al., 2007). There are 8 known splice variants in humans, each containing 2–3 cleavage sites for mitochondrial proteases. Our experiments here address neither which isoforms are present in these complexes nor the possibility that some isoforms may function differently in apoptosis. Nevertheless, our data, like that in a previous report (Frezza et al., 2006), show that at least some variants of Opa1 form complexes whose disassembly is correlated with cytochrome c release.
Fig. 6. Expression of Opa1-Q297V rendered 293T cells resistant to apoptosis.
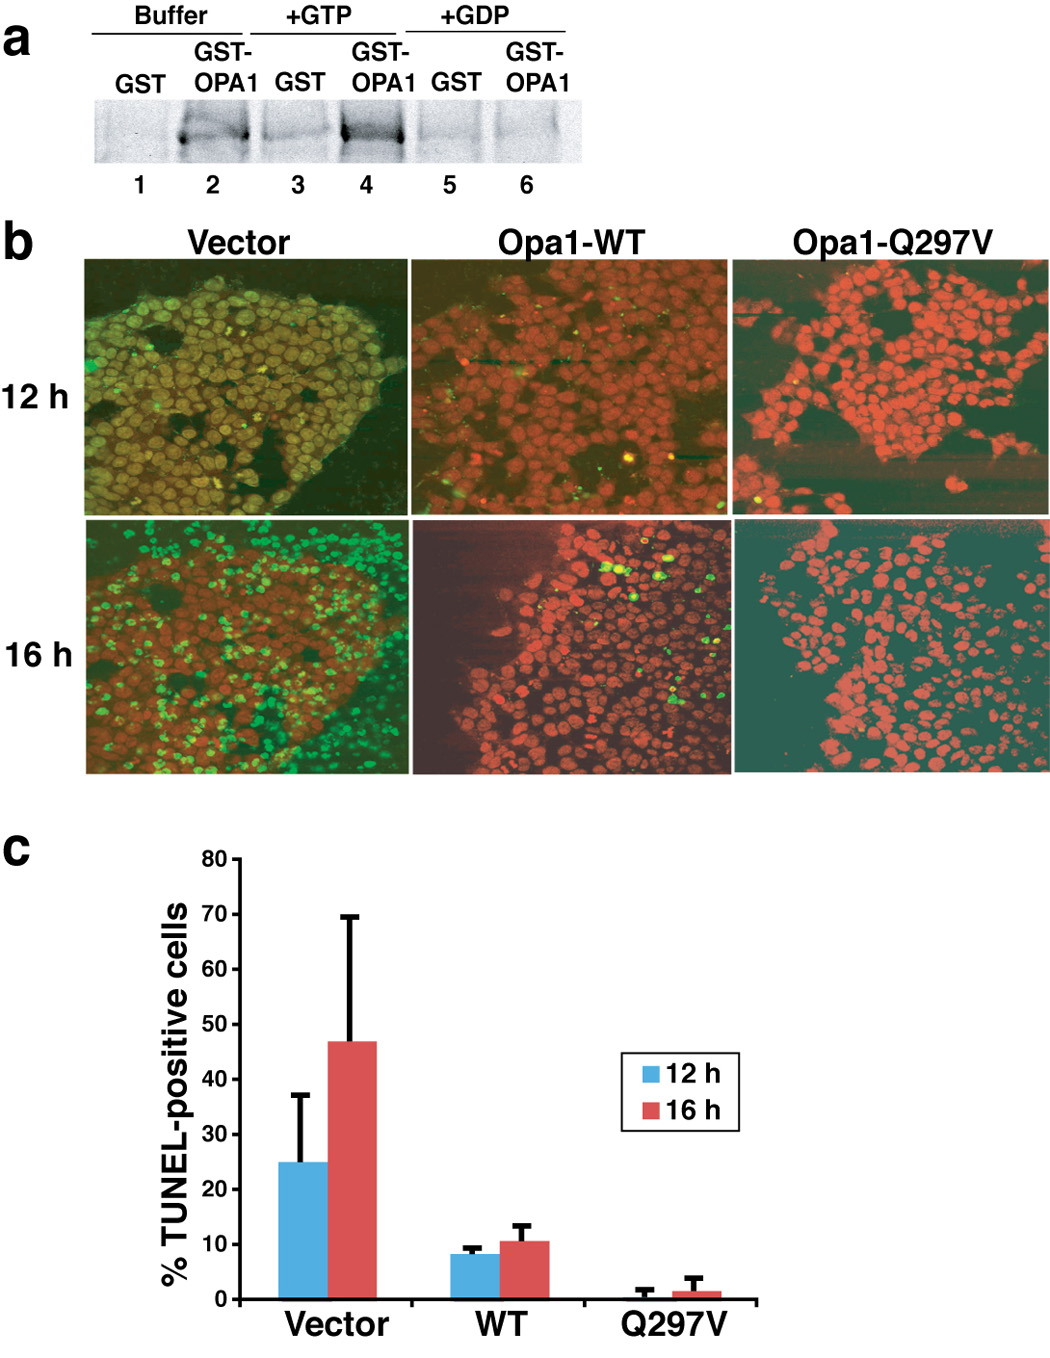
a. GTP enhanced the in vitro self-association of Opa1. E. coli expressed and purified GST and GST-Opa1 proteins (pGEX4.1-hOpa1 variant 1, NM-015560) were mixed with radiolabeled Opa1 protein in PBS buffer supplemented with 125 mM NaCl with either 2 mM GST or GDP or without, and rotated for 1 hour in the cold room. GST and GST-Opa1 proteins were pulled down by glutathione-Sepharose beads. Beads were washed twice in PBS buffer and re-suspended in SDS buffer and run on SDS-PAGE. The presence or absence of radiolabeled Opa1 was detected by autoradiography. b–d. Expression of Opa1-Q297V rendered 293T cells resistant to BimS-induced apoptosis. 293T cells were transfected with pcDNA plasmid containing either wild-type or Q297V mutant Opa1 cDNA (tagged with flag peptide in the c-terminus) or mock transfected with empty vector. After 36–40 h, apoptosis was induced by Chariot-mediated delivery of BimS protein (see Experimental Procedures). 12 and 14 h post Chariot loading, cells were fixed and assayed for TUNEL activity (green), a measure of caspase-dependent DNA fragmentation typically produced in apoptotic cells. Nuclei are stained red by propidium iodide. The experiments were repeated three times and the percentage of TUNEL positive cells are plotted in panel c.
Anti-apoptotic Bcl-2-family proteins such as Bcl-xL and Mcl1 can block cytochrome c release from isolated mitochondria through heterodimerization with their pro-apoptotic relatives (e.g., Clohessy et al., 2006; Kluck et al., 1997a; Yamaguchi et al., 2006). We found that recombinant Bcl-xL (Bcl-xLΔC) and Mcl1 blocked both cytochrome c release and the loss of Opa1 complexes (Fig. 1c, lanes 3, 4, 6, 8, 10 and 12; data not shown).
Previous studies by others (Scorrano et al., 2002) concluded that tBid induces crista remodeling through a mechanism not involving the BH3 domain of this protein and not requiring Bax and Bak. To examine the role of BH3 domains, we used peptides corresponding to BH3 domains in various proteins. The Bid BH3 peptide and N/C-Bid protein induce cytochrome c release from mouse liver mitochondria with similar kinetics (Yamaguchi et al., 2006). Bid BH3 peptide also induced a gradual loss of Opa1 complexes (Fig. 1b, upper panel, lanes 9–12), coinciding with cytochrome c release from mitochondria. A Bim BH3 peptide produced similar results, but BH3 peptides derived from Bad, Noxa, Bcl2 and Bcl-xL had no effect (Fig. 1d; data not shown).
Underscoring the requirement for a functional BH3 domain, we found that a substitution in the BH3 domain, G94E, rendered the N/C-Bid protein ineffective in inducing both cytochrome c release and Opa1 complex disassembly (Fig. 1e, lanes 2–5 and 10–13). In contrast, alanine substitution at two residues, M97 and D98, shown earlier to abrogate Mcl1 binding to Bid (Clohessy et al., 2006) had no effect on the ability of N/C-Bid to induce cytochrome c release and Opa1 complex disassembly (Fig. 1e, lanes 6–8 and 14–16). Thus the BH3 domain of N/C-Bid is necessary and sufficient for the induction of both cytochrome c release and the disassembly of Opa1 complexes, whereas an interaction of Bid with Mcl-1 is required for neither of these events.
Bak/Bax requirement for N/C-Bid-induced crista remodeling
Bax and/or Bak are required for N/C-Bid-induced cytochrome c release. However, it was reported that tBid could induce cristae remodeling in a Bax/Bak-independent manner (Scorrano et al., 2002). To examine the role of Bax/Bak, we isolated liver mitochondria from Bak- and Bax-deficient mice as well as WT and Bax/Bak double knockout (DKO) MEFs. N/C-Bid induced both cytochrome c release and Opa1 complex disassembly in mitochondria from Bax-null and WT MEFs, which are expected to contain Bak protein (Fig. 2a, c). On the other hand, with mitochondria from either Bak-null mouse liver (which contain little Bax; data not shown) or from Bax/Bax DKO MEFs, we saw neither the release of cytochrome c nor the disassembly of Opa1 complexes (Fig. 2b, d). When we treated these mitochondria with oligomerized recombinant Bax, we observed both cytochrome c release and the disassembly of Opa1 complexes (Fig. 2b, lanes 4 and 11). Taken together, our data clearly show a requirement for either Bax or Bak in Opa1 complex disassembly induced by N/C-Bid.
Fig. 2. Disassembly of OPA1 complex by BH3-only proteins required the presence of Bak or Bax.

a. N/C-Bid-induced cytochrome c release and OPA1 complex disassembly, in Bak-deficient mouse mitochondria. Isolated liver mitochondria from Bak-null mice were treated with either 10 nM N/C-Bid, 100 nM Bcl-xL or both or left untreated for 30 min at 37° C. Samples were centrifuged, and pellets were treated for 45 min in 10 mM EDC in PBS at 37° C before the addition of SDS buffer. Proteins in the pellets and supernatants were separated on 4–12% polyacrylamide gradient gels and analyzed by immunoblotting using anti-OPA1, -HAX1 and -cytochrome c antibodies. b. Recombinant oligomerized Bax induced disassembly of Opa1 complexes in Bak-deficient mitochondria. Mitochondria from Bak-null mice were incubated either with 10 nM tBid, 10 nM oligomerized Bax, 100 nM BaxΔC or left untreated, with or without 100 nM Bcl-xLΔC for 30 min. Bcl-xLΔC at this concentration is not expected to block activated Bax. c and d. Opa1 disassembly induced by Bid required Bak or Bax. Mitochondria from WT (c) or from Bax/Bak double-knockout (d) MEFs were treated with N/C-Bid, Bcl-xLΔC or both or left untreated for 30 min. at 37° C.
Disassembly of Opa1 complexes can occur in the absence of MOMP
The results above show that disassembly of Opa1 complexes was regulated by Bcl-2-family proteins in much the same way as cytochrome c release. It seemed possible that MOMP and the disassembly of Opa1 complexes were triggered together via a single mechanism. In particular, Bax and Bak mediate the formation of large pores in mitochondrial outer membranes (Kuwana et al., 2002; Martinez-Caballero et al., 2005). Could N/C-Bid, BimS, or BH3 peptides first induce the formation of these pores and then pass through them to gain access to the inner membrane and directly induce the disassembly of Opa1 complexes located at crista junctions?
To answer this question, we inhibited N/C-Bid-induced cytochrome c release from isolated mitochondria, using compounds identified in a small screen of various readily available pharmacological agents (Suppl. Table I). Three agents, dichloro-isocoumarin (DCIC; 100–200 µM), MG132 (20–100 µM) and Ucf101 (10–50 µM), all serine protease inhibitors, blocked the release of both cytochrome c and Htra2/Omi from trehalose-frozen or fresh mitochondria treated with N/C-Bid (Fig. 3; data not shown). Ucf101 required a 5–10 minute pre-incubation. All three agents also inhibited Opa1 release (Fig. 3a, upper panel, lanes 14–16) and Bak oligomerization, similar to the effect of Bcl-xLΔC (Fig. 3c and supplemental Fig. 1), arguing that the compounds acted at or upstream of the oligomerization event. ALLN, a compound structurally similar to MG132, had none of these effects (not shown).
Fig. 3. N/C-Bid-induced disassembly of the OPA1 complex in the absence of MOMP.

(a) Inhibition of cytochrome c release by three serine protease inhibitors. Mitochondria were suspended at 5 mg/ml in the trehalose buffer either with (lanes 5–8, 9–12 and 17) or without (lane 1–4 and 13–16) 10 nM N/C-Bid. Either 100 µM DCIC (lanes 2, 6, 10 and14), 25 µM MG132 (lanes 3, 7, 11 and 15), or 50 µM Ucf101 (lanes 4, 8, 12 and 16) was added to samples, followed by an incubation for 30 min at 37° C. Mitochondrial pellets were separated on 4–12% gradient gels and Western blotted with anti-Opa1 (upper panel), anti-Hax1 (middle panel) and anti-cytochrome c antibody (bottom panel). Note the altered mobility of OPA1 in lanes 2 and 6 in the upper panel. (b) Ucf101 and MG132 did not block disassembly of the OPA1 complex. Mitochondrial pellets from (a) were suspended in 10 mM EDC in PBS and incubated for 45 min at 37° C. Cross-linked samples were separated by 4–12% gradient gel and Western blotted with anti-OPA1 antibody. (c) MOMP inhibitors blocked N/C-Bid-induced Bak oligomerization. Mitochondria were treated with either 100 µM DCIC (lanes 4–6), 10 nM N/C-Bid (lanes 7–9) or both (lanes 10–12) or left untreated (lanes 1–3) for 30 minutes at 37° C. Pellets were suspended either in PBS (lanes 1, 4, 7 and 10), 10% DMSO in PBS (lanes 2, 5, 8 and 11) or 10 mM BMH (Pierce) in PBS (lanes 3, 6, 9 and 12) and incubated for 45 min at 37° C. Samples were separated by 12% SDS-PAGE and Western blotted with anti-Bak antibody. The locations of Bak, cross-linked Bak and Bak oligomer are indicated. Bcl-xL, Ucf101 and MG132 also blocked Bak oligomerization (Suppl. Fig. 1).
Surprisingly, however, neither MG132 nor Ucf101 inhibited N/C-Bid-induced Opa1 complex disassembly (Fig. 3b). Thus, these two inhibitors can dissociate the mechanisms of outer membrane permeabilization (as detected by cytochrome c release and Bak oligomerization) from the disassembly of Opa1 complexes. We conclude that the N/C-Bid-induced disassembly of Opa1 complexes is not a consequence of MOMP. Moreover, we conclude that BH3 domains do not need to gain access to the inner membrane to induce the disruption of Opa1 complexes (such access presumably requires MOMP). Rather, Opa1 disassembly seems to be a consequence of BH3 domain interactions at the outer membrane.
DCIC, like MG132 and Ucf101, blocked MOMP. However, unlike MG132 and Ucf101, DCIC produced striking effects on mitochondrial morphology (not shown). This may reflect the ability of DCIC to inhibit multiple proteases, including PARL (Urban and Wolfe, 2005). By itself DCIC altered the electrophoretic mobility of Opa1 (Fig. 3a, lane 2 and 7) and increased the fraction of Opa1 found in cross-linkable complexes, with or without N/C-Bid treatment (Fig. 3b, lanes 2 and 6). Because of these multiple effects, we were unable to draw conclusions from experiments using DCIC.
BH3 peptides induced a subtle change in crista junctions, independent of MOMP
Our data show that MG132 and Ucf101 blocked N/C-Bid-induced Bak oligomerization and cytochrome c release, but allowed Opa1 complex disassembly (Suppl. Table 2). To examine whether the amounts of Opa1 complexes were correlated with changes in mitochondrial morphology, we first used conventional thin-section EM, comparing control mitochondria with organelles treated with N/C-Bid, MG132, or a combination of N/C-Bid and MG132 (Fig. 4a). The mitochondria treated with N/C-Bid or MG132 alone displayed a mixture of condensed and orthodox morphologies similar to control mitochondria. In contrast, a subpopulation of the mitochondria treated with both N/C-Bid and MG132 contained large vacuoles (arrowheads), whose significance is unknown. Occasional untreated mitochondria also displayed this vacuolated morphology, which appeared similar to that caused by expansion of the intracristal space (Jaarsma, 2006). Otherwise, gross mitochondrial morphology was unaffected, and mitochondrial size varied little among the 4 groups.
Fig. 4. Crista junction remodeling induced by a BH3 domain peptide was not blocked by MG132.

Isolated mitochondria were suspended in trehalose buffer at 5 mg/ml and incubated for 15 min at 37° C in the presence of 20 µM Bid BH3 peptide, 100 µM MG132, both agents, or no addition. a. Bid BH3 peptide did not induce gross mitochondrial remodeling. Mitochondrial pellets were analyzed by transmission electron microscopy. Note that mitochondria treated with both the BH3 peptide and MG132 often contained large vacuoles, but otherwise showed no remodeling of cristae. b. Electron tomographic images of crista junctions in untreated mitochondria and mitochondria treated with BH3 + MG132. The volumes were segmented and surface-rendered. The inner boundary membrane for two conditions (untreated and MG132+N/C-Bid) is shown in side view. Note the size difference in crista junction openings. c, d. Crista junction sizes were reduced by treatment with BH3 peptide, and this was unaffected by MG132. c. The graph represents mean and standard deviation of cristae junction sizes from untreated (sample 1–6), BH3-treated (samples 7–11), BH3+MG132-treated (samples 12–17) and MG132-treated (samples 18–24) mitochondria. Scales in nm. d. The average of cristae junction sizes from 4 different groups of mitochondria above were analyzed and presented. Error bars represent standard deviation. e. N/C-Bid increased cytochrome c accessibility to the outer membrane, and MG132 failed to inhibit this increase. The rate of NADH oxidation in the presence of complex I and II inhibitors were measured for mitochondria treated either with MG132, N/C-Bid, or both, or left untreated. The y-axis represents the rate of NADH loss calculated as % of input per 10 s.
Because crista junctions are not easily visualized in traditional thin sections, we used EM tomography to reconstruct and analyze mitochondrial shapes in 3D (Suppl. Movie 1–Suppl. Movie 3). Bid BH3 peptide caused no gross effect on mitochondrial architecture, but did produce a two-fold reduction in crista junction diameters (Fig. 4b, c), from ~ 16 +/− 1 nm to ~ 8.7 +/− 1.0 nm with BH3 peptide only, and 9.1 +/− 0.2 nm for BH3 peptide + MG132). Within each treatment condition, condensed and orthodox mitochondria had similar crista junction sizes.
Thus, BH3 peptide did not change mitochondrial diameter or gross morphology, but caused a more subtle effect: crista junction narrowing. This effect was correlated with Opa1 complex disassembly (Fig. 1d, lanes 3 & 4). In view of a recent report showing that large-scale changes in mitochondrial morphology are caspase-dependent late events in apoptosis (Sun et al., 2007), we note that caspases were absent in our in vitro experiments, and caspase inhibitors had no effect (data not shown). Thus, the subtle morphological changes we observed are unrelated to these extensive caspase-dependent alterations.
Narrower crista junctions allow greater mobilization of cytochrome c
As the treatment of mitochondria with BH3 peptide or N/C-Bid efficiently released cytochrome c from intracristal spaces, we considered whether narrower crista junctions with disassembled Opa1 complexes might paradoxically be in an "open" state in which cytochrome c and other proteins can exit intracristal spaces freely, whereas wider crista junctions containing intact Opa1 complexes might be in a "closed" state in which the exit of proteins from intracristal spaces is limited. To test this possibility, we assayed the activity of an outer membrane protein, cytochrome b5-NADH dehydrogenase, which oxidizes exogenous NADH. The availability of cytochrome c in the intermembrane space to interact with cytochrome b5 is rate limiting for this reaction. Respiratory complexes I and II can also oxidize NADH, and to block this confounding effect we added inhibitors of these complexes. Under these conditions, isolated mitochondria can process only a small amount of exogenously added NADH via cytochrome b5 (Fig. 4e). Compared to the control, mitochondria pre-treated with N/C-Bid (in a low ionic-strength buffer that retains cytochrome c in the mitochondria) displayed a rate of NADH oxidation nearly 4-fold greater, suggesting that N/C-Bid increased the accessibility of cytochrome c to cytochrome b5. Mitochondria pre-treated with a combination of N/C-Bid and MG132 also showed a robust reaction, while the rate of NADH oxidation in mitochondria pre-treated with MG132 alone remained roughly the same as that of untreated mitochondria. We conclude that wider crista junctions, with complexed Opa1, are in a functionally closed state (i.e., limiting access of cytochrome c to the outer membrane), while narrower junctions, with disassembled Opa1, are in an open state (allowing increased availability of cytochrome c at the outer membrane).
In summary (Suppl. Table 3), BH3-only proteins and BH3-domain peptides induced Bak oligomerization, Opa1 complex disassembly, narrowing of crista junctions, and increased availability of cytochrome c at the outer membrane. MG132 and Ucf101 inhibited Bak oligomerization without affecting Opa1 complex disassembly and crista junction narrowing. Taken together, our data show that crista remodeling is not a consequence of Bak oligomerization and mitochondrial outer membrane permeabilization (MOMP). Instead, a pathway independent of MOMP exists that disassembles Opa1 complexes and remodels crista junctions in a subtle manner.
Uncoupling of MOMP and Opa1 complex disassembly in cultured cells expressing activated BimS
Next we asked whether MOMP could be uncoupled from Opa1 disassembly in cultured cells. We used 293T cells stably transfected with BimS-ERtm, a fusion of BimS with a tamoxifen-activatable domain of the estrogen receptor. In these cells MOMP can be induced directly, without the side effects that usually accompany apoptosis induced by various cell stresses (Lartigue et al., in preparation). When 4-hydroxytamoxifen (4-OHT) is added to the culture medium, the BimS-ERtm fusion protein is activated, and many of the cells die via the Bax/Bak-dependent mitochondrial ("intrinsic") pathway. To aid the analysis of early mitochondrial effects, we pre-treated the cells with a caspase inhibitor, zVAD-(Ome)-fmk, which does not block cytochrome c release but inhibits downstream apoptotic events (Bossy-Wetzel et al., 1998; Kluck et al., 1997a). Addition of 4-OHT (1 µM) induced cytochrome c release in ~33% of the cells by 8 h. The further addition of MG132 reduced this percentage to less than 10% (Fig. 5a, c). Nevertheless, Opa1 complex disassembly still occurred (Fig. 5b). Control experiments showed that the inhibition of cytochrome c release seen with MG132 was not an indirect result of proteasome inhibition: lower concentrations of MG132 and MG115 that are sufficient to inhibit proteasomes were unable to inhibit cytochrome c release substantially (Fig. 5c). These results confirm in whole cells our results above with isolated mitochondria, showing that a BH3-only protein can induce Opa1 disassembly even if MOMP is blocked.
Fig. 5. MG132 protected against mitochondrial permeabilization in cells.

293T cells expressing GFP/BimS-ER were pre-incubated for 1 h with 100 µM of zVAD-(Ome)-fmk and/or 10 min with 100 µM of MG132, prior to the addition of 1 µM of 4-OHT. After an incubation of 8 h at 37° C, cells were fixed and stained for cytochrome c. a. MG132 inhibited cytochrome c release. Confocal images were acquired using Lasersharp 2000 software. Arrowheads highlight cells in which cytochrome c has been released from mitochondria. b. MG132 did not inhibit loss of Opa1 complexes. Mitochondria from the samples treated as above were cross-linked with EDC and Western blotted with antibodies against OPA1, Hax 1 and cytochrome c. For blots with Mcl1, total cell lysates were used. c. MG132 inhibited cytochrome c release at high concentrations, but not at lower concentrations that still inhibit proteasomal protein degradation. The percentage of cells with released (diffuse) cytochrome c was determined by cell counts. The experiments were performed in triplicate. Inhibitors used are indicated at the bottom of the graph.
Expression of a disassembly-resistant Opa1 mutant blocked cytochrome c release and apoptosis but not Bax activation
The studies above showed that crista junction narrowing was correlated with the disassembly of Opa1 complexes, suggesting that Opa1 self-assembly might control the “open” and “closed” states of crista junctions. Indeed, a correlation between Opa1 disassembly and changes in the organization of cristae was observed earlier by others (Frezza et al., 2006). However, these studies were based on the overexpression of WT Opa1 as compared with conditions of Opa1 loss of function, and thus the evidence for a causal role of Opa1 remained only circumstantial.
To show more conclusively a requirement for Opa1 in crista junction opening (CJO), we sought a “gain of function” mutation in Opa1 that is resistant to disassembly (i.e. perhaps forming constitutive complexes). If Opa1 disassembly is indeed required for CJO, we predicted that such a mutant would prevent CJO and thus block the full release of cytochrome c. To assay self-binding in vitro, we mixed bacterially expressed purified GST-Opa1 with radiolabeled Opa1 protein translated in rabbit reticulocyte lysate and used glutathione beads to isolate GST-containing complexes. We found that GST-Opa1 did indeed pull down radiolabeled Opa1 (Fig. 6, lane 2), whereas GST alone did not. Thus, the two forms of Opa1 formed a complex. As Opa1 has a GTP-binding domain, we considered the possibility that GTP regulates Opa1 self-assembly. Indeed, the addition of 1 mM GTP enhanced self-binding of Opa1 (compare lanes 2 and 4), whereas 1 mM GDP completely blocked complex formation (lane 6). Thus GTP promoted in vitro assembly of Opa1, whereas GDP favored the dissociated state. Incidentally, we note that N/C-Bid added at a 20-fold excess over GST-Opa1 had no effect on Opa1 complex formation in vitro (data not shown). Thus, N/C-Bid by itself appears unable to affect Opa1 assembly through direct interactions in vitro, consistent with our finding that N/C-Bid promotes Opa1 disassembly and CJO in the absence of MOMP, through a mechanism requiring Bax/Bak.
We used this in vitro self-binding assay to search for a disassembly-resistant mutant of Opa1 (Suppl. Fig. 6). Out of twelve point mutations in or near the GTP-binding domain, we identified one, Q297V (within the GTP-binding domain), that conferred enhanced binding of the mutant protein to itself and to WT Opa1. These results are consistent with a previous prediction that the Q297V mutant should mimic the GTP-bound form of Opa1 (Misaka et al., 2002).
To test the effect of this mutant on CJO, we transfected 293T cells with either WT or Q297V Opa1 cDNA. Transfection efficiency was high (typically over 85% of the cells expressed exogenous protein; see Suppl. Fig. 2), but expression levels were modest: immunoblots showed similar amounts of exogenous and endogenous Opa1 proteins (data not shown). At 36–40 h post-transfection, we induced “intrinsic” (mitochondria-mediated) cell death by delivering recombinant BimS protein to the cells. We analyzed the cells later by TUNEL staining, which measures double-strand DNA fragmentation, a late apoptotic event.
As expected, BimS was markedly cytotoxic in untransfected 293T cells, producing 25.5% and 40.72% TUNEL-positive cells at 12 and 16 h (Fig. 6b and c). Strikingly, transfection with Opa1 Q297V, despite the modest expression level, potently prevented apoptosis (only 0.8% and 1.8% apoptotic cells were observed at 12 and 16 h.) This is consistent with the hypothesis that the Q297V mutant inhibits disruption of Opa1 complexes, thus blocking cytochrome c release, caspase activation, and apoptosis. Possibly, Opa1-Q297V acts in a dominant manner. Consistent with an earlier report (Frezza et al., 2006), 293T cells transfected with WT Opa1 were also somewhat protected from BimS-induced apoptosis; 8.6% and 11.0% TUNEL positive cells were observed at 12 and 16 h. We surmise that a modest increase of WT Opa1 levels can stabilize intramitochondrial Opa1 complexes to some extent, but not as effectively as the Q297V mutant.
To verify that Opa1-Q297V did not act upstream of MOMP, we measured Bax activation by staining cells with a Bax-conformation-dependent monoclonal antibody, 6A7. In 293T cells either untransfected or transfected with Opa1-Q297V, we saw very little 6A7 signal, as expected (Fig. 7a, upper panels). However, when the cells were loaded with BimS in the presence of Q-VD, over 90% showed mitochondrial activated Bax, regardless of whether WT or mutant Opa1 had been expressed (Fig. 7a, lower panels). Bax activation following BimS delivery was rapid; by 4 h, over 90% of the cells contained activated Bax, and the intensity of the 6A7 fluorescent signal increased further at 8 and 12 h (Suppl. Fig. 4 and Suppl. Fig. 5). In contrast, Opa1-Q297V expression markedly inhibited apoptosis in the same experiment (Fig. 7b): only 1.2% of cells expressing Q297V were TUNEL-positive, compared to 18.8% for untransfected cells. (Control cells transfected with vector alone or EGFP cDNA behaved like untransfected cells in these assays; Suppl. Fig. 3–Suppl. Fig. 5). Thus, the expression of Opa1-Q297V did not block BimS-induced activation of Bax, but nevertheless inhibited apoptosis profoundly.
Fig. 7. Opa1-Q297V inhibited apoptosis but not Bax activation.

a. Bax was activated by Chariot-delivered BimS in 293T cells. 293T cells transfected with pcDNA-Opa1-Q297V (right panels) or untransfected (left panels) were Chariot-loaded with BimS protein in the presence of caspase inhibitor Q-VD for 12 h (lower panels) or left untreated (upper panels). Cells were fixed and stained for nuclei (propidium iodide; red) or activated Bax (6A7 antibody; green) as described in Experimental Procedures. b. Expression of Opa1-Q297V inhibited apoptosis. Cells were treated as in panel a., except that the caspase inhibitor Q-VD was omitted. Cells were fixed after 12 h post Chariot-BimS treatment and TUNEL-stained as in Fig. 6. 18.81% of untransfected cells and 1.19% of transfected cells were TUNEL positive at this time. c. Expression of Opa1-Q297V caused the retention of Opa1 complexes and IMS proteins in mitochondria following BimS treatment. Cells were loaded with BimS and incubated for 24 h in the presence of Q-VD, and the heavy membrane fraction containing mitochondria was isolated and treated with EDC. Samples were Western blotted using antibodies to the indicated proteins.
As predicted, expression of the Opa1-Q297V mutant hindered disassembly of Opa1 complexes (Fig. 7c), consistent with the supposition that this mutant mimics the GTP-bound state, favoring constitutive self-assembly. Importantly, mitochondria in these cells retained most of their cytochrome c, Omi/Htra2 and Smac/DIABLO (Fig. 7c), thus confirming that the expression of this mutant blocks apoptosis by inhibiting the release of mitochondrial proteins, despite Bax activation (Fig. 7a). Lastly, the expression of Opa1-Q297V also protected 293T cells from staurosporine- and okadaic acid-induced cell death (Suppl. Fig. 3 and data not shown).
Discussion
We can infer the existence of a pathway in which protein interactions at the mitochondrial outer membrane induce an event at the inner membrane: crista junction opening (CJO). CJO is required for cytochrome c release and apoptosis. Unlike a more extensive form of cristae remodeling reported earlier (Scorrano et al., 2002), initiation of this CJO pathway requires a functional BH3 domain in a BH3-only protein, as well as the presence of Bax and/or Bak. Thus, induction of CJO occurs under the same circumstances that trigger Bax/Bak-dependent mitochondrial outer membrane permeabilization (MOMP). Surprisingly, however, CJO and MOMP involve different effector mechanisms, as we uncoupled these events using two independent and complementary approaches. First, the pharmacological blockade of Bak oligomerization and MOMP prevented cytochrome c release, but did not affect CJO and the mobilization of cytochrome c within mitochondria. Second, the expression of a mutant Opa1 (Q297V) stabilized Opa1 complexes and blocked cytochrome c release and apoptosis, but did not prevent Bax activation. Thus, proapoptotic Bcl-2-family proteins induce two separable mitochondrial events, one in the outer membrane, and one in the inner membrane, both required for apoptosis.
Other authors previously correlated large-scale alterations in mitochondrial cristae, as well as the mobilization of cytochrome c, with the disassembly of Opa1 complexes (Frezza et al., 2006). We also observed that CJO induced by BH3-only proteins or BH3 peptides was accompanied by the disruption of Opa1 complexes. However, using EM tomography, we did not observe any gross morphological changes in mitochondrial cristae, but rather observed a ~ 2-fold reduction in the diameters of crista junctions. Paradoxically, under these conditions cytochrome c became more accessible to the outer membrane (Fig. 4e). However, it should be noted that even the smaller diameter (~8.5 nm) is much larger than cytochrome c. Indeed, measurements of channel sizes using patch-clamp techniques show that 8.5 nm membrane pores should allow the passage of 71–100 kDa proteins (Dejean et al., 2005; Kinnally and Antonsson, 2007; Martinez-Caballero et al., 2005).
It is unclear why our morphological results differed from some earlier reports (Frezza et al., 2006; Scorrano et al., 2002). The morphological changes induced by BH3-only proteins in isolated mitochondria could well be buffer-dependent, perhaps driven by osmotic forces. However, we found that the concomitant changes in Opa1 complexes and cytochrome c mobilization were similar, regardless of whether we used our buffer or the one employed by Scorrano and colleagues (not shown). Thus, the shapes of cristae observed with isolated mitochondria may not reliably indicate crista junction opening.
Nevertheless, our morphological observations are consistent with a recent report (Sun et al., 2007) which showed that gross changes in mitochondrial architecture occurred in apoptotic cells as a late caspase-dependent event, but were unnecessary for cytochrome c release. That study left open the possibility that cytochrome c release could require more subtle caspase-independent changes in mitochondrial structure, such as the ones we have observed. Our studies with HeLa and 293T cells expressing switchable BimS-ERtm showed that, even when caspases were inhibited by the inhibitor zVAD, BimS activation induced Opa1 release from mitochondria and the disassembly of Opa1 complexes (Fig. 5). Similarly, crista junction narrowing and the release and disassembly of Opa1 complexes occurred in isolated mouse liver mitochondria incubated with N/C-Bid, BimS or BH3 peptides, in the absence of cytosolic caspases. Thus, Opa1 complex disassembly and release from mitochondria, as well as crista junction narrowing, are caspase-independent events, and presumably distinct from the gross caspase-dependent crista rearrangements described by Sun et al. as late apoptotic events.
Our studies have identified three serine protease inhibitors that can inhibit MOMP and Bak oligomerization. The target of these inhibitors is yet to be identified. Experiments using outer membrane vesicles (OMVs) prepared from Xenopus egg mitochondria (Kuwana et al., 2002) showed that Ucf101 and DCIC both inhibited N/C-Bid-induced MOMP (unpublished data). This suggests that the inhibitors act on at least one conserved target present in the outer membrane, possibly a serine protease. Perhaps such an enzyme could promote Bax/Bak-dependent MOMP by degrading an inhibitor of MOMP present in the outer membrane. Regardless of mechanism, the effect of these compounds has allowed us to conclude that events in the mitochondrial interior can be triggered at the outer membrane by BH3-only proteins, via Bax/Bak, even in the absence of Bax/Bak-dependent pore formation in the outer membrane. Complementary experiments in which an Opa1 mutant (Q297V) that displays enhanced self-association was expressed in cells showed that this mutant did not block Bax activation, but did block Opa1 complex disruption, cytochrome c release, and apoptosis. This again argues that Bax activation (presumably leading to MOMP) and Opa1 complex disassembly can be experimentally uncoupled and thus are likely independent processes.
Discovering the precise molecular mechanism governing Bid-induced crista junction remodeling will require further investigation, perhaps including the identification of Opa1-binding proteins, located at the inner membrane or in the intermembrane space. We also hypothesize that Bak and Bax can interact with a protein or proteins in the outer mitochondrial membrane that can promote the disassembly of Opa1 complexes in a manner dependent on the presence of active BH3-only proteins but independent of Bax/Bak oligomerization and MOMP. Components of the mitochondrial dynamics (fission/fusion) machinery, for example, may be involved in conveying this signal across the intermembrane space, by a mechanism still to be elucidated.
Certain loss-of-function mutants of Opa1 such as K301A or T302N were reported to have reduced GTPase activity, presumably because of reduced GTP binding (Griparic et al., 2004; Misaka et al., 2002). The Q297V mutant does not bind GTP and exhibits no GTPase activity (not shown) and in that sense also exhibits a loss of function. However, in another sense, the Q297V mutant displays a gain of function, as it stabilizes Opa1 complexes. As previously proposed, it may mimic the GTP-bound form of Opa1 (Misaka et al., 2002), and as our data show that GTP favors Opa1 self-association (Fig. 6a), this mutant would be predicted to form constitutive complexes that keep crista junctions closed. As a result, most cytochrome c and Smac/DIABLO would be trapped in cristae, unable to induce caspase activation and apoptosis. This is indeed what we observed (Fig. 7). As previously reported (Frezza et al., 2006; Lee et al., 2004), we also observed a partial protective effect of two-fold overexpression of WT Opa1, perhaps because modestly increasing the abundance of WT Opa1 may also stabilize Opa1 complexes and inhibit CJO to some extent. However, the expression of Opa1-Q297V caused a much more profound protection from apoptosis, arguably due to its enhanced self-binding.
Some 85% of cytochrome c and Smac/DIABLO resides within cristae. If the MOM is permeabilized, the other 15% of total cytochrome c and Smac present in the peripheral IMS should be released. However, our experiments show that this peripheral cytochrome c and Smac/DIABLO is insufficient to activate caspases and produce apoptosis. This is consistent with a previous study (Khodjakov et al., 2004) in which laser irradiation was used to rupture up to 15% of neuronal cell mitochondria, presumably releasing a similar percentage of the total mitochondrial cytochrome c and Smac/DIABLO. This treatment was not sufficient to induce apoptosis, arguing that subthreshold levels of IMS proteins are unable to activate the Caspase-9 cascade. Furthermore, these authors found that, in order to induce caspase activation, it was necessary to microinject an amount of cytochrome c close to the entire endogenous cellular content. We also observed a threshold effect in our earlier biochemical studies: cytochrome c added at 100–120 nM to Xenopus egg extracts induced rapid caspase activation, whereas 20 nM was ineffectual (Kluck et al., 1997b). Thus, a mere 5- or 6-fold reduction in cytochrome c concentration can cause a complete loss of caspase activation.
Of course, the content of cytochrome c or Smac in mitochondria can be upregulated under some culture conditions, and the proportions of these proteins in the peripheral IMS relative to the cristae might also differ by cell type. Moreover, concentrations of apoptosome inhibitors such as XIAP could also vary, in effect raising or lowering the threshold amounts of cytochrome c and Smac/DIABLO needed to activate caspase-9. Thus, in certain settings the pools of cytochrome c and Smac in the peripheral IMS might be sufficient to activate Caspase-9, and in such cases apoptosis might not depend on Opa1-mediated crista junction opening.
Aside from caspase-9 activation, there is also a potentially important mitochondrial consequence of the retention of cytochrome c in cristae. Previous reports have shown that most cell types undergoing MOMP in the absence of caspase activation do not display typical features of apoptosis, but nevertheless undergo a complete loss of clonogenic survival (e.g., Colell et al., 2007; Scott et al., 2004). In other studies (Lartigue et al., in preparation) we have shown that caspase-independent death following MOMP is delayed by about two rounds of cell division, and does not result from the release of other cytotoxic mitochondrial factors that act in a caspase-independent manner. Rather, the cause of death is a slow loss of mitochondrial bioenergetic function and a consequent decline in cellular ATP content. However, the present study shows that cells expressing Opa1-Q297V can retain cytochrome c in the mitochondrial cristae despite MOMP. Cells retaining IMS proteins in the cristae might be able to maintain bioenergetic function and perhaps even proliferate, despite Bax/Bak activation and MOMP.
Thus, there are apparently two reasons for the intrinsic cell death program to ensure that Opa1 complexes are disrupted and crista junctions become opened: first, a sufficient cytoplasmic concentration of cytochrome c is needed to activate caspases; and second, if for some reason caspases cannot be activated, cytochrome c and other proteins must be depleted from the cristae to ensure that essential metabolic functions are irreparably lost. To test this second idea, we tried to obtain stable transfectants expressing Opa1-Q297V, but were unsuccessful. Probably the expression of Q297V interferes somehow with the normal function of WT Opa1, e.g. in mitochondrial fusion, fission or respiration. Nevertheless, there may exist an apoptosis-specific upstream modulator of Opa1 self-association that can be manipulated without affecting the function of Opa1 in normal cells. Such a molecule could be a potential therapeutic target for the management of cell survival and death in diseases involving aberrant apoptosis.
Experimental Procedures
Isolation and storage of mitochondria
Mouse liver mitochondria were prepared as described (Yamaguchi et al., 2006). We performed most of the initial experiments using trehalose-frozen mitochondria. The experiments presented here were repeated using freshly isolated mitochondria, with identical results. Mitochondria were prepared from tissue culture cells as previously described (Kluck et al., 2000). The amount of Opa1 complexes observed in cultured cell mitochondria was higher than in mouse liver mitochondria. We were unable to determine if this difference was due to different isolation procedures or represents a real difference in the amounts of oligomerized Opa1.
Bax expression and purification
Expression of Bax was as described previously [Suzuki, 2000 #63] with minor modifications. Expression of chitin-conjugated Bax from pTY-Bax was induced in e coli BL21 with 0.4 mM IPTG for only 1 hour at 30° C. The E. coli pellet was pelleted and resuspended in buffer containing 20 mM HEPES pH 8.0, 500 mM NaCl and 0.1 mM EDTA, and sonicated extensively. Lysates were applied to a chitin bead column pre-equilibrated with the buffer. The column was washed extensively and chitin-Bax fusion protein was self-cleaved by overnight incubation with DTT according to the manufacturer’s instructions (New England BioLabs). Eluted protein was dialyzed in PBS containing 500 mM NaCl. When protein was concentrated to 5 mg/ml by ultrafiltration (Ultrafree-MC by Amicon), oligomers formed spontaneously (data not shown).
Mitochondrial protein release assays
Isolated mitochondria were washed in AT buffer containing 80 mM KCl and resuspended in the same buffer at approximately 5 mg/ml. The samples were supplemented with ATP regenerating system (5mM succinate, 2mM ATP, 10 mM phosphocreatine and 10 mg/ml creatine kinase) and the indicated reagents. It is important that the volume of reagents added to the sample do not exceed more than 1% of the total volume. Samples were incubated at 37° C for the indicated period before centrifugation at 5,800-x g for 5 min to separate mitochondria from released proteins. For western blotting, we used the following antibodies: anti-Opa1 (Cat. 612607), anti-cytochrome c (Cat. 556433), anti-HAX-1 (Cat. 610824) from BD transduction Laboratories; anti-Htra2/Omi (AF1458) from R&D Systems; anti-Bak (sc-832) from Santa Cruz; rabbit anti-Smac/DIABLO (Cat 567365) from Calbiochem; and rabbit anti-mouse Mcl1 from Rockland.
Electron Microscopy
Pelleted mitochondria were fixed with a 37° C solution of 2% paraformaldehyde, 2.5% glutaraldehyde (Ted Pella) in 0.15 M sodium cacodylate (pH 7.4), and then incubated for an additional 30 minutes on ice. Fixed samples were then rinsed 3 times for 3 minutes each with 0.15 M sodium cacodylate plus 3 mM calcium chloride (pH 7.4) on ice, post-fixed with 1% osmium tetroxide, 0.8% potassium ferrocyanide, 3 mM calcium chloride in 0.15 M sodium cacodylate (pH 7.4) for 60 minutes, and then washed 3 times for 3 minutes with ice-cold distilled water. The samples were stained overnight with 2% uranyl acetate at 4°C, dehydrated in graded ethanol baths, and embedded in Durcupan ACM resin (Fluka). Ultrathin (70 nm) sections were post-stained with uranyl acetate and lead salts and evaluated using a JEOL 1200FX TEM operated at 80kV. Images were recorded on film at 6,000-fold magnification. The negatives were digitized at 1800 dpi using a Nikon CoolScan system, giving an image size of 4033 ×6010 pixel array and a pixel resolution of 2.36 nm.
As is typical for isolated mitochondria, the untreated organelles ranged from condensed to orthodox configurations, the majority being condensed. The condensed mitochondria had a dark (condensed) matrix, enlarged intracristal spaces, and an inner boundary membrane at places separated from the outer membrane. In contrast, orthodox mitochondria, those most often seen in situ, had a much lighter matrix, much smaller intracristal spaces, and an inner boundary membrane in close apposition to the outer membrane along the entire periphery. With the orthodox mitochondria, the crista width was about the same as the crista junction opening. With the condensed mitochondria, however, the crista width was much greater. The cristae appeared narrow at the periphery, like the mouth of a balloon then expanded to a much greater size in the mitochondrial interior.
Electron microscope tomography
Sections from the embedded mitochondria samples were cut at thicknesses of nominally 500 nm. Sections were then stained 30 min in 2% aqueous uranyl acetate, followed by 15 min in lead salts. Fiducial cues consisting of 15 and 20 nm colloidal gold particles were deposited on opposite sides of the section. For each reconstruction, a series of images at regular tilt increments was collected with a JEOL 4000EX intermediate-voltage electron microscope operated at 400 kV. The specimens were irradiated before initiating a tilt series in order to limit anisotropic specimen thinning during image collection. Tilt series were recorded on film at 20,000-fold magnification with an angular increment of 2° from −60° to +60° about an axis perpendicular to the optical axis of the microscope using a computer-controlled goniometer to increment accurately the angular steps. The illumination was held to near parallel beam conditions and optical density maintained constant by varying the exposure time. The negatives were digitized with a Nikon CoolScan at 1800 dpi producing images of size 4033 × 6010 pixels. The pixel resolution was 0.707 nm. The IMOD package was used for rough alignment with the fine alignment and reconstruction performed using the TxBR package. Volume segmentation was performed by manual tracing in the planes of highest resolution with the program Xvoxtrace. The mitochondrial reconstructions were visualized using Analyze (Mayo Foundation, Rochester, MN) or the surface-rendering graphics of Synu (National Center for Microscopy and Imaging Research, San Diego, CA). These programs allow one to step through slices of the reconstruction in any orientation and to track or model features of interest in three dimensions. Measurements of structural features were made within segmented volumes by the programs Synuarea and Synuvolume (National Center for Microscopy and Imaging Research). Movies of surface-rendered volumes and slices through the reconstructions were made using Amira.
Cytochrome b5-NADH Dehydrogenase Assay
Mitochondria were incubated with added buffer, N/C-Bid, MG132, or both at 37° C for 12 min in AT buffer containing 10 mM KCl and centrifuged at 5200-x g for 6 min. We note that at 10 mM KCl, nearly all the released cytochrome c remained with the pellet in N/C-Bid-treated mitochondria. Pre-treated mitochondria (1 mg/ml) were incubated in assay buffer containing 150 mM KCl, 10 mM HEPES, pH 7.4, 1 mM Pi, 5 mM glutamate, 2.5 mM malate and 10 µM NADH with complex I and II inhibitors ( 2 µM CCCP, 10 µM rotenone, and 5 µM antimycin A), and NADH concentrations were measured for 60 sec using λex =355 and λem = 455. The percent decrease per 10 sec was calculated and represented in the graph. We saw little change when a 2-fold greater amount of inhibitors were added, confirming that we used saturating amount of inhibitor. When KCN, known to inhibit cytochrome c oxidase activity, was added to the each reaction at 125 mM, the rates dropped below 2% in all cases, confirming that the assay was specific for cytochrome c-dependent NADH dehydrogenase activity.
BimS-ER™ expressing cells, immunofluorescence and confocal microscopy
293T cells stably transfected with pIres2 EGFP BimS-ER™ (Lartigue et al., in preparation) were seeded in four-well Lab-Tek™ II Chambered cover glass slides 24 h prior to the addition of zVAD-(Ome)-fmk (stock solution, 100 mM, MP Biomedicals), along with MG132 (stock solution, 100 mM, EMD Biosciences) and 4-hydroxytamoxifen (stock solution, 1 mM, Sigma) at concentrations indicated in the figure legend. Eight h after the different treatments, cells were fixed in 3.7% formaldehyde for 20 min, washed in PBS and permeabilized with 0.5% Triton X-100. Non-specific binding was blocked by incubating cells in 0.2% gelatin/PBS for 30 min. Staining was performed using a primary antibody against cytochrome c (clone 6H2.B4, BD Pharmingen) and a fluorescent secondary antibody conjugate, goat anti-mouse IgG, AlexaFluor 568 (Molecular Probes). Images were acquired using a Nikon Eclipse TE 300 microscope coupled to a Bio-Rad MRC 1024 confocal head and a 15 mW krypton/argon laser unit. Cytochrome c intracellular localization was detected by using a 568-nm excitation line from the laser attenuated at 95% and a 605DF32 emission filter. Images were taken with a 40X oil-immersion objective and acquired using Lasersharp 2000 software (Bio-Rad). For each experiment (n=3), at least 500 cells were counted for each sample.
We note here that treatment of cells with MG132 at 100 µM has multiple potential effects, including cell cycle arrest via inhibition of ubiquitin-mediated proteasomal degradation. In cells defective in the G1/S checkpoint, including the 293T cells used here, MG132 causes an arrest in mid-M phase at the anaphase/metaphase transition point. Indeed, even though treatment with MG132 lasted only 8 h, it caused some cells to round up with condensed chromatin and float (Yamaguchi et al., 1997). Because these cells were not easily fixed for immunostaining, they were excluded from analysis.
Chariot-based delivery of BimS, detection of activated Bax, and TUNEL Assay
293T cells were plated at near confluence in 6 cm dishes and transfected with 10–16 µg of pcDNA-Opa1-flag WT or mutant (human Opa1 variant 1; NM-015560) with Lipofectamine (Invitrogen) according to the manufacturer’s protocol. At 36–40 h after the transfection, cells were washed, trypsinized and replated in 8-chamber slides pre-coated with 1 mg/ml of fibronectin. 6–12 h later, 3 µg per chamber of BimS protein was delivered with the Chariot reagent (Active Motif) according to the manufacturer’s instructions. Cells were incubated with or without 20 µM Q-VD. 12–16 h later, cells were fixed in 3.7% formaldehyde at 37° C for 1 h. The TUNEL assay (Apo-Direct Kit, EMD Bioscience) was performed according to the manufacturer’s instructions. For detection of activated Bax, cells fixed in formaldehyde were permeabilized with 0.5% TX-100 in PBS for 5 min, followed by 0.5% Tween 20 in PBS for 5 min, both at room temperature. Samples were washed three times in PBS and incubated in 0.2% gelatin in PBS for 30 min. at room temperature. Samples were then incubated with 4 µg/ml of anti-activated Bax antibody (MAB4601, Chemicon) in 0.2% gelatin in PBS for overnight at room temperature. Secondary antibody treatment was as described above.
Supplementary Material
Supplementary Figure 1. MOMP inhibitors blocked N/C-Bid-induced Bak oligomerization. (a) DCIC blocked Bak oligomerization. Mitochondria were treated with either 100 µM DCIC (lanes 4–6), 10 nM N/C-Bid (lanes 7–9) or both (lanes 10–12) or left untreated (lanes 1–3) for 30 minutes at 37° C. Pellets were suspended either in PBS (lanes 1, 4, 7 and 10), 10% DMSO in PBS (lanes 2, 5, 8 and 11) or 10 mM BMH in PBS (lanes 3, 6, 9 and 12) and incubated for 45 min. at 37° C. Samples were separated by 12% SDS-PAGE and Western blotted with anti-Bak antibody. The locations of Bak, cross-linked Bak and Bak oligomer are indicated. (b) Bcl-xL blocked Bak oligomerization. Samples were prepared as in (a) except that 200 nM Bcl-xLΔC instead of DCIC was used. (c, d). MG132 and Ucf101 blocked Bak oligomerization. Samples were prepared as before. 25 µM MG132 and 50 µM Ucf101 were used to inhibit Bak oligomerization.
Supplementary Figure 2. Efficiency of 293T transformation on fibronectin-coated plates. 293T cells were pre-seeded so that at the time of transfection, they were 90–100% confluent. For 60-mm plates, we typically used 16–24 µg of DNA and 20–40 µl of Lipofectamine. 16–24 hours post-transfection, we replated cells. a. 293T cells were transfected with either pIRES2-EGFP (left panels) , pcDNA-Opa1-Flag (middle panels) and pcDNA-Opa1 (Q297V)-Flag (right panels) and fixed in 3.7% formaldehyde 44 hours after transfection. All cells were stained with anti-Flag monoclonal antibody and goat anti-mouse-IgG–Alexafluor 647 secondary antibody (Invitrogen). For detail, see Experimental Procedures. b. Cells positive for EGF expression and flag-tagged-Opa1 expression were counted and averages and standard deviations are plotted.
Supplementary Figure 3. Over-expression of Opa1-Q/V mutant protects 293T cells from apoptosis. 293T cells were transfected either with EGFP, wt-Opa1 or Q297V-Opa1 were treated. 24 hour post-transfection, cells were replated and further incubated for 20 hours. Then either 5 µM STS for DMSO were applied for 24 hours. Trypan blue-positive cells were counted, and averages and standard deviations are plotted.
Supplementary Figure 4. Time-course of Bax activation by Chariot-delivered BimS. 293T cells transfected with pcDNA-Opa1-wt (middle column), pcDNA-Opa1-Q/V (right column) or transfected with empty vector (left column) were examined 0, 4, 8, and 12 hours post-chariot delivery of BimS (first four rows) or 12 hours post-chariot delivery of GST (bottom row). Cells were fixed with formaldehyde, and nuclei were stained red with propidium iodide while activated Bax (6A7 antibody) was stained green as described in Experimental Procedures.
Supplementary Figure 5. Expression of Opa1-Q297V blocks apoptosis but not the rapid activation of Bax. a. Graphic representation of Bax activation time course in Supplemental Figure 4. b. TUNEL assay for apoptosis vs. Bax activation staining. 293T cells transfected with vector alone (pcDNA) or vector containing cDNA for Opa1-Q297V mutant were chariot-loaded with BimS as in supplementary figure 4a and stained for DNA fragmentation (TUNEL) and activated Bax (antibody 6A7) after 12 h.
Supplementary Figure 6. Example results from screen of Opa1 point mutants for altered self-binding in an in vitro assay. GST-Opa1 was incubated with radiolabeled in vitro-translated Opa1 WT, Opa1-T302N, Opa1-Q297V, or Crm1 (an unrelated protein) for 30 min in PBS containing 125 mM NaCl. GST-Opa1 WT was pulled down with glutathione-Sepharose beads, and the radiolabeled proteins were analyzed by SDS-PAGE and compared as shown with the input samples of radiolabeled proteins. Note: regions containing the bands of interest from different parts of an autoradiogram were assembled to make this figure. In all, Opa1 K255A, G295E, G295S, G300E, Q297A, Q297V, Q310A, Q310V, T302N, K301A (all variant 1), and Opa1 WT variant 8 were analyzed for binding to themselves and WT Opa1 variant 1. In this in vitro binding screen, only Q297V displayed altered interactions: enhanced binding to GST-fusions of itself and other forms of Opa1; this mutant was selected for further analysis.
Movie of a tomographic reconstruction of an untreated, isolated liver mitochondrion. Movies of the tomographic volume were made using Amira. The first movie segment quickly goes through the 252 slices of the 3D reconstruction focusing on one of the condensed mitochondria. Notice the dark matrix, expanded translucent intracristal spaces, and inner boundary membrane pulled away from the outer membrane (especially noteworthy in the upper left) all characteristic of condensed mitochondria. Tubular crista junctions with a mean opening diameter of about 16 nm are observed connecting the intracristal space with the intermembrane space. The second movie segment superimposes the segmented volume on the reconstruction slices, “growing” as the volume is rotated through 90 degrees. The segmentation was accomplished by tracing along the mitochondrial membranes and then surface rendering the compartments of the volume. The outer membrane is shown in blue, the inner boundary membrane in cyan and the cristae membranes in yellow. The outer and inner boundary membranes were made translucent to better visualize the cristae. The third movie segment removes the reconstruction slices and then rotates the segmented volume first 90 degrees one way, then rocks +/− 45 degrees the other way to provide views of how the cristae fill the mitochondrial volume. Further rotations give additional views of the shapes and sizes of cristae. The fourth movie segment makes the outer membrane opaque and rotates 180 degrees followed by a 180-degree rotation with increasing translucency to show that there are no ruptures in the outer membrane. The fifth movie segment removes the outer membrane to show the translucent inner boundary membrane bounding the volume filled with cristae. The sixth and final segment then makes the inner boundary membrane opaque to best see the crista junctions. It is interesting to note that there are no crista junctions along that face with the greatest separation of the inner boundary membrane from the outer membrane (upper left portion in the first movie segment).
Movie of a tomographic reconstruction of an isolated liver mitochondrion treated with BH3 peptide only. The first movie segment quickly goes through the 230 slices of the 3D reconstruction focusing on one of the condensed mitochondria. Notice the dark matrix, expanded translucent intracristal spaces, and inner boundary membrane pulled away from the outer membrane (portions in the upper right) all characteristic of condensed mitochondria. Narrow tubular crista junctions with a mean opening diameter of 8.5 nm are observed connecting the intracristal space with the intermembrane space. The second movie segment superimposes the segmented volume on the reconstruction slices, “growing” as the volume is rotated through 90 degrees. The outer membrane is shown in blue, the inner boundary membrane in grey and the cristae membranes in yellow. The outer and inner boundary membranes were made translucent to better visualize the cristae. The third movie segment removes the reconstruction slices and then rotates the segmented volume first 90 degrees one way, then rocks +/− 45 degrees the other way to provide views of how the cristae fill the mitochondrial volume. Further rotations give additional views of the shapes and sizes of cristae. The fourth movie segment makes the outer membrane opaque and rotates 180 degrees followed by a 180-degree rotation with increasing translucency to show that there are no ruptures in the outer membrane. The fifth movie segment removes the outer membrane to show the translucent inner boundary membrane bounding the volume filled with cristae. The sixth and final segment then makes the inner boundary membrane opaque to best see the crista junctions.
Movie of a tomographic reconstruction of an isolated liver mitochondrion treated with a combination of BH3 peptide and MG132. The first movie segment quickly goes through the 260 slices of the 3D reconstruction focusing on one of the condensed mitochondria that is considerably larger than those of the first 2 movies. Notice the dark matrix, expanded translucent intracristal spaces, and inner boundary membrane pulled away from the outer membrane (left-hand side) all characteristic of condensed mitochondria. Narrow tubular crista junctions with a mean opening diameter of 9 nm are observed connecting the intracristal space with the intermembrane space. The second movie segment superimposes the segmented volume on the reconstruction slices, “growing” as the volume is rotated through 90 degrees. The outer membrane is shown in blue, the inner boundary membrane in grey and the cristae membranes in a few different colors. The outer and inner boundary membranes were made translucent to better visualize the cristae. More than 200 cristae are shown. The third movie segment removes the reconstruction slices and then rotates the segmented volume first 90 degrees one way, then further rotates to provide views of how the cristae fill the mitochondrial volume. The fourth movie segment makes the outer membrane opaque and rotates 360 degrees to show that there are no ruptures in the outer membrane. The fifth movie segment removes the outer membrane to show the translucent inner boundary membrane bounding the volume filled with cristae. The sixth and final segment then makes the inner boundary membrane opaque to best see the crista junctions. As with the first movie, untreated.mpg, it is interesting to note that there are no crista junctions along that face with the greatest separation of the inner boundary membrane from the outer membrane (left-hand portion in the first movie segment).
Acknowledgments
We are grateful to Ryan Hastie and Dr. Youngmo Seong for careful reading, advice and discussions. This work was supported by NIH grants to D.D.N. (GM50284 and GM62289). Some of the work included here was conducted at the National Center for Microscopy and Imaging Research, supported by NIH Grants RR04050 and DK54441 subproject to MHE. This publication was made possible by grant number ES010337 from the National Institute of Environmental Health //Sciences (NIEHS), NIH. Its contents are solely the responsibility of the authors and do not necessarily represent the official views of the NIEHS, NIH.
Footnotes
Publisher's Disclaimer: This is a PDF file of an unedited manuscript that has been accepted for publication. As a service to our customers we are providing this early version of the manuscript. The manuscript will undergo copyediting, typesetting, and review of the resulting proof before it is published in its final citable form. Please note that during the production process errors may be discovered which could affect the content, and all legal disclaimers that apply to the journal pertain.
References
- 1.Arnoult D, Grodet A, Lee YJ, Estaquier J, Blackstone C. Release of OPA1 during apoptosis participates in the rapid and complete release of cytochrome c and subsequent mitochondrial fragmentation. J Biol. Chem. 2005;280:35742–35750. doi: 10.1074/jbc.M505970200. [DOI] [PubMed] [Google Scholar]
- 2.Bossy-Wetzel E, Newmeyer DD, Green DR. Mitochondrial cytochrome c release in apoptosis occurs upstream of DEVD-specific caspase activation and independently of mitochondrial transmembrane depolarization. EMBO J. 1998;17:37–49. doi: 10.1093/emboj/17.1.37. [DOI] [PMC free article] [PubMed] [Google Scholar]
- 3.Cipolat S, Rudka T, Hartmann D, Costa V, Serneels L, Craessaerts K, Metzger K, Frezza C, Annaert W, D'Adamio L, et al. Mitochondrial rhomboid PARL regulates cytochrome c release during apoptosis via OPA1-dependent cristae remodeling. Cell. 2006;126:163–175. doi: 10.1016/j.cell.2006.06.021. [DOI] [PubMed] [Google Scholar]
- 4.Clohessy JG, Zhuang J, de Boer J, Gil-Gomez G, Brady HJ. Mcl-1 interacts with truncated Bid and inhibits its induction of cytochrome c release and its role in receptor-mediated apoptosis. J. Biol. Chem. 2006;281:5750–5759. doi: 10.1074/jbc.M505688200. [DOI] [PubMed] [Google Scholar]
- 5.Colell A, Ricci JE, Tait S, Milasta S, Maurer U, Bouchier-Hayes L, Fitzgerald P, Guio-Carrion A, Waterhouse NJ, Li CW, et al. GAPDH and autophagy preserve survival after apoptotic cytochrome c release in the absence of caspase activation. Cell. 2007;129:983–997. doi: 10.1016/j.cell.2007.03.045. [DOI] [PubMed] [Google Scholar]
- 6.Dejean LM, Martinez-Caballero S, Guo L, Hughes C, Teijido O, Ducret T, Ichas F, Korsmeyer SJ, Antonsson B, Jonas EA, et al. Oligomeric Bax is a component of the putative cytochrome c release channel MAC, mitochondrial apoptosis-induced channel. Mol. Biol. Cell. 2005;16:2424–2432. doi: 10.1091/mbc.E04-12-1111. [DOI] [PMC free article] [PubMed] [Google Scholar]
- 7.Frezza C, Cipolat S, Martins de Brito O, Micaroni M, Beznoussenko GV, Rudka T, Bartoli D, Polishuck RS, Danial NN, De Strooper B, et al. OPA1 controls apoptotic cristae remodeling independently from mitochondrial fusion. Cell. 2006;126:177–189. doi: 10.1016/j.cell.2006.06.025. [DOI] [PubMed] [Google Scholar]
- 8.Goldstein JC, Waterhouse NJ, Juin P, Evan GI, Green DR. The coordinate release of cytochrome c during apoptosis is rapid, complete and kinetically invariant. Nat. Cell Biol. 2000;2:156–162. doi: 10.1038/35004029. [DOI] [PubMed] [Google Scholar]
- 9.Griparic L, Kanazawa T, van der Bliek AM. Regulation of the mitochondrial dynamin-like protein Opa1 by proteolytic cleavage. J. Cell Biol. 2007;178:757–764. doi: 10.1083/jcb.200704112. [DOI] [PMC free article] [PubMed] [Google Scholar]
- 10.Griparic L, van der Wel NN, Orozco IJ, Peters PJ, van der Bliek AM. Loss of the intermembrane space protein Mgm1/OPA1 induces swelling and localized constrictions along the lengths of mitochondria. J. Biol. Chem. 2004;279:18792–18798. doi: 10.1074/jbc.M400920200. [DOI] [PubMed] [Google Scholar]
- 11.Jaarsma D. Swelling and vacuolisation of mitochondria in transgenic SOD1-ALS mice: a consequence of supranormal SOD1 expression? Mitochondrion. 2006;6:48–49. doi: 10.1016/j.mito.2005.10.005. author reply 50-41. [DOI] [PubMed] [Google Scholar]
- 12.John GB, Shang Y, Li L, Renken C, Mannella CA, Selker JM, Rangell L, Bennett MJ, Zha J. The mitochondrial inner membrane protein mitofilin controls cristae morphology. Mol. Biol. Cell. 2005;16:1543–1554. doi: 10.1091/mbc.E04-08-0697. [DOI] [PMC free article] [PubMed] [Google Scholar]
- 13.Khodjakov A, Rieder C, Mannella CA, Kinnally KW. Laser micro-irradiation of mitochondria: is there an amplified mitochondrial death signal in neural cells? Mitochondrion. 2004;3:217–227. doi: 10.1016/j.mito.2003.10.002. [DOI] [PubMed] [Google Scholar]
- 14.Kinnally KW, Antonsson B. A tale of two mitochondrial channels, MAC and PTP, in apoptosis. Apoptosis. 2007;12:857–868. doi: 10.1007/s10495-007-0722-z. [DOI] [PubMed] [Google Scholar]
- 15.Kluck RM, Bossy-Wetzel E, Green DR, Newmeyer DD. The release of cytochrome c from mitochondria: a primary site for Bcl-2 regulation of apoptosis. Science. 1997a;275:1132–1136. doi: 10.1126/science.275.5303.1132. [DOI] [PubMed] [Google Scholar]
- 16.Kluck RM, Ellerby LM, Ellerby HM, Naiem S, Yaffe MP, Bredesen D, Mauk AG, Sherman F, Newmeyer DD. Determinants of cytochrome c pro-apoptotic activity. The role of lysine 72 trimethylation. J Biol. Chem. 2000;275:16127–16133. doi: 10.1074/jbc.275.21.16127. [DOI] [PubMed] [Google Scholar]
- 17.Kluck RM, Martin SJ, Hoffman BM, Zhou JS, Green DR, Newmeyer DD. Cytochrome c activation of CPP32-like proteolysis plays a critical role in a Xenopus cell-free apoptosis system. EMBO J. 1997b;16:4639–4649. doi: 10.1093/emboj/16.15.4639. [DOI] [PMC free article] [PubMed] [Google Scholar]
- 18.Kuwana T, Mackey MR, Perkins G, Ellisman MH, Latterich M, Schneiter R, Green DR, Newmeyer DD. Bid, Bax, and lipids cooperate to form supramolecular openings in the outer mitochondrial membrane. Cell. 2002;111:331–342. doi: 10.1016/s0092-8674(02)01036-x. [DOI] [PubMed] [Google Scholar]
- 19.Lee YJ, Jeong SY, Karbowski M, Smith CL, Youle RJ. Roles of the mammalian mitochondrial fission and fusion mediators Fis1, Drp1, and Opa1 in apoptosis. Mol. Biol. Cell. 2004;15:5001–5011. doi: 10.1091/mbc.E04-04-0294. [DOI] [PMC free article] [PubMed] [Google Scholar]
- 20.Martinez-Caballero S, Dejean LM, Jonas EA, Kinnally KW. The role of the mitochondrial apoptosis induced channel MAC in cytochrome c release. J. Bioenerg. Biomembr. 2005;37:155–164. doi: 10.1007/s10863-005-6570-z. [DOI] [PubMed] [Google Scholar]
- 21.Misaka T, Miyashita T, Kubo Y. Primary structure of a dynamin-related mouse mitochondrial GTPase and its distribution in brain, subcellular localization, and effect on mitochondrial morphology. J Biol. Chem. 2002;277:15834–15842. doi: 10.1074/jbc.M109260200. [DOI] [PubMed] [Google Scholar]
- 22.Munoz-Pinedo C, Guio-Carrion A, Goldstein JC, Fitzgerald P, Newmeyer DD, Green DR. Different mitochondrial intermembrane space proteins are released during apoptosis in a manner that is coordinately initiated but can vary in duration. Proc. Natl. Acad. Sci. U S A. 2006;103:11573–11578. doi: 10.1073/pnas.0603007103. [DOI] [PMC free article] [PubMed] [Google Scholar]
- 23.Scorrano L, Ashiya M, Buttle K, Weiler S, Oakes SA, Mannella CA, Korsmeyer SJ. A distinct pathway remodels mitochondrial cristae and mobilizes cytochrome c during apoptosis. Dev. Cell. 2002;2:55–67. doi: 10.1016/s1534-5807(01)00116-2. [DOI] [PubMed] [Google Scholar]
- 24.Scorrano L, Korsmeyer SJ. Mechanisms of cytochrome c release by proapoptotic BCL-2 family members. Biochem. Biophys. Res. Commun. 2003;304:437–444. doi: 10.1016/s0006-291x(03)00615-6. [DOI] [PubMed] [Google Scholar]
- 25.Scott CL, Schuler M, Marsden VS, Egle A, Pellegrini M, Nesic D, Gerondakis S, Nutt SL, Green DR, Strasser A. Apaf-1 and caspase-9 do not act as tumor suppressors in myc-induced lymphomagenesis or mouse embryo fibroblast transformation. J. Cell. Biol. 2004;164:89–96. doi: 10.1083/jcb.200310041. [DOI] [PMC free article] [PubMed] [Google Scholar]
- 26.Song Z, Chen H, Fiket M, Alexander C, Chan DC. OPA1 processing controls mitochondrial fusion and is regulated by mRNA splicing, membrane potential, and Yme1L. J. Cell Biol. 2007;178:749–755. doi: 10.1083/jcb.200704110. [DOI] [PMC free article] [PubMed] [Google Scholar]
- 27.Sun MG, Williams J, Munoz-Pinedo C, Perkins GA, Brown JM, Ellisman MH, Green DR, Frey TG. Correlated three-dimensional light and electron microscopy reveals transformation of mitochondria during apoptosis. Nat. Cell Biol. 2007;9:1057–1065. doi: 10.1038/ncb1630. [DOI] [PubMed] [Google Scholar]
- 28.Urban S, Wolfe MS. Reconstitution of intramembrane proteolysis in vitro reveals that pure rhomboid is sufficient for catalysis and specificity. Proc. Natl. Acad. Sci. U S A. 2005;102:1883–1888. doi: 10.1073/pnas.0408306102. [DOI] [PMC free article] [PubMed] [Google Scholar]
- 29.von Ahsen O, Renken C, Perkins G, Kluck RM, Bossy-Wetzel E, Newmeyer DD. Preservation of mitochondrial structure and function after Bid- or Bax-mediated cytochrome c release. J. Cell Biol. 2000;150:1027–1036. doi: 10.1083/jcb.150.5.1027. [DOI] [PMC free article] [PubMed] [Google Scholar]
- 30.Yamaguchi R, Andreyev A, Murphy AN, Perkins GA, Ellisman MH, Newmeyer DD. Mitochondria frozen with trehalose retain a number of biological functions and preserve outer membrane integrity. Cell Death Differ. 2006 doi: 10.1038/sj.cdd.4402035. [DOI] [PubMed] [Google Scholar]
- 31.Yamaguchi R, Mazaki Y, Hirota K, Hashimoto S, Sabe H. Mitosis specific serine phosphorylation and downregulation of one of the focal adhesion protein, paxillin. Oncogene. 1997;15:1753–1761. doi: 10.1038/sj.onc.1201345. [DOI] [PubMed] [Google Scholar]
Associated Data
This section collects any data citations, data availability statements, or supplementary materials included in this article.
Supplementary Materials
Supplementary Figure 1. MOMP inhibitors blocked N/C-Bid-induced Bak oligomerization. (a) DCIC blocked Bak oligomerization. Mitochondria were treated with either 100 µM DCIC (lanes 4–6), 10 nM N/C-Bid (lanes 7–9) or both (lanes 10–12) or left untreated (lanes 1–3) for 30 minutes at 37° C. Pellets were suspended either in PBS (lanes 1, 4, 7 and 10), 10% DMSO in PBS (lanes 2, 5, 8 and 11) or 10 mM BMH in PBS (lanes 3, 6, 9 and 12) and incubated for 45 min. at 37° C. Samples were separated by 12% SDS-PAGE and Western blotted with anti-Bak antibody. The locations of Bak, cross-linked Bak and Bak oligomer are indicated. (b) Bcl-xL blocked Bak oligomerization. Samples were prepared as in (a) except that 200 nM Bcl-xLΔC instead of DCIC was used. (c, d). MG132 and Ucf101 blocked Bak oligomerization. Samples were prepared as before. 25 µM MG132 and 50 µM Ucf101 were used to inhibit Bak oligomerization.
Supplementary Figure 2. Efficiency of 293T transformation on fibronectin-coated plates. 293T cells were pre-seeded so that at the time of transfection, they were 90–100% confluent. For 60-mm plates, we typically used 16–24 µg of DNA and 20–40 µl of Lipofectamine. 16–24 hours post-transfection, we replated cells. a. 293T cells were transfected with either pIRES2-EGFP (left panels) , pcDNA-Opa1-Flag (middle panels) and pcDNA-Opa1 (Q297V)-Flag (right panels) and fixed in 3.7% formaldehyde 44 hours after transfection. All cells were stained with anti-Flag monoclonal antibody and goat anti-mouse-IgG–Alexafluor 647 secondary antibody (Invitrogen). For detail, see Experimental Procedures. b. Cells positive for EGF expression and flag-tagged-Opa1 expression were counted and averages and standard deviations are plotted.
Supplementary Figure 3. Over-expression of Opa1-Q/V mutant protects 293T cells from apoptosis. 293T cells were transfected either with EGFP, wt-Opa1 or Q297V-Opa1 were treated. 24 hour post-transfection, cells were replated and further incubated for 20 hours. Then either 5 µM STS for DMSO were applied for 24 hours. Trypan blue-positive cells were counted, and averages and standard deviations are plotted.
Supplementary Figure 4. Time-course of Bax activation by Chariot-delivered BimS. 293T cells transfected with pcDNA-Opa1-wt (middle column), pcDNA-Opa1-Q/V (right column) or transfected with empty vector (left column) were examined 0, 4, 8, and 12 hours post-chariot delivery of BimS (first four rows) or 12 hours post-chariot delivery of GST (bottom row). Cells were fixed with formaldehyde, and nuclei were stained red with propidium iodide while activated Bax (6A7 antibody) was stained green as described in Experimental Procedures.
Supplementary Figure 5. Expression of Opa1-Q297V blocks apoptosis but not the rapid activation of Bax. a. Graphic representation of Bax activation time course in Supplemental Figure 4. b. TUNEL assay for apoptosis vs. Bax activation staining. 293T cells transfected with vector alone (pcDNA) or vector containing cDNA for Opa1-Q297V mutant were chariot-loaded with BimS as in supplementary figure 4a and stained for DNA fragmentation (TUNEL) and activated Bax (antibody 6A7) after 12 h.
Supplementary Figure 6. Example results from screen of Opa1 point mutants for altered self-binding in an in vitro assay. GST-Opa1 was incubated with radiolabeled in vitro-translated Opa1 WT, Opa1-T302N, Opa1-Q297V, or Crm1 (an unrelated protein) for 30 min in PBS containing 125 mM NaCl. GST-Opa1 WT was pulled down with glutathione-Sepharose beads, and the radiolabeled proteins were analyzed by SDS-PAGE and compared as shown with the input samples of radiolabeled proteins. Note: regions containing the bands of interest from different parts of an autoradiogram were assembled to make this figure. In all, Opa1 K255A, G295E, G295S, G300E, Q297A, Q297V, Q310A, Q310V, T302N, K301A (all variant 1), and Opa1 WT variant 8 were analyzed for binding to themselves and WT Opa1 variant 1. In this in vitro binding screen, only Q297V displayed altered interactions: enhanced binding to GST-fusions of itself and other forms of Opa1; this mutant was selected for further analysis.
Movie of a tomographic reconstruction of an untreated, isolated liver mitochondrion. Movies of the tomographic volume were made using Amira. The first movie segment quickly goes through the 252 slices of the 3D reconstruction focusing on one of the condensed mitochondria. Notice the dark matrix, expanded translucent intracristal spaces, and inner boundary membrane pulled away from the outer membrane (especially noteworthy in the upper left) all characteristic of condensed mitochondria. Tubular crista junctions with a mean opening diameter of about 16 nm are observed connecting the intracristal space with the intermembrane space. The second movie segment superimposes the segmented volume on the reconstruction slices, “growing” as the volume is rotated through 90 degrees. The segmentation was accomplished by tracing along the mitochondrial membranes and then surface rendering the compartments of the volume. The outer membrane is shown in blue, the inner boundary membrane in cyan and the cristae membranes in yellow. The outer and inner boundary membranes were made translucent to better visualize the cristae. The third movie segment removes the reconstruction slices and then rotates the segmented volume first 90 degrees one way, then rocks +/− 45 degrees the other way to provide views of how the cristae fill the mitochondrial volume. Further rotations give additional views of the shapes and sizes of cristae. The fourth movie segment makes the outer membrane opaque and rotates 180 degrees followed by a 180-degree rotation with increasing translucency to show that there are no ruptures in the outer membrane. The fifth movie segment removes the outer membrane to show the translucent inner boundary membrane bounding the volume filled with cristae. The sixth and final segment then makes the inner boundary membrane opaque to best see the crista junctions. It is interesting to note that there are no crista junctions along that face with the greatest separation of the inner boundary membrane from the outer membrane (upper left portion in the first movie segment).
Movie of a tomographic reconstruction of an isolated liver mitochondrion treated with BH3 peptide only. The first movie segment quickly goes through the 230 slices of the 3D reconstruction focusing on one of the condensed mitochondria. Notice the dark matrix, expanded translucent intracristal spaces, and inner boundary membrane pulled away from the outer membrane (portions in the upper right) all characteristic of condensed mitochondria. Narrow tubular crista junctions with a mean opening diameter of 8.5 nm are observed connecting the intracristal space with the intermembrane space. The second movie segment superimposes the segmented volume on the reconstruction slices, “growing” as the volume is rotated through 90 degrees. The outer membrane is shown in blue, the inner boundary membrane in grey and the cristae membranes in yellow. The outer and inner boundary membranes were made translucent to better visualize the cristae. The third movie segment removes the reconstruction slices and then rotates the segmented volume first 90 degrees one way, then rocks +/− 45 degrees the other way to provide views of how the cristae fill the mitochondrial volume. Further rotations give additional views of the shapes and sizes of cristae. The fourth movie segment makes the outer membrane opaque and rotates 180 degrees followed by a 180-degree rotation with increasing translucency to show that there are no ruptures in the outer membrane. The fifth movie segment removes the outer membrane to show the translucent inner boundary membrane bounding the volume filled with cristae. The sixth and final segment then makes the inner boundary membrane opaque to best see the crista junctions.
Movie of a tomographic reconstruction of an isolated liver mitochondrion treated with a combination of BH3 peptide and MG132. The first movie segment quickly goes through the 260 slices of the 3D reconstruction focusing on one of the condensed mitochondria that is considerably larger than those of the first 2 movies. Notice the dark matrix, expanded translucent intracristal spaces, and inner boundary membrane pulled away from the outer membrane (left-hand side) all characteristic of condensed mitochondria. Narrow tubular crista junctions with a mean opening diameter of 9 nm are observed connecting the intracristal space with the intermembrane space. The second movie segment superimposes the segmented volume on the reconstruction slices, “growing” as the volume is rotated through 90 degrees. The outer membrane is shown in blue, the inner boundary membrane in grey and the cristae membranes in a few different colors. The outer and inner boundary membranes were made translucent to better visualize the cristae. More than 200 cristae are shown. The third movie segment removes the reconstruction slices and then rotates the segmented volume first 90 degrees one way, then further rotates to provide views of how the cristae fill the mitochondrial volume. The fourth movie segment makes the outer membrane opaque and rotates 360 degrees to show that there are no ruptures in the outer membrane. The fifth movie segment removes the outer membrane to show the translucent inner boundary membrane bounding the volume filled with cristae. The sixth and final segment then makes the inner boundary membrane opaque to best see the crista junctions. As with the first movie, untreated.mpg, it is interesting to note that there are no crista junctions along that face with the greatest separation of the inner boundary membrane from the outer membrane (left-hand portion in the first movie segment).