Abstract
Objective
We determined the glucose metabolism and computed tomographic (CT) density of the normal prostate gland in relation to age and prostate size on [F-18] fluorodeoxyglucose positron emission tomography (PET)–CT.
Methods
We determined the CT density (Hounsfield Units, HU) and glucose metabolism (standardized uptake value, SUV) of the normal prostate in 145 men (age range 22–97 years) on PET–CT scans which were performed for indications unrelated to prostate pathology. Correlations among SUV, HU, prostate size, and age were calculated using Pearson’s correlation coefficients, scatter plots, and linear regression trend lines. The SUV and HU values were also compared among different primary cancer types using the Kruskal–Wallis test.
Results
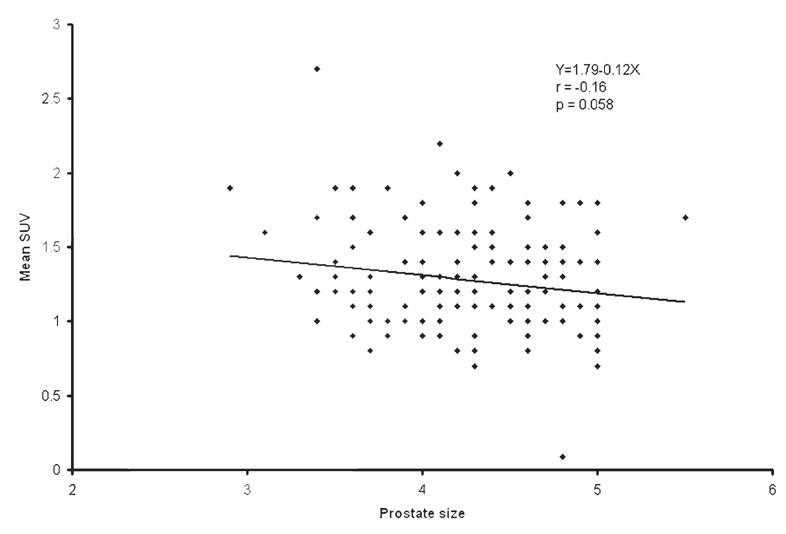
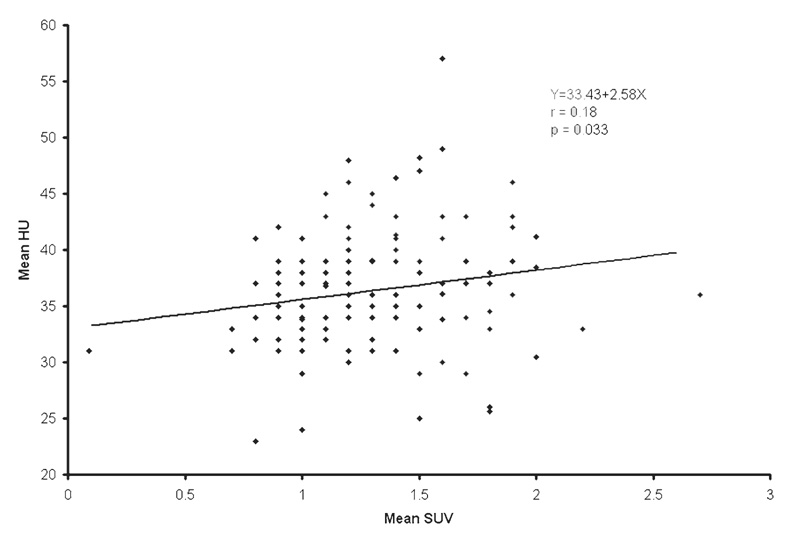
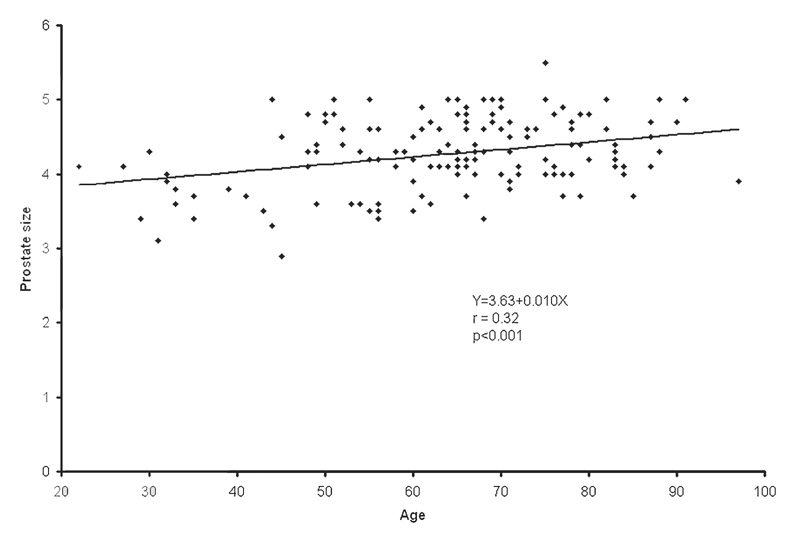
The population average and range of the normal prostate size were 4.3 ± 0.5 cm (mean ± SD) and 2.9– 5.5 cm, respectively. The population average of mean and maximum CT densities was 36.0 ± 5.1 HU (range 23–57) and 91.7 ± 20.1 HU (range 62–211), respectively. The population average of mean and maximum SUV was 1.3 ± 0.4 (range 0.1–2.7) and 1.6 ± 0.4 (range 1.1– 3.7), respectively. Mean SUV tended to decrease as the prostate size increased (r = −0.16, P = 0.058). Higher mean HU was correlated with higher mean SUV (r = 0.18, P = 0.033). The strongest association was observed between age and prostate size. The prostate gets larger as age increases (r = 0.32, P < 0.001). Prostate mean SUV, max SUV, mean HU, and max HU were not significantly different among different types of primary cancers.
Conclusions
Although the normal prostate size increases with age, it does not significantly affect the gland’s metabolism and CT density, and therefore age–correction of these parameters may be unnecessary.
Keywords: Prostate, FDG, PET–CT
Introduction
Positron emission tomography (PET), and more recently hybrid PET–computed tomography (CT), with [F-18] fluorodeoxyglucose (FDG) have become important diagnostic imaging tools for the identification, localization, and characterization of a diverse group of malignancies [1, 2]. The clinical utility of FDG-PET and PET–CT includes staging and restaging of cancer, evaluation of response to treatment, differentiation of posttherapy alterations from residual or recurrent tumor, and assessment of prognosis [3].
Prostate cancer is the most common cancer affecting men in the United States. As life expectancy increases, so will the incidence of this disease, creating what may become an epidemic health problem. Prostate cancer is a heterogeneous disease in the sense that although in some patients the disease may be generally dormant, in others it can progress rapidly [4–6]. This biological heterogeneity is reflected in the current perceived mixed experience with FDG-PET in prostate cancer. Animal and preliminary clinical studies have demonstrated that FDG-PET may be useful in the evaluation of patients with high Gleason score primary tumors and serum prostate specific antigen (PSA) levels, in the assessment of the extent of advanced androgen-independent disease, in the detection of metabolically active osseous and soft tissue metastases, and in the assessment of response after androgen ablation and treatment with the novel chemotherapies [7–22]. Studies have shown that FDG accumulation in both the primary tumor and the metastatic sites decreases in as early as 1–5 months after androgen ablation, which is concordant with the decline in serum PSA level and lesion size on CT [9, 23]. Moreover, men with primary prostate lesions that demonstrate high FDG accumulation have poorer prognosis in comparison with those patients with prostate tumors that display low metabolic activity [24].
As our experience evolves in recognizing the exact clinical situations in which FDG-PET and PET–CT may become useful in the imaging evaluation of prostate cancer, it is important to characterize the physiological accumulation of FDG in the normal prostate gland in relation to age. Therefore, the objective of this study was to determine the range and mean glucose metabolic activity and CT density of the normal prostate gland in relation to age.
Materials and methods
The study was approved by our Institutional Review Board, and signed informed consent forms were obtained from all subjects. The patient group included 145 adult men (age range 22–97 years, mean 63.6 years) who were referred to our PET Imaging Clinic over a 6-month period and had no historical, clinical, laboratory, and radiographic evidence of prostate pathology. Serum PSA levels were available in about one-third of men and were all within normal limits. We determined the CT density (mean and maximum in Hounsfield Units, HU) and glucose metabolism (mean and maximum standardized uptake value, SUV) on the basis of lean body mass [25] of the prostate gland on PET–CT scans that were performed for oncological indications unrelated to prostate disease, most frequently for the evaluation of treatment response to an unrelated malignancy (37 lymphoma, 51 gastrointestinal cancer, 22 lung cancer, 12 head and neck cancer, and 23 other cancer). All prostate glands that had calcification on CT were excluded. The semi-quantitative CT density and glucose metabolism of the gland were recorded using a system software image tool utility with circular or oval prostate regions of interest on a single transaxial CT image that showed the largest dimension of the gland (denoted as prostate size) selected by two independent observers in consensus who also agreed on no artifactual contamination from the urinary bladder. PET–CT was performed using a dual-slice CT Siemens Biograph PET–CT imaging system. A non-enhanced CT transmission scan (120 kVp, 220 mAs at 15 mm/rot, each data set consisted of 47 contiguous, 3.375-mm-thick, tomographic sections, for a total field of view of 16.2 cm) was obtained for attenuation correction after administration of oral contrast material. PET emission images were obtained 60 min after an intravenous administration of 15 mCi (555 MBq) FDG (4 min per bed position) in a caudo-cranial direction from upper thighs to skull base after voiding. Images were reconstructed using an iterative procedure with an ordered subset expectation maximization algorithm. All patients had plasma glucose levels less than 120 mg/dl and fasted for at least 6 h prior to FDG administration. The patients were instructed to breath normally during the PET–CT scan. Co-registered images in transaxial, sagittal, and coronal planes were presented on a dedicated color monitor. The degree of PET and concordant CT image fusion could be varied on a continuous scale. Correlations among SUV, HU, prostate size, and age were calculated using Pearson’s correlation coefficients, scatter plots, and linear regression trend lines. The SUV and HU values were also compared among different primary cancer types using the Kruskal–Wallis test. A probability of less than 0.05 was considered to be statistically significant.
Results
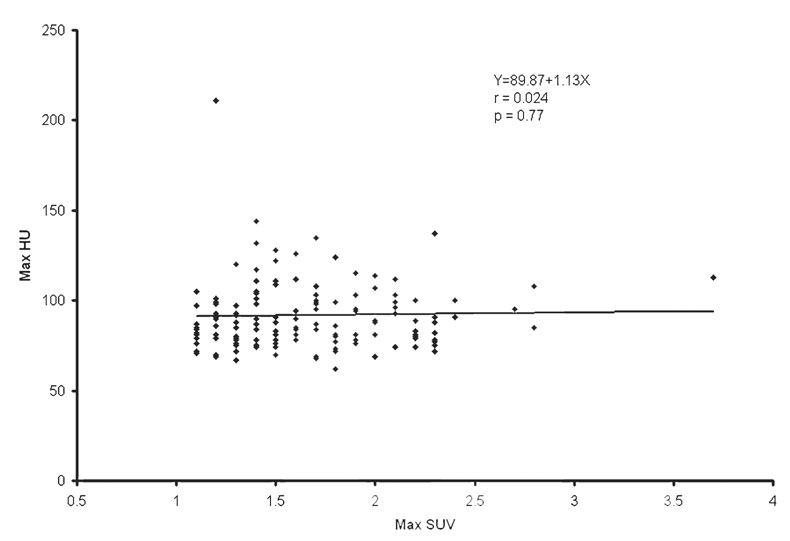
The population average and range of normal prostate size were 4.3 ± 0.5 cm (mean ± SD) and 2.9–5.5 cm, respectively. The population average of mean and maximum CT densities of the normal prostate gland was 36.0 ± 5.1 HU (range 23–57) and 91.7 ± 20.1 HU (range 62–211), respectively. The population average of mean and maximum SUV of the normal prostate gland was 1.3 ± 0.4 (range 0.1–2.7) and 1.6 ± 0.4 (range 1.1–3.7), respectively. Table 1 summarizes the correlation among SUV, HU, prostate size, and age. Mean SUV tended to decrease as the prostate size increased (r = −0.16, P = 0.058; Fig. 1). Higher mean HU was correlated with higher mean SUV (r = 0.18, P = 0.033; Fig. 2). However, these correlations were all very weak with the absolute values of correlation coefficients being less than 0.20. The strongest association was observed between prostate size and age. The prostate gets larger as age increases (r = 0.32, P < 0.001; Fig. 3). There was no statistically significant linear relationship between the maximum HU and the maximum SUV of the normal prostate gland (r = 0.024, P = 0.77; Fig. 4). Prostate mean SUV, max SUV, mean HU, and max HU were not significantly different among different types of primary cancers (P > 0.76).
Table 1.
Correlation among SUV, HU, prostate size, and age
| Dependent variable (Y) | Independent variable (X) | Intercept | Slope | Correlation coefficient | P value testing H0 ρ = 0 |
|---|---|---|---|---|---|
| Mean HU | Mean SUV | 33.43 | 2.58 | 0.18 | 0.033 |
| Max HU | Max SUV | 89.87 | 1.13 | 0.024 | 0.77 |
| Max SUV | Age | 1.77 | −0.002 | −0.054 | 0.52 |
| Mean SUV | Age | 1.46 | −0.003 | −0.11 | 0.19 |
| Max HU | Age | 81.76 | 0.16 | 0.12 | 0.16 |
| Mean HU | Age | 38.77 | −0.032 | −0.093 | 0.26 |
| Max SUV | Prostate size | 2.16 | −0.11 | −0.13 | 0.13 |
| Mean SUV | Prostate size | 1.79 | −0.12 | −0.16 | 0.058 |
| Prostate size | Age | 3.63 | 0.010 | 0.32 | <0.001 |
SUV standardized uptake value, HU Hounsfield Units
Fig. 1.
The scatter plot and least-squares linear relationship between mean standardized uptake value (SUV) and normal prostate size (cm)
Fig. 2.
The scatter plot and least-squares linear relationship between mean Hounsfield Units (HU) and mean SUV of the normal prostate gland (cm)
Fig. 3.
The scatter plot and least-squares linear relationship between normal prostate size (cm) and age (years)
Fig. 4.
The scatter plot and least-squares linear relationship between maximum HU and maximum SUV of the normal prostate gland
Discussion
It has generally been assumed that PET with FDG may not be useful in prostate cancer [26]. This assumption is probably made on the basis of the observed heterogeneity of tumor metabolic activity that can overlap with normal tissue and with benign prostatic hyperplasia. Although the exact etiology for the observed variability of glucose metabolism in prostate cancer remains unclear, this observation probably reflects the biological range of the disease. Several animal-based translational and human-based clinical studies have now demonstrated that FDG-PET can be useful in certain clinical circumstances in prostate cancer such as in the imaging evaluation of patients with high Gleason score primary tumors, in patients with elevated serum PSA levels (biochemical relapse) after initial primary treatment (e.g., radical prostatectomy), in the assessment of the extent of disease in men with advanced androgen-independent disease, for the detection of metabolically active osseous and soft tissue metastases, in the assessment of response to treatment, and in prognostication [7–24]. FDG-PET may also be useful in the prediction of the time to androgen refractory state that may allow earlier therapeutic modification to be made for the purpose of averting or delaying this clinical state to improve overall outcome [11, 27].
Biological variability may only partially explain the observed heterogeneity of FDG accumulation in prostate cancer. Technical and image-processing factors may also play important roles. For example, significantly lower tissue SUV may be obtained, with ensuing false-negative results, when filtered-back projection is employed instead of iterative reconstruction with segmented attenuation irrespective of the biological heterogeneity [28, 29]. In fact, it has been demonstrated that in selected patients, iterative reconstruction can contribute significantly in the detection of prostate cancer with FDG-PET [29]. In our study, PET images were iteratively reconstructed with segmented attenuation map obtained from the CT transmission data.
With the current availability of PET–CT, it is now possible to precisely localize metabolic abnormalities and characterize the metabolic activity of normal and abnormal structures, thereby increasing diagnostic confidence and reducing equivocal image interpretations. It is therefore important to determine the physiological range of the structural and metabolic parameters of interest for various organ systems and their potential relations to age to accurately differentiate abnormalities from the normal pattern. In this investigation, we mapped the physiological metabolic pattern of the normal prostate gland using PET–CT with FDG. Recently, there have been a few reports on the physiological biodistribution FDG in various tissues using PET–CT [30, 31]. An investigation of the normal prostate glands of 24 men showed a range of 1.6–3.4 for the maximum SUV and a mean SUV of 1.9 ± 0.35 [31]. These results are similar to our results that showed a maximum SUV range 1.1–3.7 and a population average mean SUV of 1.3 ± 0.4 that were obtained in an approximately sixfold larger group of men with normal prostate glands. Moreover, we determined the range and the expected mean for the CT density of the normal prostate gland and showed that age has a statistically significant weak positive linear relationship with prostate size. We also noted a statistically significant very weak positive correlation between mean HU and mean SUV (r = 0.18, P = 0.033), possibly reflecting effects of higher cellular density and/or effects of attenuation correction.
An understanding of the age-related structural and metabolic changes of the prostate gland can be important to differentiate accurately age-related physiological changes from pathological alterations. Well et al. [32] showed that there are significant age-related structural and metabolic changes of various normal tissues. For example, the volume of the prostate gland increased from 23.5 ± 6.2 cm3 during the second decade of life to 47.5 ± 41.6 cm3 by the late eighth decade of life, with the central gland increasing from 9.9 ± 3.9 cm3 to 29.5 ± 28.9 cm3 during the same age range. However, no information was provided on the age-related metabolic changes of the normal prostate gland. We have shown that despite some increase in prostate size with age, there is no statistically significant change in the normal gland metabolic activity (see Table 1).
Our study may be limited with respect to the definition of the normal prostate gland which was based on no clinical and radiological evidence of prostate pathology. Normal prostate tissue, benign prostatic hyperplasia, and small deposits of prostate cancer can coexist in asymptomatic men. The tissue localization of FDG in prostate cancer may also be dependent on the level of tumor hypoxia (not cellular proliferation and blood flow) that can vary depending upon tumor size, extent, and grade [33]. Nevertheless, although our definition of normal is not equivalent to the standard histological definition of normal, for practical and ethical reasons such information cannot be typically available in patients with no clinically evident or suspected prostate pathology. It is of note that during a follow-up of at least 1 year, we were unaware of development of any prostate pathology in our group of men who were scanned with PET–CT for other indications. An additional limitation may be related to potential activity contamination in the prostate bed from the adjacent bladder urine activity. However, we minimized the amount of residual activity in the urinary bladder by having the patient void completely followed immediately by PET imaging of the pelvis.
Conclusions
In summary, our study adds to the very limited current literature on the physiological map of the normal prostate gland glucose metabolism forming the basis for comparison as the exact diagnostic utility of FDG-PET–CT in prostate cancer evolves in the near future. Over a wide range of patient ages, we demonstrated that although age may be a relevant parameter in prostate size, it does not significantly affect the normal prostate gland metabolism and structure (CT density) and therefore age-correction for these values may be unnecessary.
Acknowledgments
The authors thank Drs. Linh Ho, Vicki Quan, and Cindy Mayer for their help with data collection. This work was supported by the NIH/NCI grant R01-CA111613 (HJ).
References
- 1.Conti PS, Lilien DL, Hawley K, Keppler J, Grafton ST, Bading JR. PET and [F-18]-FDG in oncology: a clinical update. Nucl Med Biol. 1996;23:717–735. doi: 10.1016/0969-8051(96)00074-1. [DOI] [PubMed] [Google Scholar]
- 2.Jadvar H, Fischman AJ. Evaluation of rare tumors with [F-18]fluorodeoxyglucose positron emission tomography. Clin Positron Imaging. 1999;2:153–158. doi: 10.1016/s1095-0397(99)00014-x. [DOI] [PubMed] [Google Scholar]
- 3.Kostakoglu L, Agress H, Jr, Goldsmith SJ. Clinical role of FDG PET in evaluation of cancer patients. Radiographics. 2003;23:315–340. doi: 10.1148/rg.232025705. [DOI] [PubMed] [Google Scholar]
- 4.Frank IN, Graham S, Jr, Nabors WL. Urologic and male genital cancers. In: Holleb AI, Fink DJ, Murphy GP, editors. Clinical oncology. Atlanta: American Cancer Society; 1991. pp. 280–283. [Google Scholar]
- 5.Johansson JE, Andren O, Andersson SO, Dickman PW, Holmberg L, Magnuson A, et al. Natural history of early, localized prostate cancer. JAMA. 2004;291:2713–2719. doi: 10.1001/jama.291.22.2713. [DOI] [PubMed] [Google Scholar]
- 6.Algaba F, Trias I, Arce Y. Natural history of prostate carcinoma: the pathologist’s perspective. Recent Results Cancer Res. 2007;175:9–24. doi: 10.1007/978-3-540-40901-4_2. [DOI] [PubMed] [Google Scholar]
- 7.Shreve PD, Grossman HB, Gross MD, Wahl RL. Metastatic prostate cancer: initial findings of PET with FDG. Radiology. 1996;199:751–756. doi: 10.1148/radiology.199.3.8638000. [DOI] [PubMed] [Google Scholar]
- 8.Oyama N, Akino H, Kanamaru H, Okada K. Fluorodeoxy-glucose positron emission tomography in diagnosis of untreated prostate cancer. Nippon Rinsho. 1998;56:2052–2055. [PubMed] [Google Scholar]
- 9.Oyama N, Akino H, Suzuki Y, Kanamaru H, Sadato N, Yonekura Y, et al. The increased accumulation of [18F]fluorodeoxyglucose in untreated prostate cancer. Jpn J Clin Oncol. 1999;29:623–629. doi: 10.1093/jjco/29.12.623. [DOI] [PubMed] [Google Scholar]
- 10.Kanamaru H, Oyama N, Akino J, Okada K. Evaluation of prostate cancer using FDG-PET. Hinyokika Kiyo. 2000;46:851–853. [PubMed] [Google Scholar]
- 11.Oyama N, Akino H, Suzuki Y, Kanamaru H, Ishida H, Tanase K, et al. FDG PET for evaluating the change of glucose metabolism in prostate cancer after androgen ablation. Nucl Med Commun. 2001;22:963–969. doi: 10.1097/00006231-200109000-00004. [DOI] [PubMed] [Google Scholar]
- 12.Chang CH, Wu HC, Tsai JJ, Shen YY, Chanqlai SP, Kao A. Detecting metastatic pelvic lymph nodes by 18F-2-deoxyglucose positron emission tomography in patients with prostate-specific antigen relapse after treatment for localized prostate cancer. Urol Int. 2003;70:311–315. doi: 10.1159/000070141. [DOI] [PubMed] [Google Scholar]
- 13.Jadvar H, Pinski JK, Conti PS. FDG PET in suspected recurrent and metastatic prostate cancer. Oncol Rep. 2003;10:1485–1488. [PubMed] [Google Scholar]
- 14.Jadvar H, Xiankui L, Shahinian A, Park R, Tohme M, Pinski J, et al. Glucose metabolism of human prostate cancer mouse xenografts. Mol Imaging. 2005;4:91–97. doi: 10.1162/15353500200505118. [DOI] [PubMed] [Google Scholar]
- 15.Sung J, Espiritu JI, Segall GM, Terris MK. Fluorodeoxyglucose positron emission tomography studies in the diagnosis and staging of clinically advanced prostate cancer. BJU Int. 2003;92:24–27. doi: 10.1046/j.1464-410x.2003.04297.x. [DOI] [PubMed] [Google Scholar]
- 16.Schoder H, Herrmann K, Gonen M, Hricak H, Eberhard S, Scardino P, et al. 2-[18F]fluoro-2-deoxyglucose positron emission tomography for detection of disease in patients with prostate-specific antigen relapse after radical prostatectomy. Clin Cancer Res. 2005;11:4761–4769. doi: 10.1158/1078-0432.CCR-05-0249. [DOI] [PubMed] [Google Scholar]
- 17.Larson SM, Morris M, Gunther I, Beattie B, Humm JL, Akhurst TA, et al. Tumor localization of 16beta-18F-fluoro-5aplpha-dihyrotestosterone versus 18F-FDG in patients with progressive, metastatic prostate cancer. J Nucl Med. 2004;45:366–373. [PubMed] [Google Scholar]
- 18.Ludwig V, Hopper OW, Martin WH, Kikkawa R, Delbeke D. [18F]fluorodeoxyglucose positron emission tomography surveillance of hepatic metastases from prostate cancer following radiofrequency ablation: a case report. Am Surg. 2003;69:593–598. [PubMed] [Google Scholar]
- 19.Morris MJ, Akhurst T, Osman I, Nunez R, Macapinlac H, Siedlecki K, et al. Fluorinated deoxyglucose positron emission tomography imaging in progressive metastatic prostate cancer. Urology. 2002;59:913–918. doi: 10.1016/s0090-4295(02)01509-1. [DOI] [PubMed] [Google Scholar]
- 20.Morris MJ, Akhurst T, Larson SM, Ditullio M, Chu E, Siedlecki K, et al. Fluorodeoxyglucose positron emission tomography as an outcome measure for castrate metastatic prostate cancer treated with antimicrotubule chemotherapy. Clin Cancer Res. 2005;11:3210–3216. doi: 10.1158/1078-0432.CCR-04-2034. [DOI] [PMC free article] [PubMed] [Google Scholar]
- 21.Oyama N, Kim J, Jones LA, Mercer NM, Engelbach JA, Sharp TL, et al. MicroPET assessment of androgenic control of glucose and acetate uptake in the rat prostate and a prostate cancer tumor model. Nucl Med Biol. 2002;29:783–790. doi: 10.1016/s0969-8051(02)00346-3. [DOI] [PubMed] [Google Scholar]
- 22.Bucerius J, Ahamadzadehfar H, Hortling N, Joe AY, Palmedo H, Biersack HJ. Incidental diagnosis of a PSA-negative cancer by (18)FDG PET/CT in a patient with hypopharyngeal cancer. Prostate Cancer Prostatic Dis. 2007;10:307–310. doi: 10.1038/sj.pcan.4500959. [DOI] [PubMed] [Google Scholar]
- 23.Agus DB, Golde DW, Squouros G, Ballanqrud A, Cordon-Cardo C, Scher HI. Positron emission tomography of a human prostate cancer xenograft: association of changes in deoxyglucose accumulation with other measures of outcome following androgen withdrawal. Cancer Res. 1998;58:3009–3014. [PubMed] [Google Scholar]
- 24.Oyama N, Akino H, Suzuki Y, Kanamaru H, Miwa Y, Tsuka H, et al. Prognostic value of 2-deoxy-2-[F-18]fluoro-d-glucose positron emission tomography imaging for patients with prostate cancer. Mol Imaging Biol. 2002;4:99–104. doi: 10.1016/s1095-0397(01)00065-6. [DOI] [PubMed] [Google Scholar]
- 25.Zasadny KR, Wahl RL. Standardized uptake value of normal tissues at PET with 2-[fluorine-18]-fluoro-2-deoxy-d-glucose: variations with body weight and a method for correction. Radiology. 1993;189:847–850. doi: 10.1148/radiology.189.3.8234714. [DOI] [PubMed] [Google Scholar]
- 26.Takahashi N, Inoue T, Lee J, Yamaguchi T, Shizukuishi K. The roles of PET and PET/CT in the diagnosis and management of prostate cancer. Oncology. 2007;72:226–233. doi: 10.1159/000112946. [DOI] [PubMed] [Google Scholar]
- 27.Pound CR, Partin AW, Eisenberger MA, Chan DW, Pearson JD, Walsh PC. Natural history of progression after PSA elevation following radical prostatectomy. JAMA. 1999;281:1591–1597. doi: 10.1001/jama.281.17.1591. [DOI] [PubMed] [Google Scholar]
- 28.Etchebehere EC, Macapinlac HA, Gonen M, Humm K, Yeung HW, Akhurst T, et al. Qualitative and quantitative comparison between images obtained with filtered back projection and iterative reconstruction in prostate cancer lesions of 18F-FDG PET. Q J Nucl Med. 2002;46:122–130. [PubMed] [Google Scholar]
- 29.Turlakow A, Larson SM, Coakley F, Akhurst T, Gonen M, Macapinlac HA, et al. local detection of prostate cancer by positron emission tomography with 2-fluorodeoxyglucose: comparison of filtered back projection and iterative reconstruction with segmented attenuation correction. Q J Nucl Med. 2001;45:235–244. [PubMed] [Google Scholar]
- 30.Fan C, Hernandez-Pampaloni M, Houseni M, Chamroonrat W, Basu S, Kumar R, et al. Age-related changes in the metabolic activity and distribution of the red marrow as demonstrated by 2-deoxy-2-[F-18]fluoro-d-glucose-positron emission tomography. Mol Imaging Biol. 2007;9:300–307. doi: 10.1007/s11307-007-0100-9. [DOI] [PubMed] [Google Scholar]
- 31.Wang Y, Chiu R, Rosenberg J, Gambhir SS. Standardized uptake value atlas: characterization of physiological 2-deoxy-2-[18F]fluoro-d-glucose uptake in normal tissues. Mol Imaging Biol. 2007;9:83–90. doi: 10.1007/s11307-006-0075-y. [DOI] [PubMed] [Google Scholar]
- 32.Well D, Yang H, Houseni M, Iruvuri S, Alzeair S, Sansovini M, et al. Age-related structural and metabolic changes in the pelvic reproductive end organs. Semin Nucl Med. 2007;37:173–184. doi: 10.1053/j.semnuclmed.2007.01.004. [DOI] [PubMed] [Google Scholar]
- 33.Pugachev A, Ruan S, Carlin S, Larson SM, Campa J, Ling CC, et al. Dependence of FDG uptake on tumor microenvironment. Int J Radiat Oncol Biol Phys. 2005;62:545–553. doi: 10.1016/j.ijrobp.2005.02.009. [DOI] [PubMed] [Google Scholar]


