

Abstract
The excitatory amino acid glutamate plays an important role in the development of neuronal sensitization and the ionotropic N-methyl-d-aspartate receptor (NMDAR) is one of the major receptors involved. The objective of this study was to use a cat model of gastroesophageal reflux disease (GERD) to investigate the expression of the NR1 and NR2A subunits of NMDAR in the vagal and spinal afferent fibers innervating the esophagus. Two groups of cats (Acid-7D and PBS-7D) received 0.1 N HCl (pH 1.2) or 0.1 M PBS (pH 7.4) infusion in the esophagus (1 ml/min for 30 min/day for 7 days), respectively. NR1 splice variants (both NH2 and COOH terminals) and NR2A in the thoracic dorsal root ganglia (DRGs), nodose ganglia (NGs), and esophagus were evaluated by RT-PCR, Western blot, and immunohistochemistry. Acid produced marked inflammation and a significant increase in eosinophil peroxidase and myeloperoxidase contents compared with PBS-infused esophagus. The NR1-4 splice variant gene exhibited a significant upregulation in DRGs and esophagus after acid infusion. In DRGs, NGs, and esophagus, acid infusion resulted in significant upregulation of NR1 and downregulation of NR2A subunit gene expression. A significant increase in NR1 polypeptide expression was observed in DRGs and NGs from Acid-7D compared with control. In conclusion, long-term acid infusion in the cat esophagus resulted in ulcerative esophagitis and differential expressions of NR1 and NR2A subunits. It is possible that these changes may in part contribute to esophageal hypersensitivity observed in reflux esophagitis.
Keywords: esophagus, dorsal root ganglia, nodose ganglia, esophagitis, NMDA receptor subunit
neuronal sensitization is an important underlying mechanism that can result in visceral hypersensitivity. For example, acid exposure alters primary sensory neurons innervating the gut and results in enhanced responsiveness of spinal neurons and gastrointestinal hypersensitivity (19, 22). Several molecular targets have been proposed as key players in the induction and maintenance of central and peripheral sensitization including the N-methyl-d-aspartate receptors (NMDAR), transient receptor potential vanilloid 1, acid-sensing ion channels, and TTX-resistant Na channels (1, 2, 5a, 16, 17, 20, 29). The NMDAR, in particular, are believed to be involved in synaptic transmission between primary afferents and dorsal horn neurons (16, 34), in addition to their participation in central sensitization in spinal neurons. These receptors have not only been shown to be present in the peripheral terminals of visceral primary afferents supplying the gastrointestinal tract and other hollow viscera, but their involvement in release of specific neurotransmitters during pain transmission at both the peripheral and central terminals of the sensory neurons has also been clearly documented (30).
The NMDAR are ligand-gated ion channels that have an important role in both the transduction of noxious mechanical stimuli as well as in the development of central sensitization. These receptors have been shown to contribute to colonic inflammation-evoked hyperalgesia and dorsal horn neuron hyperexcitability (25, 37). “Wind-up” of spinal neurons to somatic nociceptive stimuli and long-term potentiation due to synaptic plasticity between primary afferents and dorsal horn neurons are believed to be largely mediated by NMDAR (5, 9, 12, 27, 36). The NMDAR are ionotropic glutamate receptors characterized by slow desensitization and high Ca2+ permeability (13). They are composed of heteromeric combinations of NMDAR subunit 1 (NR1) and NMDAR 2 subunits (NR2A-D). Although the NR1 subunit is a glycine binding site and universally expressed in all NMDAR, the NR2 is the glutamate-binding subunit and is the major molecular determinants of the functional diversity. More recently, functional expression of NR2B-containing NMDAR have been predominantly been found on the soma of dorsal root ganglia, suggesting that NR2B subunits are of particular importance for pain perception (28).
Previous studies indicate that the NMDAR subunit composition vary not only with the type of insult but also with the duration of injury and inflammation (3, 4, 23). The differential expression of the NR1 component both developmentally and regionally affects many aspects of the channel's function such as ligand binding, membrane expression, phosphorylation, and downstream signaling (7). The mRNA encoding the NR1 subunit is alternatively spliced to create eight possible splice variants by inclusion and exclusion of three exons: N1 (exon 5), C1 (exon 21), and C2 (exon 22). Recent studies have documented an increase in the expression of NR1 splice variants as a result of inflammation, further implicating the NMDAR in the development of hypersensitivity following an inflammatory process (10, 47).
Gastroesophageal reflux disease (GERD) is one of the most common gastrointestinal disorders in humans and can be associated with esophagitis and hypersensitivity. Fass and colleagues (14) have recently demonstrated a significant correlation between the chemosensitivity of primary afferents and reflux symptoms with the degree of endoscopically observed tissue injuries in GERD patients. A recent study in humans also demonstrates that acute acid induction results in esophageal hypersensitivity that could be prevented by intravenous administration of the NMDAR antagonist ketamine, further suggesting the involvement of NMDAR in gastroesophageal reflux-induced esophageal hypersensitivity (45). Although these receptors have been implicated in the development of hypersensitivity following acid exposure in humans, very little is known about the receptor expression and its subunit composition following chronic acid-induced esophagitis. Understanding these alterations may provide insight into the pathophysiology of GERD and potentially aid in targeting future pharmacological interventions to either prevent or treat pathological GERD.
The present study was undertaken to investigate alterations in the NMDAR subunit expression following acid-induced esophagitis in cats. The expression profiles of NR1 and NR1 splice variants (NR1-1, NR1-2, NR1-3, NR1-4, and NR1a/b) and NR2A subunit were evaluated in the thoracic dorsal root ganglia (DRGs, T1–T3), nodose ganglia (NGs), and the distal esophagus of cats following esophageal acid infusion (25, 46).
METHODS
All protocols were approved by the Animal Care and Use Committee at the Medical College of Wisconsin and are in accordance with the International Association of Pain policies on the use of laboratory animals.
Surgery.
Cats of either sex weighing 2–4 kg were anesthetized by intraperitoneal injection of ketamine (10 mg/kg) and xylazine (5 mg/kg). Prior to surgery, all animals received the antibiotic (Baytril, 5 mg/kg im) to prevent infection and following surgery daily for 7 days. A small incision was made in the ventral side of the neck to expose the cervical esophagus and an infusion catheter was implanted 4–5 cm below the upper esophageal sphincter. The other end of the catheter was externalized subcutaneously through the dorsal aspect of the neck and sealed with a plastic plug for later access. The incision was sutured in layers using 4-0 silk and animals were observed postsurgery until complete recovery from anesthesia. In this study we have used ketamine only at the time of surgery to implant the infusion catheter into the esophagus. After surgery the animals were kept under observation until full recovery and all the experimental protocols were carried out 3–4 wk after implantation of the infusion catheter. The acid and PBS were infused into the animals through the infusion catheter under fully awake condition. For extraction of the esophagus, DRGs, and NGs, all cats were deeply anesthetized with pentobarbital sodium (Nembutal, 20 mg/kg ip) and were perfused transcardially with either PBS (pH 7.4, for gene expression, Western blot, and enzyme assay) or 4% paraformaldehyde (for histology and immunohistochemistry).
Experimental protocol.
Two groups of cats were used (n = 9 in each group). One group was given 0.1 N HCl (pH 1.2) under awake conditions through the infusion catheter over 30 min (1 ml/min) for 7 consecutive days (Acid-7D) whereas the control group received 0.1 M PBS (pH 7.4) for 7 days at a similar rate (PBS-7D). The esophageal tissues from both groups of cats were used for hematoxylin and eosin (H&E) staining, eosinophil peroxidase (EPO) staining, and quantitative estimation of myeloperoxidase (MPO) and EPO. Furthermore, the NMDAR expression at the mRNA and protein levels in the thoracic DRGs (T1–T3) nodose ganglia, and distal esophagus was compared between both groups of animals.
H&E staining of the esophageal tissues.
An independent observer blinded to the groups determined the extent of mucosal damage in the esophagus. The criteria for macroscopic scoring included the presence of hyperemia, edema, erosions, ulcers, and intramural hemorrhage. The tissue sections of 5-μm thickness taken from the proximal, middle, and distal esophagus were stained with H&E and examined for different degrees of epithelial loss (e.g., splitting, erosion, and ulceration), reactive epithelial changes (e.g., basal hyperplasia and vascular alteration including edema, congestion, bleeding, vessel lesions) and inflammation (i.e., the presence of polymorphonuclear leukocytes, lymphocytes).
EPO staining of the esophageal tissues.
Eosinophilic infiltration was studied by microscopic examination after staining for EPO using 3,3′-diaminobenzidine tetrahydrochloride (DAB; Sigma). The sections were incubated initially with 10 mM cyanide buffer and rinsed in PBS, followed by incubation with peroxidase substrate DAB for 10 min at room temperature. The slides were rinsed thoroughly with water and coverslipped before examination under the microscope.
Esophageal EPO and MPO assay.
To detect the degree of tissue inflammation, EPO and MPO contents of esophageal tissues from the acid-treated cats (Acid-7D) were assayed and compared with those of the PBS-treated cats (PBS-7D). MPO is a constitutive enzyme found in the intracellular granules of neutrophils and can be used as a marker for inflammation. Similarly, EPO is a marker for infiltrating eosinophils in the esophagus. The tissues were kept frozen (−70°C) until used for extraction. The tissue samples were placed in plastic test tubes (17 × 100 mm), and 1 ml of cetyltrimethylammonium chloride (0.5% in distilled water) was added to each sample and homogenized with a polytron tissue homogenizer for 15 s. The homogenates were centrifuged at 10,000 g for 10 min at 4°C and the clear supernatants were used for the assay. The extract was diluted 1/10 in 50 mM HEPES, pH 8.0 (EPO dilution buffer) or 10 mM citrate buffer pH 5.0 (MPO dilution buffer). For MPO assay, the substrate O-dianisidine (16.7 mg) was dissolved in 90 ml of distilled water followed by 10 ml of potassium phosphate buffer (pH 6.0), 120 mM resorcinol, and 50 μl of freshly prepared H2O2 (1%). An aliquot of 14 μl of each sample was used for the microtiter plate assay, and 200 μl of O-dianisidine solution was added to each well immediately prior to reading the plate. For EPO estimation, the substrate O-phenylene diamine (3 mM) was prepared in 50 mM HEPES, pH 8.0, along with 6 mM KBr and 8 mM H2O2. The appearance of the yellow color compound over time was measured with a spectrophotometer to determine the MPO and EPO contents of the tissues. The color development was measured as an absorbance at 460 nm for MPO over a period of 5 min. The MPO activity of the tissue samples was calculated on the basis of the change in absorbance per minute. The change in absorbance for 1 μmol H2O2 split is 1.13 × 10⁻² and the MPO content of the samples was calculated on the basis of the following formula: 1 unit of MPO = 1 μmol H2O2 split. For EPO content, the color development was measured at 490 nm and the intensity of the color development was directly proportional the EPO content of the tissues.
NR1 splice variant gene expression in the thoracic DRGs, NGs, and distal esophagus.
RT-PCR analysis was performed in neuronal tissues (DRGs, NGs) and the distal esophagus to examine mRNA expression level of NMDAR subunits in experimental and control animals. We used semiquantitative RT-PCR analysis for studying the expression pattern of NR1 splice variants instead of real-time PCR because the sizes of the amplified products were larger, in the range of 200–400 bp (as designed based on the available rat sequences). Animals in each group were euthanized with Nembutal (20 mg/kg ip), and the DRGs (T1–T3), NGs, and distal esophagus were removed. Total RNA was extracted by use of Aurum total RNA fatty and fibrous tissue kit from Bio-Rad (Hercules, CA). Each RNA preparation was subjected to DNase treatment to remove the contaminated genomic DNA and reverse transcription was performed by using SuperScript first-strand synthesis kit (Invitrogen, Carlsbad, CA). For each tissue sample, we carried out the RT reaction without the enzyme reverse transcriptase and used the cDNA preparation for PCR reactions with different primer sets to rule out the genomic DNA contamination in total RNA preparation. Primer sequences used for NR1 splice variants are shown in Table 1 (25). Since the complete nucleotide sequences for cat NR1 and its splice variants are not available in the GenBank, we used rat sequences for designing the primers for PCR amplification of the NR1 splice variants and performed regular RT-PCR for semiquantitative estimation of the mRNA expression in the cat tissues. The specificity of the primers used was tested by carrying out PCR reaction using rat and cat brain stem cDNA preparation as templates and compared the NR1 splice variant expression in these animals. PCR reactions were performed in a total volume of 25 μl containing 2 μg of cDNA template, 100 picomoles sense and antisense primers, 1.5 mM MgCl2, 2.5 mM dNTPs, and 2.5 U Taq DNA polymerase in a Bio-Rad iCycler. Samples were heated to 96°C for 4 min and subjected to 30 cycles of amplification (40 s at 95°C, 40 s at 60°C, and 60 s at 72°C) followed by 7 min at 72°C for final extension. The PCR setup was carried out in a single tube (target and reference genes were detected in separate reaction tubes). PCR products were electrophoresed in 1.5% agarose gel and viewed by ethidium bromide staining under UV light. The intensity of the bands on gel was determined by densitometric scanning.
Table 1.
RT-PCR primers for NR1 and NR1 splice variants
| NR1 Amplicon Outside COOH-Terminal Exons | Exons | Product | |
|---|---|---|---|
| NR1-1 forward | 5′ GGCAGTAAACCAGGCCAATA 3′ | 184 bp | |
| NR1-1 reverse | 5′ GTGGGAGTGAAGTGGTCGTT 3′ | ||
| NR1 splice variants | |||
| Common forward primer | 5′ CCACGGGTGAGCTGTTCTTC 3′ | ||
| NR1-1 reverse | 5′ CCCGGTGCTCGTGTCTTTGG 3′ | +21, +22 | 456 bp |
| NR1-2 reverse | 5′ CCGGTGCTCTGCAGGTTCTTC 3′ | −21, +22 | 355 bp |
| NR1-3 reverse | 5′ TGGGATGGTACTGCGTGTCT 3′ | +21, −22 | 471 bp |
| NR1-4 reverse | 5′ GATGGTACTGCTGCAGGTTCTT 3′ | −21, −22 | 357 bp |
| NR1 a/b forward | 5′ CAGCGTCTGGTTTGAGATGA 3′ | a: −5 | a: 180 bp |
| NR1 a/b reverse | 5′ AGCAGAGCCGTCACATTCTT 3′ | b: +5 | b: 243 bp |
| rRNAF1 forward | 5′ TCAAGAACGAAGTCGGAGG 3′ | 498 bp | |
| rRNAR1 reverse | 5′ GGACATCTAAGGGCATCACA 3′ | ||
| rRNAF2 forward | 5′ GACCATAAACGATGCCGACT 3′ | 204 bp | |
| rRNAR2 reverse | 5′ GTGAGGTTTCCCGTGTTGAG 3′ | ||
| Real-time PCR primers for NR1 and NR2A subunits | |||
| RNR1-1 forward | 5′ CGAGAAGGAGAACATCAC 3′ | 103 bp | |
| RNR1-1 reverse | 5′ ATACTTGGAAGACATCAGC 3′ | ||
| RNR2A forward | 5′ GGCACGCTACAGAGACTC 3′ | 129 bp | |
| RNR2A reverse | 5′ GCACTCCTACGACAACATTC 3′ | ||
Quantitative evaluation of NR1 and NR2A subunits gene expression in thoracic DRGs (T1–T3), NGs, and esophagus.
We used real-time RT-PCR for accurate quantification of the target gene. The method was based on measurement of the PCR product during the amplification thermocycles by using SYBR Green fluorescent dye. A threshold for detection of the PCR product was set within the exponential interval of PCR amplification and was measured as CT, the number of PCR cycles required to obtain this threshold. Initially we designed rat-specific NR2 subunit primers for quantitative estimation of NMDAR subunit expression in cat. However, except for NR2A none of the subunits, namely NR2B, NR2C, and NR2D, exhibited PCR amplification with use of cat brain stem cDNA, thereby indicating a distinct difference in NR2 subunit sequences between cat and rat. The NMDA receptor subunits NR1 and NR2A from both rat and human show 90% sequence homology; therefore the sequences are highly conserved between these two species. Moreover, we have used NR1 antibody for Western blots and immunohistochemistry that could recognize NMDA receptor subunits from both the species. We also subjected both rat and human NR2A sequences to blast search against the available cat gene sequences in the GenBank (the cat sequences by whole genome shotgun sequence), and we observed a significant sequence homology for NR2A with one gene from the cat database (Felis catus contl.148516). Cat NMDA subunit genes have not yet been characterized, but this high sequence homology indicates the possibility of conserved sequences between cat and other available sequences in the GenBank. For the present study we designed the NR2A primers from this conserved sequence regions. The primer sets have been designed using Beacon Designer program (Premier BioSoft International, Palo Alto, CA). Therefore, we examined the effect of chronic esophageal acid exposure on NR1 and NR2A subunit gene expression in cat and NR1 and NR2A primers designed for real-time PCR are shown in Table 1.
The PCR reactions were performed by use of iQ SYBR Green Supermix (Bio-Rad). We used 5 pmol forward and reverse primers and 2 μl cDNA from each tissue sample as template in a total of 25 μl of the reaction mixture. PCR reaction were carried out in 96-well microtiter plates, and the samples were incubated for 3 min at 95°C and were amplified for 45 cycles of 30 s at 95°C and 30 s at 57.4°C. To verify the amplification efficiency within each experiment, a serial dilution of cDNA derived from a RNA pool of control tissues was amplified in triplicate in each plate. The specificity of PCR reaction and possibility of primer dimerization were verified by using a melting curve program and no template control for each PCR reaction. Since all PCR reactions were performed with equal efficiencies, relative mRNA expression level of the target gene was directly normalized against the expression level of reference gene rRNA for the same tissue sample. The CT values for reference gene rRNA was highly reproducible between samples and between PCR reactions. The cDNA preparation with CT values <35 was considered as specific implication and reactions with Ct values >35 were not included in the study. Results were expressed as relative mRNA expression in terms of CT values in relation to the amount of reference gene mRNA expression by using the formula 2−(CTtarget − CTrRNA).
Western blot analysis of NR1 subunit protein expression in thoracic DRGs (T1–T3), NGs and distal esophagus.
Crude extracts from various cat and rat tissues were prepared by powderizing the tissues in liquid nitrogen and homogenization in ice-cold hypotonic lysis buffer (10 mM Tris·HCl, 5 mM EDTA, pH 8.0) containing protease inhibitor cocktail tablet (Complete Mini, Roche Diagnostics, Indianapolis, IN) and phosphatase inhibitor cocktail (Thermo Scientific, Rockford, IL), followed by differential centrifugation first at 1,200 rpm for 30 min and then for another 30 min at 14,000 rpm. The membrane pellet was solubilized for 30 min on ice with RIPA buffer (150 mM NaCl, 50 mM Tris·HCl, pH 7.5, 1 mM EDTA, 1 mM PMSF, 1% Triton X-1000, 0.5% Na-deoxycholate, 0.1% SDS containing protease and phosphatase inhibitors). The membrane extracts were centrifuged and assayed for protein content by the bicinchoninic acid (BCA) method (Thermo Fisher Scientific, Rockford, IL). Approximately 25 μg of brain tissue extracts from cat and rat and 50 μg of DRG and NG extracts from cat were electrophoresed on 8% SDS-PAGE and transferred onto nitrocellulose membrane. After transfer, the membrane was blocked with 5% nonfat milk and then probed with antibodies to NMDAR1 subunit (mouse anti-NMDAR1, 1:100, BD Biosciences, San Jose, CA). Protein bands were visualized by using a horseradish peroxidase-conjugated secondary antibody (Jackson ImmununoResearch, West Grove, PA) and an enhanced chemiluminescent detection system (Thermo Scientific). The relative changes in the intensity of NR1 subunit expression in various samples were normalized against the intensity of housekeeping gene β-actin for the same tissue sample by use of alpha imager 3400 software. For NR2A subunit protein analysis, two different antibodies from Alomone Labs (Jerusalem, Israel) and Santa Cruz Biotechnology (Santa Cruz, CA) were used. However, none of the antibodies showed specific reactivity with cat tissues; therefore, NR2A subunit protein analysis was not included in this study.
Immunostaining of NMDAR subunits in DRGs, NGs, and distal esophagus.
Cats from both the groups (Acid-7D and PBS-7D) were deeply anesthetized with pentobarbital sodium (50 mg/kg ip) and the chest was opened by midsternal incision. Animals were perfused transcardially with cold phosphate buffer solution followed by 4% paraformaldehyde in 0.1 M PBS, pH 7.4. Bilateral thoracic (T1–T3) DRGs, NGs, and esophagi were collected and incubated in 4% paraformaldehyde overnight at 4°C. Tissue samples were cleaned of connective tissues and cryoprotected in 20% sucrose in 0.1 M PBS for 24 h. Thereafter, the tissues were embedded in HistoPrep (Fisher Scientific, Pittsburgh, PA), and serial sections of 20-μm thickness were cut on a cryostat. For immunostaining, sections were rehydrated in PBS and nonspecific sites were blocked by incubating the sections in PBS containing 10% normal goat serum (NGS), 0.5% Triton X-100, and 0.1% sodium azide for 60 min at room temperature. For double immunofluorescence staining with NR1 and substance P (SP) antibodies, sections were incubated with a mixture of rabbit anti-NR1 antibody (1:100; Alomone Labs) and guinea pig anti-SP antibody (1:500; Chemicon International, Temecula, CA) overnight at 4°C. The antibody dilution was carried out in PBS containing 3% NGS, 0.3% Triton X-100, and 0.1% azide (antibody diluent). After four washes with PBS containing 0.1% Triton X-100, 0.1% NGS, and 0.01% azide, sections were incubated at room temperature for 2 h with fluorescence-labeled secondary antibodies. Various secondary antibodies used were Alexa 488-conjugated goat anti-guinea pig antibody (1:500) and Alexa 568-conjugated goat anti-rabbit antibody (1:2,000). All the secondary antibodies used in this study were purchased from Molecular Probes (Invitrogen). The specificity of the primary antibodies was assessed by preincubating the antibody overnight at 4°C with the immunizing peptides (10 μM) prior to the application to the sections. Tubes containing exactly the same dilution of antibody but without any addition of peptides were incubated in parallel. The absorbed and nonabsorbed antibodies were incubated with the DRG and NG sections for 24 h at 4°C. Some sections in every run were also incubated with either PBS or normal rabbit serum instead of primary antibody and processed further following the protocol as mentioned above. For esophageal tissues, most of these antibodies exhibited a high background staining. The high background staining without specific immunoreactivity for the esophageal tissues could be due to low level of expression of NMDA receptor subunits in the esophageal tissues, and the immunostaining procedure used in this study may not be sensitive enough to detect the antibody bindings of the receptor subunits in the esophageal tissues. Therefore, no esophageal immunostaining was included in this study. Hence, NR1 immunostaining of DRG and NG tissues from the control and acid-treated groups was reported in this study.
Slides were examined under a fluorescence microscope (Nikon Eclipse 50i) using narrow band cubes for Alexa 488 (DM505, excitation filter 470–490, barrier filter 515–550 nm) and Alexa 568 (DM 568, excitation filter 540–560, barrier filter 575–645 nm). Images were captured with a Spot II high-resolution digital camera (Diagnostic Instruments, Sterling Heights, MI) and processed with the Adobe Photoshop program. Each color of double-labeled DRG/NG sections were digitally imaged at ×20 using filter sets for Alexa 488 (green) and Alexa 568 (red). To maintain the consistency of image capturing we used the same time of exposure, gain, and gamma adjustment for the control and the experimental samples for each fluorescence staining. We used the curve program of Adobe Photoshop (CS2) for the background adjustment to enable the counting of total number of cells. For selecting the cells for intensity measurement, we used two selection settings of different width and height for measuring the small-diameter and medium/large-diameter cells. Using these settings, we measured the integrated density of staining for individual cells. To define the cells with positive staining, we set up different cutoffs for integrated density for the small and medium/large-diameter cells based on the background using Image J program (NIH, Bethesda, MD).
The fluorescence images were converted into gray mode. Arbitrary grayscale units (in the range of 1–255) were assigned to quantify the intensity of staining of a given cell. Nonspecific background staining was measured in a similar way by selecting cells with staining below the threshold limit for the positively stained cells. Only cells containing a darker nucleus were selected, and intensity of staining was measured as integrated density for 10 random cells for each DRG and NG section. Three sections from PBS-treated controls and acid-infused experimental groups were used for estimating the intensity of staining and calculated as means ± SE.
RESULTS
Esophageal histology.
H&E staining of tissues from the distal esophagus revealed hyperemia, edema, and superficial epithelial cell loss with isolated erosions, basal cell hyperplasia, and the presence of inflammatory cells in the Acid-7D group (Fig. 1A). In contrast there was no evidence of inflammation in the esophagus of the PBS-7D group (Fig. 1A). In the Acid-7D group, severe mucosal damage (high-grade esophagitis or ulcerative esophagitis) was characterized by extensive epithelial cell loss with erosion/ulceration, edema, and granulation tissue replacing the mucosa with extensive infiltration of neutrophils, eosinophils, and polymorphonuclear leukocytes and lymphocytes. To confirm eosinophilic infiltration in the esophagus, we stained the esophageal tissues for eosinophilic peroxidase. An extensive eosinophilic infiltration was observed around the mucosa and submucosa in the acid-treated group compared with the esophagus of PBS-treated cats (Fig. 1B).
Fig. 1.
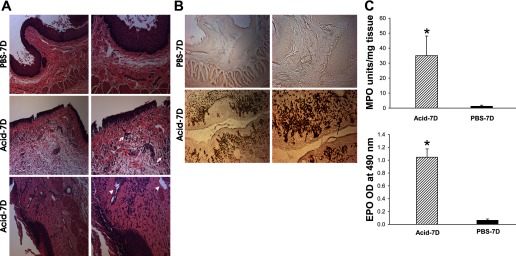
A: tissue histology following esophageal acid treatment. Hematoxylin and eosin (H&E)-stained transverse sections of distal esophagus. Distal esophagi from acid-treated cats exhibited edema of epithelial cell lining and basal cell, lamina propria, and submucosal hyperplasia compared with PBS controls. Chronic acid treatment for 7 consecutive days (Acid-7D) resulted in severe esophagitis (arrows) and ulceration (arrowheads) with marked infiltration of inflammatory cells in the distal esophagus. PBS-7D, chronic control treatment with PBS for 7 days. Left scale bar, 200 μm; right scale bar, 100 μm. B: eosinophil peroxidase (EPO) staining of the esophageal tissues from the acid-treated and PBS-treated cats. Eosinophil infiltration in the esophagus was determined by 3,3′-diaminobenzidine tetrahydrochloride (DAB) staining of cyanide-resistant EPO. An extensive infiltration of eosinophils in the submucosal and mucosal regions was observed in the chronic acid-treated group (arrows) compared with PBS controls. Left scale bar, 100 μm; right scale bar, 50 μm. C: quantitative estimation of MPO and EPO contents of the esophageal tissues from acid-treated and PBS-treated groups (n = 3/group). MPO content of the tissues was measured as MPO units per mg of tissue. A significant increase in MPO activity was observed in acid-treated esophagi compared with PBS-treated controls (*P < 0.05). Quantitative estimation of EPO content (OD at 490 nm expressed as means ± SE) was measured by ELISA. A significant increase in EPO activity was observed in acid-treated groups compared with PBS-treated controls (*P < 0.01).
Esophageal MPO and EPO assay.
We examined the neutrophilic involvement in the esophagus of both groups by measuring the MPO activity in esophageal tissues. The esophagus of cats in the Acid-7D group demonstrated a significant increase in MPO content compared with PBS-7D (Fig. 1C, P < 0.01). These cats showed 35-fold increase in MPO units (35 ± 13.07 MPO units/mg tissue) compared with PBS-7D cats (1.306 ± 0.615 MPO units/mg tissue). Similarly, quantitative estimation of EPO as measured by ELISA absorbance at 490 nm showed a significant increase in the acid-treated group compared with PBS-treated controls (*P < 0.01, Fig. 1C).
NR1 splice variant gene expression in DRGs, NGs, and esophagus.
To examine the specificity of amplified PCR products of cat cDNAs using rat specific NR1 splice variant primers, we carried out PCR reactions of these primer sets using cat brain stem cDNA as a template and compared amplified products with those obtained from the PCR with rat brain stem cDNA. With cat brain stem cDNA, distinct PCR amplified products were obtained for both NH2-terminal variants NR1-a and NR1-b and COOH-terminal variants NR1-1, NR1-3, and NR1-4. The sizes of the PCR products were comparable to that obtained from the PCR reaction with rat brain stem cDNA (Fig. 2) and also to the predicted sizes (Table 1). However, no PCR amplification was observed for NR1-2 in cat brain stem tissue, indicating either very poor expression of NR1-2 splice variant in cat or a gene sequence different from that of the rat sequence.
Fig. 2.

PCR amplification specificity of the NR1 and NR1 splice variant expression in cat tissues using primers designed based on the available rat gene sequences in the GenBank. The primer sequences used are shown in Table 1. Except for NR1-2 variant (−exon21, +exon 22), rat-specific primers for the remaining COOH-terminal variants and both the NH2-terminal variants exhibited PCR amplification in cat brain stem, and the size of the amplification products were comparable in cDNA from both cat and rat brain stems.
After evaluating the specificity of the amplified products, we used these NR1 primer sets for PCR amplification with cDNA preparations from DRGs (T3), NGs, and distal esophagus from PBS and acid-treated cats. Primers used for the amplification of six splice variants are shown in Table 1. In DRGs of PBS-infused cats, out of six NR1 splice variants, NR1-a (−exon 5) and NR1-2 (−exon 21, +exon 22) failed to show amplification (Fig. 3A). The COOH-terminal splice variant NR1-4 showed the strongest expression. Acid infusion resulted in significant increase in the expression of NR1-b and NR1-4 variants (Fig. 3B, *P < 0.05, **P < 0.001 vs. PBS group). Interestingly, the NR1 mRNA expression (with primers designed outside the region of exons 5, 21, and 22) also significantly increased in DRGs from Acid-7D cats compared with PBS-7D (P < 0.05 vs. PBS). There appear to be distinct differences in the expression profile of NR1 splice variant mRNAs in NGs compared with DRGs (Fig. 4A). The major splice variants in NGs from PBS-7D cats were NR1-a, NR1-b, NR1-1, NR1-3, and NR1-4. No amplification was observed for NR1-2. Interestingly, acid exposure resulted in a significant increase of NR1 (P < 0.05 vs. PBS- infused cat) and a marked downregulation of NR1-4 splice variants compared with PBS control, although the difference was not statistically significant (Fig. 4B). In esophageal tissues from PBS −7D cats, we failed to detect the expression of any of the six splice variants and found only a very low expression of NR1 (Fig. 5A). However, in esophageal tissues from Acid-7D cats a significantly high expression was observed for NR1 and NR1-4 (Fig. 5B, P < 0.05 vs. PBS-7D).
Fig. 3.

NR1 and NR1 splice variants’ expression in the thoracic T1–T3 dorsal root ganglia (DRGs). The relative changes in NR1 splice variant expression in cats receiving either acid or PBS was determined by semiquantitative RT-PCR amplification of RNA isolated from thoracic T3 DRGs. A: staining patterns (n = 3 cats/group) were NR1 splices with or without NH2-terminal exon 5 (NR1-a/b), COOH-terminal exons 21 and 22 (NR1-1, NR1-2, NR1-3, NR1-4) in acid- and PBS-treated cats. B: intensity of expression for each gene product was normalized against rRNA expression. Values are expressed as means ± SE of 3 RT-PCR determinations (*P < 0.05, and **P < 0.001). MW; molecular weight.
Fig. 4.

NR1 and NR1 splice variant expression in the nodose ganglia (NGs). Relative changes in NR1 splice variant expression in cats receiving either acid or PBS were determined by semiquantitative RT-PCR amplification. A: staining pattern of NR1 variants and housekeeping gene rRNA in the NGs of PBS- and acid-treated cats. B: intensity of expression for each gene product was normalized against rRNA expression, and cDNA preparations from 3 animals per group were used in this study. Values are expressed as means ± SE of 3 RT-PCR determinations (*P < 0.05).
Fig. 5.

NR1 and NR1 splice variant expression in the esophagus. Relative changes in NR1 splice variant expression in cats receiving either acid or PBS were determined by semiquantitative RT-PCR amplification. A: staining pattern of NR1 variants and housekeeping gene rRNA in the esophagus from PBS- and acid-treated cats. B: intensity of expression for each gene product was normalized against rRNA expression, and cDNA preparations from 3 animals per group were used in this study. Values are expressed as means ± SE of 3 RT-PCR determinations (*P < 0.05).
Quantitative estimation of NR1 and NR2A subunit gene expression in NGs, DRGs, and esophagus.
The quantitative NR1 mRNA expression in DRGs, NGs, and distal esophagus for PBS- and acid-treated cats as determined by real-time PCR is shown in Fig. 6A. For PBS-7D cats, the relative expression of NR1 was the highest in the NGs followed by DRGs and the lowest in the esophagus. The quantitative analysis of the expression profile of NR1 subunits in the DRGs, NGs, and esophagus exhibited a significant upregulation of NR1 subunits in these tissues after acid infusion (esophagus, P < 0.05; DRGs, P < 0.001; NGs, P < 0.001 vs. PBS-7D). The sizes of the amplified products were in the range of 200 to 100 bp (Table 1). In real-time PCR, the highest expression of NR2A subunit was observed in NGs followed by esophagus and DRG, respectively (Fig. 6B). However, in the acid-treated group, a significant downregulation of NR2A subunit gene expression was observed in esophagus and DRG (Fig. 6B, P < 0.05 vs. PBS-7D).
Fig. 6.

Real-time RT-PCR for NR1 and NR2A subunits in thoracic T1–T3 DRGs, NGs, and distal esophagus (ESO) from acid- and PBS-treated cats. A: cDNAs were amplified by using primers for NR1 or for the reference rRNA. B: cDNAs were amplified using primers for NR2A or for the reference rRNA. ΔCT, difference between the number of cycles necessary to detect the PCR products of the experimental genes and the reference gene. Ordinate value (2ΔCT) corresponds the amount of NR1 or NR2A subunit mRNA relative to the reference gene in the tissue sample. Values are expressed as means ± SE of 3 real-time PCR determinations. The expression of NR1 subunit significantly increased, whereas NR2A subunit expression significantly decreased in DRGs and esophagus of acid-treated cats compared with PBS-treated cats (*P < 0.05 vs. PBS-treated cats).
Western blot analysis of NR1 subunit polypeptide expression in NGs and DRGs.
In Western blot, we analyzed two protein extracts each from both rat and cat brain stems using rat specific NR1 antibody (Fig. 7A). We have used a monoclonal antibody raised against NMDA-NR1 subunit and generated by using a fusion protein encoding NMDA-NR1 amino acid residues 660–811, representing the intracellular loop between the transmembrane region III and IV not encompassing any splice variant regions. A specific polypeptide band of 120 kDa was identified in cat brain stem, and the size was comparable to the expression pattern in rat tissue extracts, thereby indicating the sequence homology between cat and rat NR1 subunits of NMDAR. By use of this rabbit anti-NR1 antibody, a significant increase in polypeptide level of the NR1 subunit was detected in DRGs and NGs from acid-treated group compared with PBS controls (Fig. 7, B and C, P < 0.05).
Fig. 7.

Effect of chronic acid treatment on the polypeptide level of NR1 subunit. A: Western blot analysis of tissue extracts from both cat and rat brain stems (BS) exhibited a 120-kDa band for NR1 subunit indicating complete homology of NR1 subunit proteins in these 2 different species. B: representative Western blot showing NR1 immunoreactivities in NG and DRG extracts from both acid- and PBS-treated groups. The intensity of NR1 immunoreactivity for different tissues was normalized against the intensity of β-actin expression for the same tissue. C: the relative changes in the NR1 expression were quantified with AlphaImage 3400 software. Results were normalized and the data were expressed as means ± SE (*P < 0.05).
Immunohistochemical analysis of NR1 immunoreactivities in NGs and DRGs.
Immunohistochemical analysis of NR1 staining demonstrated a significant increase in the intensity of NR1 expression in DRGs from Acid-7D cats compared with PBS-7D (Figs. 8A and 9A). The majority of these NR1 expressed cells also showed a high expression of SP indicating NR1 expression was mostly in SP expressing peptidergic C fibers. In DRGs, immunostaining with NR1 antibody preabsorbed with blocking peptide failed to show significant immunoreactivities, indicating the specificity of the reaction (Fig. 8B). The immunostaining using normal rabbit serum as primary antibody also failed to show any specific immunoreactivity in DRG sections (Fig. 8B). In NGs, a marked increase in the intensity of NR1 staining was observed after esophageal acid exposure in Acid-7D group compared with control; however, this was not statistically significant (Figs. 8C and 9B). Unlike DRGs, less than 50% of the NR1 expressing cells in NGs exhibited coexpression of SP, indicating the involvement of other neurotransmitters or cell types in NMDAR-mediated signaling in NGs (Fig. 8C).
Fig. 8.

Photomicrograph of immunoreactivities of NR1 subunit and substance P (SP) in the thoracic T3 DRG and NG. A: immunostained sections (20 μm) of DRG from acid- and PBS-treated cats are represented at left and merged images of NR1 and SP stained sections are shown at right. The majority of (>90%) NR1-positive cells exhibited high expression of SP in the acid-treated cats compared with PBS-treated cats. Arrows indicate some of the small- and medium-diameter cells coexpressing NR1 and SP. B: in DRG, immunostaining with blocking peptide preabsorbed NR1 antibody failed to show significant immunoreactivities, indicating the specificity of the reaction (left). The immunostaining using normal rabbit serum as primary antibody also failed to show any specific immunoreactivities (right). C: immunostained sections (20 μm) of NG from acid- and PBS-treated cats are represented at left and merged images of NR1 and SP stained sections are shown at right. In NGs, <50% of NR1-positive cells exhibited SP immunostaining. Arrowheads indicate the NR1-positive cells not expressing SP and arrows indicate cells coexpressing NR1 and SP. Scale bar, 100 μm.
Fig. 9.

Quantitative analysis of NR1 staining in DRGs and NGs from acid- and PBS-treated cats. The fluorescence images were converted into gray mode. Arbitrary grayscale units (in the range of 1–255) were assigned to quantify the intensity of staining of a given cell. Nonspecific background staining was measured in a similar way by selecting cells with staining below the threshold limit for the positively stained cells. The intensity of staining for 10 individual cells from each group was determined and presented as means ± SE. A: there was significantly greater intensity of NR1 expression in thoracic DRGs following acid treatment compared with PBS-treated cats (P > 0.05). B: the intensity of NR1 expression in NGs from acid-treated and PBS-treated cats.
DISCUSSION
We have shown in the present study that repetitive acid exposure in cats results in tissue damage and inflammatory cell infiltration in the esophagus. This model mimics the findings reported in humans with high-grade esophagitis characterized by severe epithelial injury with erosions, ulceration, and infiltration of polymorphonuclear cells (neutrophil, eosinophils, and lymphocytes). This inflammation is confined primarily in the mucosa, lamina propria, and muscularis mucosa (18, 21, 24). Our results also demonstrated a significant increase in the NR1 subunit of the NMDA gene receptor and overall downregulation of NR2A mRNA in the DRGs, NGs, and esophagus in cats following esophageal acid exposure. These findings are in accordance with our Western blot and immunohistochemical data exhibiting a significant increase in the intensity of NR1 protein immunoreactivity in the DRGs and NGs in the Acid-7D group compared with PBS-7D. To our knowledge this is the first study demonstrating alterations in NMDAR subunit expression as a result of acid-induced esophagitis.
Clinical observations suggest that acid exposure and acid-induced esophagitis may sensitize primary sensory neurons leading to wind-up or sensitization of secondary neurons in the spinal cord and/or brain stem (11, 32, 35, 38, 39). In humans, secondary allodynia of the chest wall and proximal esophagus has been reported following acute acid infusion in the distal esophagus. Furthermore, this hypersensitivity is attenuated by intravenous administration of the NMDAR antagonist ketamine, suggesting that the NMDAR plays an important role in the development of acid-induced hypersensitivity (45). Although studies have documented that ketamine attenuates pain by modulating ionic influx through the NMDA channel and reducing NR1 phosphorylation (42), it requires frequent repeated administration of the drug to maintain analgesia. This is primarily due to short-acting nature and rapid metabolism of the drug by hepatic microsomal enzymes (41). In the present study, ketamine was used in combination with xylazine acutely only one time to induce anesthesia during surgical procedure (see methods). It is very unlikely that such acute use of the drug will leave a long-lasting effect on expressions of NR1 and NR2 subunits. Despite the fact that both experimental (i.e., chronic acid infused) and control (i.e., PBS infused) cats received ketamine and xylazine as anesthetics during the surgical procedure, the expressions of NMDAR subunits are significantly different in acid-treated cats, suggesting that altered expression observed is due to acid and not the influence of ketamine used during surgery.
Several immunohistochemical and molecular studies have investigated NMDAR expression in DRG cell bodies and in vagal afferent neurons projecting from the stomach and duodenum (6, 8, 26, 29, 40). In rats, for example, experimental colitis with TNBS (trinitrobenzene sulfonic acid) results in NMDAR subunit phosphorylation and upregulation in the colon and DRGs (25). Since TNBS-induced colitis results in hypersensitivity even after the inflammation has resolved, it can be speculated that these alterations in NMDAR play an important role in hypersensitivity following inflammation (33).
Among the NR1 splice variants examined in this study, rat specific NR1-2 (−exon C1, +exon C2) primers failed to show PCR amplification in the DRG, NGs, and esophageal tissues, highlighting the differences in NR1 splice variant isoforms between rats and cats. We have demonstrated the expression of NR1-b, NR1-1, NR1-3, and NR1-4 in the PBS-treated DRGs. In the NGs, the NH2-terminal splice variant NR1-a (−exon 5) also showed expression along with the NR1-b, NR1-1, NR1-3, and NR1-4 splices. We did not observe any expression of the NR1 splice variants in the PBS-treated cat esophagus. However, in the acid-treated cats, there was a distinct upregulation of NR1-4 in the esophagus as well as in the DRGs. Interestingly, there was a trend toward downregulation of NR1-4 in the NGs, indicating a distinct difference in the pattern of NR1 splice variant expression among the tissues.
The differences in the NMDAR subunit distribution among various species are also evident in the present study. Using rat-specific primer sequences for NR2A subunit gene, we observed significantly high expression in the DRGs and NGs as well as in esophageal tissues from the control cats. In contrast, NR2A expression either at the gene or protein level in rat DRG soma has not been shown (29). The complexity and diversity of NMDAR subunit expression in visceral organs has been documented in recent studies. Following carrageenan-induced hind paw inflammation, NR1 serine phosphorylation and NR2B suppression has been observed in the dorsal horn neurons (3). The long-lasting decrease in NR2B expression in this injury model is in sharp contrast to the findings in the TNBS-induced colitis model, in which inflammation resulted in upregulation and persistent phosphorylation of NR2 subunit expression in the DRG neurons (25). In the present study, esophagitis following acid infusion resulted in significant upregulation of NR1 protein and mRNA with a significant downregulation of NR2A mRNA in the DRGs, NGs, and esophagus. These data indicate that NMDAR are highly dynamic in their subunit composition during the development, maintenance, and recovery from a pathological condition.
This differential subunit expression pattern of NMDAR is also an important factor in regulating function and neuronal plasticity under pathological conditions. For example, rapid calcium-mediated signaling through NR1/NR2A in contrast to slower signaling through NR1/NR2B may activate different downstream signaling and gene expression patterns under various pathological conditions. Therefore, experimental findings of the NMDAR expression and activation in various animal models of inflammation need careful interpretation and may be important for the development of targeted pharmacological inventions.
Overexpression of N1 and C1 splices and serine phosphorylation within the C1 cassette have been observed 14 days following inflammation of the rat colon with TNBS. In contrast, rats without inflammation fail to show expression of N1 and C1 splice variants (10, 47). In the present study, 7 days of acid infusion resulted in the expression of NR1-4 splice variants in esophageal tissues, whereas PBS-treated cats failed to show any NR1 splice variant. It is likely that in the esophagus, NMDAR have lower levels of constitutively expressed NR1 subunits and alternative splicing under normal physiological states with a subsequent upregulation of NR1 splice variants in the pathological state.
In a recent study, repeated long-term application of an NMDAR agonist resulted in a rapid loss of functional NR1-NR2A channels at the surface of HEK-293 cells (44). This use-dependent receptor downregulation was prevented by application of tyrosine phosphatase inhibitors, indicating that a tyrosine-based signaling mechanism is involved in NMDAR subunit modulation and expression. An overall downregulation of NR2A subunit in the present study is in accordance with previously reported suppression of NR2 subunits in rats following carrageenan-induced hind paw inflammation (3).
Since currently there is no reliable, reproducible, and quantifiable animal model to measure the esophageal pain, the major limitation of the present study is the absence of behavioral testing to determine the esophageal hypersensitivity following repeated acid infusion. However, on the basis of previously reported human psychophysical studies and electrophysiological recordings from spinal and brain stem neurons of cats it can be speculated that acid exposure results in altered esophageal sensations (15, 31, 32, 35, 38, 39). Human study has also documented that NMDAR antagonist ketamine prevents esophageal hypersensitivity following acute infusion of acid (45). Therefore, our present findings indicate that altered NMDAR expression following acid exposure may contribute to the esophageal hypersensitivity.
GRANTS
The work was supported by a National Institute of Diabetes and Digestive and Kidney Diseases RO1 (DK25731) to R. Shaker and partly by RO1 DK062312-01As awarded to J. N. Sengupta.
The costs of publication of this article were defrayed in part by the payment of page charges. The article must therefore be hereby marked “advertisement” in accordance with 18 U.S.C. Section 1734 solely to indicate this fact.
REFERENCES
- 1.Alvarez de la Rosa D, Zhang P, Shao D, White F, Canessa CM. Functional implications of the localization and activity of acid-sensitive channels in rat peripheral nervous system. Proc Natl Acad Sci USA 99: 2326–2331, 2002. [DOI] [PMC free article] [PubMed] [Google Scholar]
- 2.Banerjee B, Medda BK, Lazarova Z, Bansal N, Shaker R, Sengupta JN. Effect of reflux-induced inflammation on transient receptor potential vanilloid one (TRPV1) expression in primary sensory neurons innervating the oesophagus of rats. Neurogastroenterol Motil 19: 681–691, 2007. [DOI] [PubMed] [Google Scholar]
- 3.Caudle RM, Perez FM, Del Valle-Pinero AY, Iadarola MJ. Spinal cord NR1 serine phosphorylation and NR2B subunit suppression following peripheral inflammation. Mol Pain 1: 25, 2005. [DOI] [PMC free article] [PubMed] [Google Scholar]
- 4.Caudle RM, Perez FM, King C, Yu CG, Yezierski RP. N-methyl-d-aspartate receptor subunit expression and phosphorylation following excitotoxic spinal cord injury in rats. Neurosci Lett 349: 37–40, 2003. [DOI] [PubMed] [Google Scholar]
- 5.Cerne R, Randic M. Modulation of AMPA and NMDA responses in rat spinal dorsal horn neurons by trans-1-aminocyclopentane-1,3-dicarboxylic acid. Neurosci Lett 144: 180–184, 1992. [DOI] [PubMed] [Google Scholar]
- 5a.Cervero F, Laird JM. Understanding the signaling and transmission of visceral nociceptive events. J Neurobiol 61: 45–54, 2004. [DOI] [PubMed] [Google Scholar]
- 6.Coggeshall RE, Carlton SM. Ultrastructural analysis of NMDA, AMPA, and kainate receptors on unmyelinated and myelinated axons in the periphery. J Comp Neurol 391: 78–86, 1998. [DOI] [PubMed] [Google Scholar]
- 7.Cull-Candy S, Brickley S, Farrant M. NMDA receptor subunits: diversity, development and disease. Curr Opin Neurobiol 11: 327–335, 2001. [DOI] [PubMed] [Google Scholar]
- 8.Czaja K, Ritter RC, Burns GA. Vagal afferent neurons projecting to the stomach and small intestine exhibit multiple N-methyl-d-aspartate receptor subunit phenotypes. Brain Res 1119: 86–93, 2006. [DOI] [PubMed] [Google Scholar]
- 9.Davies SN, Lodge D. Evidence for involvement of N-methylaspartate receptors in ‘wind-up’ of class 2 neurones in the dorsal horn of the rat. Brain Res 424: 402–406, 1987. [DOI] [PubMed] [Google Scholar]
- 10.Del Valle-Pinero AY, Suckow SK, Zhou Q, Perez FM, Verne GN, Caudle RM. Expression of the N-methyl-d-aspartate receptor NR1 splice variants and NR2 subunit subtypes in the rat colon. Neuroscience 147: 164–173, 2007. [DOI] [PMC free article] [PubMed] [Google Scholar]
- 11.DeVault KR Acid infusion does not affect intraesophageal balloon distention-induced sensory and pain thresholds. Am J Gastroenterol 92: 947–949, 1997. [PubMed] [Google Scholar]
- 12.Dickenson AH, Sullivan AF. Evidence for a role of the NMDA receptor in the frequency dependent potentiation of deep rat dorsal horn nociceptive neurones following C fibre stimulation. Neuropharmacology 26: 1235–1238, 1987. [DOI] [PubMed] [Google Scholar]
- 13.Dingledine R, Borges K, Bowie D, Traynelis SF. The glutamate receptor ion channels. Pharmacol Rev 51: 7–61, 1999. [PubMed] [Google Scholar]
- 14.Fass R, Naliboff B, Higa L, Johnson C, Kodner A, Munakata J, Ngo J, Mayer EA. Differential effect of long-term esophageal acid exposure on mechanosensitivity and chemosensitivity in humans. Gastroenterology 115: 1363–1373, 1998. [DOI] [PubMed] [Google Scholar]
- 15.Garrison DW, Chandler MJ, Foreman RD. Viscerosomatic convergence onto feline spinal neurons from esophagus, heart and somatic fields: effects of inflammation. Pain 49: 373–382, 1992. [DOI] [PubMed] [Google Scholar]
- 16.Gerber G, Randic M. Excitatory amino acid-mediated components of synaptically evoked input from dorsal roots to deep dorsal horn neurons in the rat spinal cord slice. Neurosci Lett 106: 211–219, 1989. [DOI] [PubMed] [Google Scholar]
- 17.Gold MS, Zhang L, Wrigley DL, Traub RJ. Prostaglandin E(2) modulates TTX-R I(Na) in rat colonic sensory neurons. J Neurophysiol 88: 1512–1522, 2002. [DOI] [PubMed] [Google Scholar]
- 18.Hogan WJ The viability of the subspecialty of gastroenterology. Gastroenterology 105: 1601–1607, 1993. [DOI] [PubMed] [Google Scholar]
- 19.Holzer P Acid-sensitive ion channels in gastrointestinal function. Curr Opin Pharmacol 3: 618–625, 2003. [DOI] [PubMed] [Google Scholar]
- 20.Hwang SJ, Valtschanoff JG. Vanilloid receptor VR1-positive afferents are distributed differently at different levels of the rat lumbar spinal cord. Neurosci Lett 349: 41–44, 2003. [DOI] [PubMed] [Google Scholar]
- 21.Ismail-Beigi F, Horton PF, Pope CE. Histological consequences of gastroesophageal reflux in man. Gastroenterology 58: 163–174, 1970. [PubMed] [Google Scholar]
- 22.Jocic M, Schuligoi R, Schoninkle E, Pabst MA, Holzer P. Cooperation of NMDA and tachykinin NK(1) and NK(2) receptors in the medullary transmission of vagal afferent input from the acid-threatened rat stomach. Pain 89: 147–157, 2001. [DOI] [PubMed] [Google Scholar]
- 23.Karlsson U, Sjodin J, Angeby MK, Johansson S, Wikstrom L, Nasstrom J. Glutamate-induced currents reveal three functionally distinct NMDA receptor populations in rat dorsal horn — effects of peripheral nerve lesion and inflammation. Neuroscience 112: 861–868, 2002. [DOI] [PubMed] [Google Scholar]
- 24.Kobayashi S, Kasugai T. Endoscopic and biopsy criteria for the diagnosis of esophagitis with a fiberoptic esophagoscope. Am J Dig Dis 19: 345–352, 1974. [DOI] [PubMed] [Google Scholar]
- 25.Li J, McRoberts JA, Ennes HS, Trevisani M, Nicoletti P, Mittal Y, Mayer EA. Experimental colitis modulates the functional properties of NMDA receptors in dorsal root ganglia neurons. Am J Physiol Gastrointest Liver Physiol 291: G219–G228, 2006. [DOI] [PubMed] [Google Scholar]
- 26.Liu H, Wang H, Sheng M, Jan LY, Jan YN, Basbaum AI. Evidence for presynaptic N-methyl-d-aspartate autoreceptors in the spinal cord dorsal horn. Proc Natl Acad Sci USA 91: 8383–8387, 1994. [DOI] [PMC free article] [PubMed] [Google Scholar]
- 27.Liu XG, Sandkuhler J. Long-term potentiation of C-fiber-evoked potentials in the rat spinal dorsal horn is prevented by spinal N-methyl-d-aspartic acid receptor blockage. Neurosci Lett 191: 43–46, 1995. [DOI] [PubMed] [Google Scholar]
- 28.Ma QP, Hargreaves RJ. Localization of N-methyl-d-aspartate NR2B subunits on primary sensory neurons that give rise to small-caliber sciatic nerve fibers in rats. Neuroscience 101: 699–707, 2000. [DOI] [PubMed] [Google Scholar]
- 29.Marvizon JC, McRoberts JA, Ennes HS, Song B, Wang X, Jinton L, Corneliussen B, Mayer EA. Two N-methyl-d-aspartate receptors in rat dorsal root ganglia with different subunit composition and localization. J Comp Neurol 446: 325–341, 2002. [DOI] [PubMed] [Google Scholar]
- 30.McRoberts JA, Coutinho SV, Marvizon JC, Grady EF, Tognetto M, Sengupta JN, Ennes HS, Chaban VV, Amadesi S, Creminon C, Lanthorn T, Geppetti P, Bunnett NW, Mayer EA. Role of peripheral N-methyl-d-aspartate (NMDA) receptors in visceral nociception in rats. Gastroenterology 120: 1737–1748, 2001. [DOI] [PubMed] [Google Scholar]
- 31.Medda BK, Sengupta JN, Lang IM, Shaker R. Response properties of the brainstem neurons of the cat following intra-esophageal acid-pepsin infusion. Neuroscience 135: 1285–1294, 2005. [DOI] [PubMed] [Google Scholar]
- 32.Mehta AJ, De Caestecker JS, Camm AJ, Northfield TC. Sensitization to painful distention and abnormal sensory perception in the esophagus. Gastroenterology 108: 311–319, 1995. [DOI] [PubMed] [Google Scholar]
- 33.Miranda A, Nordstrom E, Mannem A, Smith C, Banerjee B, Sengupta JN. The role of transient receptor potential vanilloid 1 in mechanical and chemical visceral hyperalgesia following experimental colitis. Neuroscience 148: 1021–1032, 2007. [DOI] [PMC free article] [PubMed] [Google Scholar]
- 34.Momiyama A Distinct synaptic and extrasynaptic NMDA receptors identified in dorsal horn neurones of the adult rat spinal cord. J Physiol 523: 621–628, 2000. [DOI] [PMC free article] [PubMed] [Google Scholar]
- 35.Peghini PL, Johnston BT, Leite LP, Castell DO. Mucosal acid exposure sensitizes a subset of normal subjects to intra-oesophageal balloon distension. Eur J Gastroenterol Hepatol 8: 979–983, 1996. [PubMed] [Google Scholar]
- 36.Randic M, Jiang MC, Cerne R. Long-term potentiation and long-term depression of primary afferent neurotransmission in the rat spinal cord. J Neurosci 13: 5228–5241, 1993. [DOI] [PMC free article] [PubMed] [Google Scholar]
- 37.Ren K, Hylden JL, Williams GM, Ruda MA, Dubner R. The effects of a non-competitive NMDA receptor antagonist, MK-801, on behavioral hyperalgesia and dorsal horn neuronal activity in rats with unilateral inflammation. Pain 50: 331–344, 1992. [DOI] [PubMed] [Google Scholar]
- 38.Sarkar S, Aziz Q, Woolf CJ, Hobson AR, Thompson DG. Contribution of central sensitisation to the development of non-cardiac chest pain. Lancet 356: 1154–1159, 2000. [DOI] [PubMed] [Google Scholar]
- 39.Sarkar S, Hobson AR, Furlong PL, Woolf CJ, Thompson DG, Aziz Q. Central neural mechanisms mediating human visceral hypersensitivity. Am J Physiol Gastrointest Liver Physiol 281: G1196–G1202, 2001. [DOI] [PubMed] [Google Scholar]
- 40.Sato K, Kiyama H, Park HT, Tohyama M. AMPA, KA and NMDA receptors are expressed in the rat DRG neurones. Neuroreport 4: 1263–1265, 1993. [DOI] [PubMed] [Google Scholar]
- 41.Sinner B, Graf BM. Ketamine. Handb Exp Pharmacol 182: 313–333, 2008. [DOI] [PubMed] [Google Scholar]
- 42.Snyder GL, Galdi S, Hendrick JP, Hemmings HC Jr. General anesthetics selectively modulate glutamatergic and dopaminergic signaling via site-specific phosphorylation in vivo. Neuropharmacology 53: 619–630, 2007. [DOI] [PubMed] [Google Scholar]
- 44.Vissel B, Krupp JJ, Heinemann SF, Westbrook GL. A use-dependent tyrosine dephosphorylation of NMDA receptors is independent of ion flux. Nat Neurosci 4: 587–596, 2001. [DOI] [PubMed] [Google Scholar]
- 45.Willert RP, Woolf CJ, Hobson AR, Delaney C, Thompson DG, Aziz Q. The development and maintenance of human visceral pain hypersensitivity is dependent on the N-methyl-d-aspartate receptor. Gastroenterology 126: 683–692, 2004. [DOI] [PubMed] [Google Scholar]
- 46.Winkler A, Mahal B, Zieglgansberger W, Spanagel R. Accurate quantification of the mRNA of NMDAR1 splice variants measured by competitive RT-PCR. Brain Res Brain Res Protoc 4: 69–81, 1999. [DOI] [PubMed] [Google Scholar]
- 47.Zhou Q, Caudle RM, Price DD, Del Valle-Pinero AY, Verne GN. Selective upregulation of NMDA-NR1 receptor expression in myenteric plexus after TNBS induced colitis in rats. Mol Pain 2: 3, 2006. [DOI] [PMC free article] [PubMed] [Google Scholar]