

Abstract
We have created a new class of hyaluronic acid (HA)-based hydrogel materials with HA hydrogel particles (HGPs) embedded in and covalently cross-linked to a secondary network. HA HGPs with an average diameter of ∼900 nm and narrow particle size distribution were synthesized using a refined reverse micelle polymerization technique. The average mesh size of the HGPs was estimated to be approximately 5.5 to 7.0 nm by a protein uptake experiment. Sodium periodate oxidation not only introduced aldehyde groups to the particles but also reduced the average particle size. The aldehyde groups generated were used as reactive handles for subsequent cross-linking with an HA derivative containing hydrazide groups. The resulting macroscopic gels contain two distinct hierarchical networks (doubly cross-linked networks, DXNs): one within individual particles and another among different particles. Bulk gels (BGs) formed by direct mixing of HA derivatives with mutually reactive groups were included for comparison. The hydrogel microstructures were collectively characterized by microscopy and neutron scattering techniques. Their viscoelasticity was quantified at low frequencies (0.1−10 Hz) using a controlled stress rheometer and at high frequencies (up to 200 Hz) with a home-built torsional wave apparatus. Both BGs and DXNs are stable elastic gels that become stiffer at higher frequencies. The HA-based DXN offers unique structural hierarchy and mechanical properties that are suitable for soft tissue regeneration.
Introduction
Hydrogel matrices are appealing materials for biomedical applications because of their inherent biocompatibility, high water content, and structural similarity to the natural extracellular matrix (ECM).1,2 Traditional hydrogels are macroscopic bulk gels (BGs) that consist of randomly cross-linked macromolecules and lack the hierarchical organization and structural integrity that are necessary for facilitating cell infiltration and neovascularization.3 They exhibit slow response and inferior mechanical properties that pose significant challenges for engineering mechanically active tissues.4,5 To overcome these limitations, hydrogels containing embedded nano/micro particles have been extensively studied for reinforcement6 or drug delivery purposes.7 However, these fillers are either stiff inorganic particles or hydrophobic particles that aggregate readily and are not compatible with the surrounding hydrogel matrix. More importantly, the ill-defined particle-matrix interface can lead to compromised material properties.8
Hydrogel particles (HGPs) are spherical hydrophilic networks on the micron (microgels) or nanometer scale (nanogels). They exhibit large surface area, faster responses, defined pore sizes and prolonged in vivo circulation time and are attractive for use as drug release depots.8-11 However, in the absence of specific interactions, water-swollen HGPs are simply colloidal suspensions that do not have measureable mechanical strength. Therefore, they are not very useful for tissue engineering applications. Hydrogels with HGPs as the effective cross-linkers10,12 may provide tailored viscoelasticity and structural integrity and are suitable for use as injectable materials for soft tissue regeneration.
Motivated by the need to engineer injectable materials for the treatment of vocal fold scarring,13 we have recently developed a new class of soft and elastic hydrogels consisting of covalently interconnected, hyaluronic acid (HA)-based HGPs.14,15 Our composite hydrogels contain both intra- and interparticle cross-linkings, referred to as doubly cross-linked networks (DXNs) (Figure 1). HA HGPs with controlled size, improved enzymatic stability, and defined surface functionality were synthesized using a reverse micelle polymerization technique. DXNs were prepared by a simple mixing of water-swollen HGPs and chemically modified HA. The mechanical properties of DXNs can be easily modulated by varying the particle size, surface functional group density, and intra- and interparticle cross-linking. In addition, the immobilized HGPs can be utilized as drug release depots to allow for spatial and temporal presentation of biologically active compounds. HA was chosen as the starting material because of its inherent biocompatibility, biodegradability, bioactivity, and unique rheological properties.16 Furthermore, it contains free carboxylic acid and vicinical hydroxyl groups that can be easily modified under mild conditions.17 HA-based hydrogels have been widely used for drug delivery and tissue engineering applications.18-23
Figure 1.

Schematic representation of doubly cross-linked networks (DXNs) with (1) intraparticle cross-linking between DVS and HA and (2) interparticle cross-linking between oxHGPs and HAADH.
It is widely accepted that cells are inherently sensitive to their surroundings, responding not only to the topographical features of the matrices but also to their viscoelasticity.24,25 A fundamental knowledge of the structure—function relationship will facilitate our future investigations in vocal fold tissue engineering using HA-based DXNs as instructive scaffolds. The current study aims at a fundamental understanding of the microstructure and viscoelasticity of HA DXNs. A modified particle synthesis protocol afforded HA HGPs with smaller diameter and narrower particle size distribution. The internal mesh size of the particles was quantitatively analyzed using a protein exclusion experiment. The morphologies of HGPs and DXNs were locally and globally analyzed using microscopy and neutron scattering techniques, respectively. The hydrogel viscoelasticity was quantified at low frequencies (<10 Hz) using a controlled stress rheometer and at high frequencies (40−200 Hz) using a home-built torsional wave apparatus.26 Throughout the investigation, HA-based BGs without HGPs were used to represent traditional hydrogels for comparison. Our results demonstrate that the HA-based DXN offers unique structural hierarchy and mechanical properties that are suitable for use as scaffolds for tissue engineering applications.
Experimental Section
Materials
HA (sodium salt, ∼500 kDa) was generously donated by Genzyme (Cambridge, MA). Dioctyl sulfosuccinate sodium salt (Aerosol OT, AOT, 98%), 2,2,4-trimethylpentane (isooctane, anhydrous), divinyl sulfone (DVS), 1-heptanol (1-HP), sodium periodate, adipic dihydrazide (ADH), 1-ethyl-3-[3-(dimethylamino)propyl] carbodiimide (EDC), sodium hydroxide, hydrochloric acid, 1-hydroxybenzotriazole (HOBt), trypsinogen from bovine pancreas (25 kDa), avidin from egg white (62 kDa), glyceraldehyde-3-phosphate dehydrogenase (GAPDH) from chicken muscle (140 kDa), and bovine liver catalase (250 kDa) were purchased from Aldrich (Milwaukee, WI). Cascade blue hydrazide (CB, sodium salt) was purchased from Molecular Probes (Carlsbad, CA). Acetone and isopropyl alcohol were obtained from Fisher Scientific (Pittsburgh, PA). All chemicals were used as received.
Chemical Modification of Hyaluronic Acid
HA was chemically modified with ADH using carbodiimide-mediated, HOBt-catalyzed coupling of ADH and carboxylate on HA at pH of 6.8 (HAADH). Separately, periodate oxidation was applied to generate HA with aldehyde groups (HAALD). The molar ratio of the HA repeating unit to sodium periodate was 1:1. The resulting HA derivatives were subjected to dialysis, followed by freeze drying.27
Synthesis of Hyaluronic Acid Hydrogel Particles
HA HGPs were synthesized using an AOT/isooctane/H2O reverse micelle system following previously reported procedures with some modifications (Table 1). We prepared the aqueous phase by dissolving HA in 0.2 M NaOH at a concentration of 4 mg/mL, whereas the organic phase consisted of 0.2 M AOT and 0.04 M 1-HP in isooctane. A small amount of HA solution (0.27 mL) was injected into a scintillating vial containing 7.5 mL of AOT/1-HP/isooctane. The mixture was immediately vortex mixed until a clear suspension was obtained. DVS (4 μL) was subsequently added to the microemulsion, and the mixture was vortex mixed again to disperse DVS. The reaction was allowed to proceed for 1 h at ambient temperature under vigorous stirring (2000−2200 rpm). Particles were collected by precipitation in a large excess of acetone, followed by ultracentrifugation (Sorvall RC-5B refrigerated superspeed centrifuge, DuPont Instruments) at 12 000 rpm for 10 min. The particles were thoroughly washed with acetone, isopropanol, and water before being dried under vacuum at room temperature. Yield: 78%.
Table 1.
Comparison of the Experimental Conditions Employed in the Synthesis of HA HGPs
| method | HA (mg/mL)a | Va (mL)b | Vo (mL)c | [AOT]/[1-HP]d | [H2O]/[AOT]e | DVS (μL)f | [DVS]/[HA]g |
|---|---|---|---|---|---|---|---|
| previous | 68 | 0.54 | 15 | 5 | 10 | 4 | 0.6 |
| current | 4 | 0.27 | 7.5 | 5 | 10 | 4 | 1.5 |
HA concentration in the aqueous phase.
Volume of the aqueous phase in the final microemulsion.
Volume of the organic phase in the final microemulsion.
Molar ratio of AOT to 1-HP.
Molar ratio of water to AOT.
Volume of DVS added.
Molar ratio of DVS to the HA repeating unit.
Oxidation of Hyaluronic Acid Hydrogel Particles
HA HGPs were rendered cross-linkable by NaIO4 oxidation following the previously reported procedure with a molar ratio of HA repeating unit to NaIO4 of 1.15 The reaction was carried out at room temperature in the dark overnight under constant stirring. The resulting particles are referred to as oxHGPs (yield: 70%). The residual NaIO4 in the reaction mixture was quantified using the iodometric method.28 To this end, the reaction supernatant (1 mL) was diluted with 25 mL of PBS buffer (pH of 7.4). Freshly prepared KI (5 mL, 20% in H2O) was added. The resulting I3− was titrated with 0.002 M Na2S2O3 (in PBS) until the solution become pale yellow. Freshly prepared starch solution (0.1 mL, 10 mg/mL) was added, and titration was continued until the solution became clear. The residual NaIO4 was calculated on the basis of the total amount of Na2S2O3 consumed during titration. The amount of aldehyde group in oxHGP that was available for subsequent cross-linking was quantified using CB. Freshly prepared oxHGP was allowed to react with an equal molar amount of CB (relative to HA repeat) in DI water in the dark at room temperature for 2 h. After the centrifugation (12 000 rpm for 10 min), the supernatant was collected. Upon appropriate dilution, the fluorescence intensity was measured using a spectrofluorometer (FluoroMax-3, Horiba Jobin Yvon, Edison, NJ) with an excitation wavelength of 360 nm and an emission wavelength of 420 nm. We calculated the amount of aldehyde group in oxHGP by comparing the CB concentration in the initial stock solution and in the supernatant using a standard curve with a CB concentration in the range of 1−40 ng/mL. The results reported are averaged from three repeating measurements under the same conditions.
Particle Size and Zeta Potential Analysis
The average particle size and surface charges for HGPs and oxHGPs (dispersed in DI H2O) were obtained using ZetaSizer Nano Series (Nano ZS, Malvern Instruments, UK).
Protein Uptake
Protein uptake experiments were carried out to gain a rough estimate of the average mesh size of HGPs.29 Four globular proteins with dimensions ranging from 3.0 to 10.2 nm were used for this purpose. Prior to the experiments, all laboratory wares were coated with bovine serum albumin (1 mg/mL) and dried at 37 °C overnight. Proteins were dissolved in DI H2O at a concentration of ∼0.45 mg/mL, and the solution pH was maintained below the isoelectric points (pI) of the proteins (Table 2) by NaOH (0.5 M) and HCl (0.5 M). Separately, HGPs were dispersed in DI water at a concentration of 1 mg/mL. We obtained the uptake samples by mixing 1 mL of protein stock solution with 50 μL of HGP suspension, whereas we prepared the control samples by mixing 1 mL of stock protein solution with 50 μL of DI H2O. After overnight incubation at 37 °C with gentle agitation, samples were centrifuged, and the supernatant was collected. The supernatant was diluted with DI H2O, and the protein concentrations were measured using the standard UV—vis micro BCA (bicinchoninic acid) protein assay (Pierce Technology, Thermo Fisher, Rockford, IL). We prepared a standard working curve by plotting the average blank-corrected reading for each standard (bovine serum albumin) versus its concentration. Protein uptake (milligrams of protein per milligram of HGPs) was calculated by subtracting the protein content of the control samples from that of the uptake samples. The reported results are an average of four repeats with calculated standard deviation.
Table 2.
Molecular Parameters for Proteins and Experimental Conditions Used in Protein Uptake Study29,52,53,38
| protein | pI | MW (kDa) | solution pH | protein size (nm) |
|---|---|---|---|---|
| trypsinogen | 9.3 | 25 | 6.8 | 3.0 |
| avidin | 10.0 | 62 | 7.1 | 5.5 |
| gapdh | 8.3 | 140 | 5.0 | 6.5 to 7.5 |
| catalase | 5.4 | 232 | 5.0 | 10.2 |
Synthesis of Hyaluronic Acid-Based Doubly Cross-Linked Networks and Bulk Gels
The oxidized HA particles (oxHGP, 10 mg) were swollen in DI water, and the excess water was removed by centrifugation at 12 000 rpm for 10 min. We prepared DXNs by mixing swollen oxHGPs with HAADH (0.3 mL, 2 wt % in DI H2O), followed by overnight incubation at 37 °C under constant stirring. The BGs were prepared by direct mixing of HAADH (0.5 mL, 1% in DI H2O) and HAALD (0.5 mL, 1% in DI H2O) in syringes connected by a two-way valve. For the measurement of the hydrogel sol fraction, the as-synthesized gels were allowed to swell in PBS (pH of 7.4). After 24 h of incubation at 37 °C, PBS was aspirated, and the gel disks were soaked in DI water for 1 h at 37 °C, followed by repeated washing to remove the excess electrolytes. Gels were subsequently dried by passing through graded ethanol solutions and drying under vacuum overnight. The sol fraction was calculated by the ratio of the final dry weight and the initial solid mass used in the gel preparation. The results are averaged from four repeating measurements.
Morphological Characterizations
Scanning electron micrographs (SEMs) of HGPs were obtained using a JSM 7400F SEM (operating voltage: 3 kV, current: 10 μA). Particles suspended in acetone were deposited on aluminum stubs, and the acetone was evaporated at room temperature. The dry particles were coated with Pt/Pd prior to imaging. An FEI Technai-12 transmission electron microscope (TEM) was used to obtain bright field images of HGPs at an accelerating voltage of 120 KV with a Gatan CCD camera. An aliquot of HGP suspension (5 μL, 5 wt %) was placed on a 400 mesh carbon-coated Cu grid. The excess water was blotted with Whatman filter paper. Samples were allowed to dry at room temperature overnight before being imaged. Cryo SEM was applied to visualize the microstructure of DXNs and BGs. Hydrogel samples were mounted on a specimen carrier covered with a freeze fracture ring (Leica Microsystems). The assembly was placed in the specimen holder and sealed. Samples were pressurized (≥2000 bar) and rapidly frozen (≥10 000 deg/s) in a Leica EM Pact high-pressure freezer. Samples were plunged in liquid nitrogen slush and transferred under vacuum to the preparation chamber (Gatan ALTO 2500 specimen) where they were freeze fractured. After water was sublimed, samples were brought back to a temperature of −130 °C, coated with gold—palladium (10 mA current), and viewed in a Hitachi S-4700 FESEM (Tokyo, Japan) at 1 kV (emission current: 30 μA) with a working distance of approximately 3−6 mm.
Small-Angle Neutron Scattering (SANS)
SANS experiments were performed on the 30 m instrument (NG-3) at the NIST Center for Neutron Research (NCNR), National Institute of Standards and Technology (NIST, Gaithersburg, MD).30 Hydrogel samples were prepared as described earlier but in D2O to enable adequate contrast between the hydrogen-rich gel matrix and the deuterated solvent. Solutions were mixed in a vial and immediately transferred to titanium sample cells with 30 mm diameter quartz windows and a 2 mm path length. All samples were incubated overnight at room temperature prior to scattering measurements. A monochromated neutron beam (λ = 6 Å) with a wavelength spread (Δλ/λ) of 0.14 was incident on the sample. The scattered neutrons were captured on a 64 × 64 cm2 2-D detector. Varying sample-to-detector distances of 1.33, 4.5, and 13.17 m were used in the study of the scattering wave vector q in the range 0.004 < q (Å−1) < 0.4, defined by q = (4π/λ) sin(θ/2), where λ is the neutron wavelength and θ is the scattering angle. Raw data were corrected for background electronic noise and radiation, detector inhomogeneity and sensitivity, and empty cell scattering. Intensities were normalized on an absolute scale relative to main beam transmission measurements through the sample and were reduced according to published protocol.31 The error bars of the data points for all SANS plots were within the limits of the symbols.
Ultra Small-Angle Neutron Scattering (USANS)
USANS experiments were performed on the perfect crystal diffractometer (PCD) on beamline BT 5 at the NCNR, NIST. The USANS, a Bonse-Hart-type diffractometer, produces high q resolution in one direction by using multiple reflections from silicon perfect crystals. A graphite premonochromator is used to select a 2.38 Å neutron wavelength beam. The beam is then diffracted by a three-bounce silicon (220) channel-cut monochromator. After passing through the sample, another three-bounce channel-cut silicon crystal analyzer selects scattering at small angles (θ) in one direction. The data are slit-desmeared as described by Singh et al.32 As with SANS experiments, hydrogels were prepared in D2O and held in titanium cells with 30 mm diameter quartz windows and a 2 mm path length. Experimental time and scattering limitations did not allow data to be obtained in the q range overlapping the USANS and SANS. Planned hardware improvements will allow this q range to be assessed during SANS experiments.
Oscillatory Rheology
The low-frequency rheological properties of the DXN and BGs were evaluated using a controlled stress rheometer (AR2000, TA Instruments, New Castle, DE) with a parallel plate geometry (25 mm diameter). Hydrogels were loaded on the geometry through a 20G1 syringe needle, and the excess hydrogel around the geometry was removed. Mineral oil with standard viscosity was spread around the geometry to prevent water evaporation during the measurements. The linear viscoelastic region was determined by an amplitude sweep from 0.1 to 1000% at a frequency of 6 rad/s. Time sweeps were performed for an hour at an angular frequency of 6 rad/s and a strain of 0.2%. Frequency sweeps within the linear viscoelastic regime were performed at 0.2% strain from 0.1 to 100 rad/sec. Three repeats of each sample were tested at 37 °C with a gap size of 500 μm.
Torsional Wave Experiments
The high frequency (>10 Hz) mechanical properties of the hydrogel samples were evaluated using a home-built torsional wave apparatus, as previously described.14,26 A thin, cylindrical hydrogel sample was sandwiched between two rigid hexagonal plates that were vertically aligned. The sample assembly was enclosed in an environmental chamber with controlled temperature (34−37 °C) and humidity (>94%). As the bottom plate oscillated (at a rotational angle of <0.2°), a torsional wave propagated up and down the sample. The rotations of the top and bottom plates were monitored by an optical lever technique, and the signals were captured by photodiode detectors. The output of each photodiode was proportional to the angular rotation of the respective plate. The experimentally determined amplification factor was obtained as the ratio of the amplitude of the rotation of the top plate to that of the bottom plate. As the frequency increased, the amplification factor increased, reaching a peak value at the resonance frequency. Frequency-dependent amplification factors were compared with those predicted by the viscoelasticity model. For that model, the viscoelastic description of the material was expressed in terms of the amplitude of the complex shear modulus and the loss angle. For each test, a constant modulus and phase shift were obtained that provided the best fit between the model and the experimental results over a range of frequency spanning the resonance frequency. The complex modulus of a particular sample was readily calculated from the measured rotations of the top and bottom plates. Reported data are representative values from three repeating measurements on the same sample.
Results and Discussion
We have discussed the need to engineer HA-based DXNs with built-in topological features for soft tissue engineering. A distinctly different but unique double network (DN) hydrogel has been developed by Gong et al.33 These DN gels are composed of a highly cross-linked rigid network interpenetrating with a second loosely cross-linked network. By judicial selection of polymer pairs and the synthesis conditions, hydrogels that can sustain a stress of up to 17.2 MPa have been obtained.34 It is worth emphasizing that the current DXN is not an interpenetrating network. The DXN refers to the primary network within individual particles and the secondary network between the particles. Multifunctional HA HGPs are intended not only as the chemical cross-linking points but also as signaling devices to promote cellular functions by temporal/spational presentation of biologically active molecules. Moreover, the high density of functional groups on HGPs combined with their low solution viscosity offers the potential to fine tune the viscoelasticity of DXNs.
Synthesis and Characterization of Hyaluronic Acid Hydrogel Particles
We have developed HA-based HGPs using a microemulsion polymerization technique.14,15 HGPs with an average size of 1 to 2 μm were prepared using an AOT/water/isooctane reverse micelle system. DVS was added to cross-link HA under basic conditions within the reverse micelles. Although these particles are perfectly spherical and had smooth surfaces, they exhibit a relatively broad particle size distribution. Control over the particle size and size distribution is crucial for the targeted application, and this was achieved by establishing uniform micellar dispersion and efficient cross-linking while at the same time avoiding immature micelle collision and ripening.
Table 1 compares the processing conditions employed in the current study with those previously used.15 The total volume of the microemulsion mixture was reduced, whereas the emulsion composition and the stirring speed remained the same. The volume reduction led to more uniform mixing throughout the reaction vessel. HA concentration in the aqueous phase was significantly decreased to enhance its efficient dispersion in the organic phase. In contrast, the amount of DVS added to the emulsion remained the same. As a result, the molar ratio of DVS to HA disaccharide increased from 0.6 to 1.5, leading to a faster and more efficient cross-linking reaction. This stoicheometry change had a profound effect on the size and size distribution of the final HGPs. This is not surprising considering the dynamic characteristics of microemulsion where continuous movement and collision of domains with each other exist.35 It has been shown that the chemical reaction rate affects both the nucleation and growth process and thus also affects the particle size and size distribution. Nucleation and growth simultaneously take place when the chemical reaction is slow.36 Large quantities of HA HGPs of relatively uniform size were reproducibly obtained. Ultracentrifugation at 12 000 rpm was necessary to pellet the particles during purification, suggesting that the average particle sizes were significantly reduced. When the previous particle synthesis protocol was employed, the transparent emulsion mixture turned opaque as the polymerization progressed, demonstrating a particle size increase from the initial nanosized dispersion to a micron-sized colloidal suspension. With the improved protocol, the reaction mixture remained clear throughout the course of polymerization.
Figure 2 shows a typical SEM of HA HGPs confirming the presence of well-defined spherical particles with relatively narrow size distribution. Quantitative particle size analysis using ZetaSizer (Figure 3) shows that the majority of the particles exhibit an effective median diameter of 929 nm with a peak width of 120 nm. Smaller particles with an effective median diameter of 164 nm also exist. The presence of two particle populations can be attributed to the inherent polydispersity of an AOT microemulsion system37 as well as inhomogeneous mixing during the particle synthesis.
Figure 2.
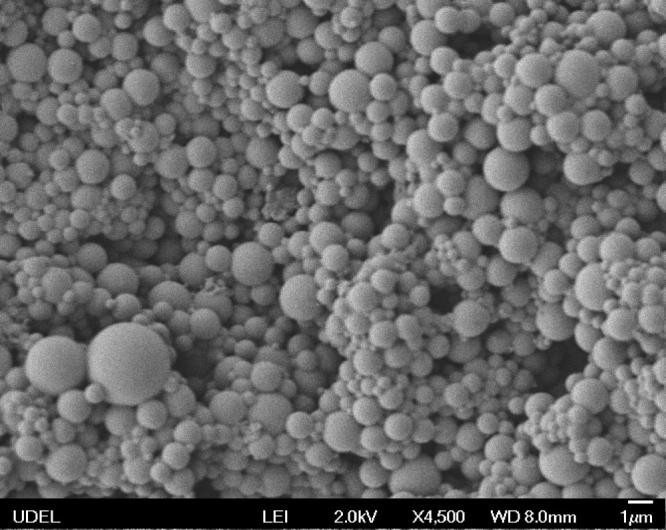
Scanning electron micrograph of HA HGPs.
Figure 3.
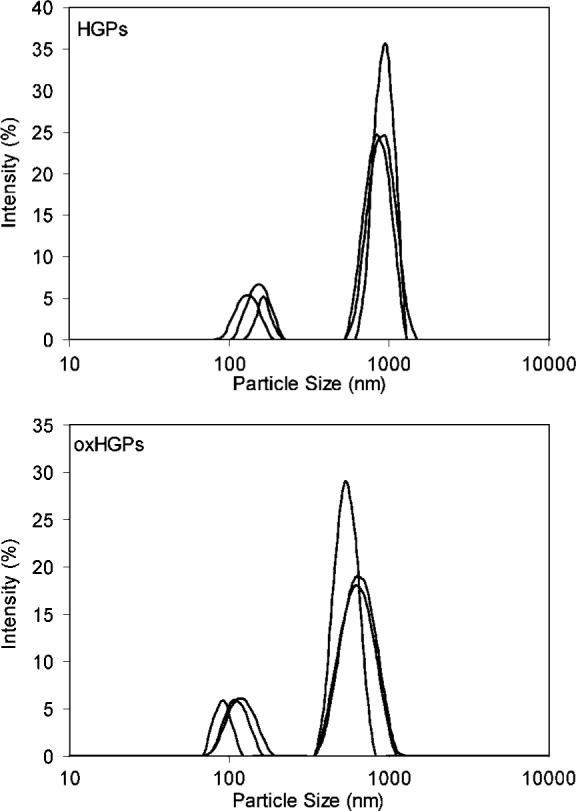
Particle size analysis for HGPs and oxHGPs. Results from three repeating measurements are included for both HGPs and oxHGPs.
The HA-based HGPs are not just intended to be passive filler materials; they will also be engineered to provide diagnostic cues and therapeutic functions. Local and sustained release of biologically active macromolecules can be accomplished by loading them into these hydrophilic particles. For the use of HGPs as drug release depots, it is necessary to understand the effect of network mesh size on the controlled molecular exchange of protein drugs. The SEM (Figure 2) captured on dry HGPs did not reveal any detailed porous structures in the particles. The TEM image (Figure 4) of the nanosized HGPs show the variation in electron density within the individual particles, suggesting the presence of nanoscale porous structures within the particles although their relative size cannot be determined. Protein exclusion experiments were carried out that employed stable globular proteins with molecular diameters ranging from 3.0 to 10.2 nm (Table 2).29,38 The absorption was carried out at a solution pH below the respective pIs so that there were net positive charges in the proteins. The charge state of HA HGPs was confirmed by the zeta potential measurements (−53 mV). Therefore, under these experimental conditions, proteins of the appropriate sizes were driven into the HGPs via ion exchange if the effective diameter of the protein was smaller than the average mesh size of the HGP matrix. Larger proteins were sterically excluded.
Figure 4.

Transition electron micrograph of nanosized HA HGPs showing the variation in electron density within the particles.
The results for equilibrium protein uptake are presented in Figure 5. It is evident that the uptake of trypsinogen, the smallest protein studied, was the highest. An average of 4.9 mg trypsinogen was taken up per milligram of HGPs. As the size of the proteins increased, their uptake steadily decreased. The uptake of avidin was significantly lower than that of trypsinogen (t test, α = 0.02). Two of the largest proteins, GAPDH and catalase, were essentially excluded, with an average uptake of 1.2 and 0.76 mg per milligram of HGP. Collectively, our data suggest that the average mesh size of the HGP matrix lies between 5.5 and 7.0 nm, the range of effective diameter for avidin and GAPDH. Therefore, macromolecules in this size range can be loaded in the particles and be continuously released.
Figure 5.
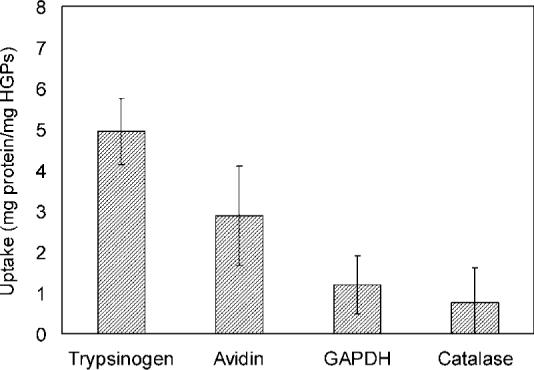
Equilibrium protein uptake by HGPs at 37 °C and pH below the pI values of respective proteins.
We are interested in synthesizing biocompatible HA HGPs that are reactive and cross-linkable. In this study, the HA HGPs were synthesized by in situ cross-linking of HA with DVS within the reverse micelle droplets. The resulting particles did not exhibit readily accessible functional groups for further cross-linking and bioconjugation. Therefore, sodium periodate oxidation was applied to install aldehyde groups to HGPs, and the resulting particles are referred to as oxHGPs. The as-synthesized HGPs were modified with 100% molar equivalent sodium periodate (relative to the HA repeating units) in aqueous solution at room temperature overnight. The residual NaIO4 in the reaction mixture was analyzed by iodometry.28 Surprisingly, after the addition of a large excess of freshly prepared KI solution, the solution remained essentially colorless. Upon the addition of starch indicator, a faint purple color (due to the formation of I3−) appears, indicating the presence of a very low concentration of IO4− in the reaction supernatant. Titration of I3− with Na2S2O3 (0.002 M, in PBS) indicates that only 0.8 mol % of NaIO4 was left after overnight oxidation. We quantified the number of readily accessible aldehyde groups throughout oxHGPs by monitoring CB concentration before and after its conjugation with an equal molar amount of oxHGPs (relative to the HA repeating unit) using a spectrofluorometer. Our results showed that for every 100 HA repeats, there are approximately 57.7 ± 1.3 aldehyde groups readily available for subsequent covalent cross-linking with HAADH. The oxidized particles were analyzed by ZetaSizer, and the results are also summarized in Figure 3. Although the same bimodal size distribution was observed as compared to that of the unmodified HGPs, there was a significant reduction in the average particle size for both populations. Again, the majority of the particles exhibited an average size of 584 nm, whereas the rest averaged 104 nm in diameter. Partial degradation of HGPs during oxidation is responsible for the observed size reduction.27 Clearly, the HA chains in the HGPs were equally susceptible to oxidative degradation, leading to the observed particle size reduction. Overall, oxHGPs remained spherical (data not shown) and were in the submicron size range.
Characterization of Hyaluronic Acid Doubly Cross-Linked Networks
Structural Characterization
With HA oxHGP in hand, we investigated the formation of macroscopic gels using oxHGPs as the building blocks and the HA derivative with hydrazide functionality (HAADH) as the water-soluble cross-linker. In situ cell encapsulation during hydrogel formation may be possible because oxHGPs, HAADH, and the cross-linking chemistry are well-tolerated by the cultured cells14,15 in vitro and the sciatic nerve27 in vivo. As discussed before, the refined synthesis procedure afforded HGPs with smaller average particle diameter and narrower size distribution. DXNs with measurable modulus formed in <2 h upon mixing using the newly synthesized particles. In the absence of oxHGP, HAADH solution (2 wt %) is simply a viscous fluid that does not have any mechanical integrity. The addition of oxHGP locks in the network structure, giving rise to a stable hydrogel that does not dissolve in an aqueous buffer.15 The majority of HAADH is effectively interconnected to the particles in the hydrogel matrix, as confirmed by the relatively low sol fraction (14.8 ± 3.1%) for DXNs. In contrast, the BGs exhibit a sol fraction of as high as 54.0 ± 3.3%, which is in agreement with previous results on fast gelling hydrogel systems.39 Again, the BG is formed within minutes of mixing, whereas the formation of stable DXNs takes 1 to 2 h. The longer times required for gelation resulted in more efficient cross-linking in DXNs. In other words, DXNs contain a very small amount of physically entangled HAADH that does not contribute to the overall stability of the gels. The optical microscopy image of the assynthesized DXNs (Figure S1 in the Supporting Information) clearly shows a large amount of interconnected HGPs throughout the matrix.
The DXNs thus obtained consist of chemically identical matrices at hierarchically different levels. Both the primary network within the HGP and the secondary network between the particles are HA-based (Figure 1). By controlling the degree of cross-linking for both networks, we can obtain hydrogel matrices that are robust yet soft and pliable. Our motivation for combining the two cross-linking mechanisms stems from our interest in only very lightly covalently cross-linking these hydrogels to stabilize the particles without unnecessarily increasing the modulus of the hydrogel and to provide opportunities for erosion of the hydrogels upon regeneration of native tissues in vivo.
The microstructure of DXNs was locally characterized by cryoSEM and globally characterized by SANS/USANS. BGs prepared using soluble HAADH and HAALD were included as the controls. For cryoSEM study, samples were prepared under high pressure and rapid freezing conditions, which effectively led to in situ vitrification of water within the hydrogel samples. Subsequent sublimation of the vitrified water revealed the internal structures of the hydrogel that could be visualized by cryoSEM (Figure 6). It is evident that both the BG and the DXN are composed of porous, interconnected network structures. The microstructure of DXNs is distinctly different from that of the bulk because of the presence of embedded oxHGPs. Whereas dry HGPs were perfectly spherical particles with relatively smooth surfaces (Figure 2), the particles in DXNs exhibited undulated surfaces. Unlike the traditional composite hydrogel where the particles are simply physically trapped in the hydrogel matrix, our DXNs have distinctive hierarchical structures, whereby the secondary network originates from the particle surfaces covalently. A close inspection of the cryoSEM image for DXNs indicates a diffuse interphase between individual oxHGPs and the matrix, which proves that the secondary network originates from the particle surface. As a result, the secondary network can exert mechanical constraints on the HGPs, leading to the deformation of HGP through the covalent hydrazone linkage between the secondary network and the HGP surface. It is also evident that the HGPs are much less porous than the secondary network in which they are embedded.
Figure 6.

CryoSEM images of bulk gels (top) and doubly cross-linked networks (bottom).
An excellent tool for quantitative global evaluation of the hydrogel networks on length scales varying from a few angstroms to a few hundred nanometers is SANS. SANS data for BGs as well as the DXNs are shown in Figure 7 as the scattering intensity (I(q)) versus the scattering vector (q), where q = (4π/λ) sin(θ/2) (λ: wavelength of incident neutrons; θ: scattering angle). A quantitative estimation of the hydrogel network morphology (hundreds of nanometers) can be made by a comparison of the low q scattering exponent. A scattering exponent in the low q regime can be interpreted to be representative of the network density. As seen in Figure 7, the BG has an exponent of 2.3, which is indicative of a mass fractal.40,41 Mass fractal scattering occurs when I(q) ≈ S(q) ≈ q−Dm, where Dm is the mass fractal dimension and has a value of 1 to 3. This value increases to 2.9 for DXN, which is suggestive of the increase in the compactness/density of the network resulting from the densely cross-linked particles that were previously absent. Analyses on other hydrogel and biophysical systems have produced similar changes in the fractal nature of self-assembled networks with concentration.42,43
Figure 7.

SANS data for BGs (○) versus DXNs (□) left overnight after cross-linking at room temperature. The increase in the mass fractal exponent from 2.3 to 2.9 in the low q regime is indicative of the enhancement in the network density from BGs to DXNs.
Combined SANS and USANS data for the 0.5 wt % HGPs are shown as an inset in Figure 8 and cover four orders of magnitude on length scales from a few angstroms to tens of microns. The plateau in the intensity seen at the low q regime is typical of scattering from spherical objects and has often been seen in nano/micro particles and in micellular nanostructures from surfactants44 and block copolymers.45,46 A Guinier analysis47 of the data (Figure 8) in the low q saturation regime gives a particle radius of 452 nm. This global analysis was in excellent agreement with local dimensions extracted from SEM data and those from DLS, which estimate the particle diameter to be ∼900 nm and confirm the relative monodispersity of the particles.
Figure 8.

Guinier analysis of the USANS data from 0.5 wt % HGPs in D2O. A plot of ln[I(q)] versus q2 for the low q data gives an Rg of 452.4 ± 12 nm. Inset: combined USANS and SANS data from 0.5 wt % HGPs solution in D2O. The error bars of the data points are within the limits of the symbols.
The structural analyses presented above allow us to elucidate the microstructure of DXNs. Because of the presence of large amounts of aldehyde groups, oxHGPs effectively serve as the cross-linking and branching points in the network. Individual particles are interconnected by HAADH and continue to grow and randomly branch out in the same fashion as that of the polymer chains in traditional BGs. Therefore, the micron-sized, interparticle spacing seen in the cryoSEM image originates from the HAADH-threaded particles (Figure 1).
Mechanical Properties
Our initial interest in HA DXNs stems from the need to develop injectable hydrogels for the treatment of vocal fold scarring.13 Therefore, it is important to gain a fundamental understanding of hydrogel viscoelasticity at human phonation frequencies (75−1000 Hz).48 A direct measurement at phonation frequencies is necessary because of the complexity and nonlinearity of the tissue itself and the DXNs described here, which may render the principle of time—temperature superposition inapplicable.49,50 In our investigations, the viscoelastic properties of DXNs as well as BGs were measured at low frequencies (<10 Hz) using a commercial rheometer in oscillatory shear mode and at high frequencies (>10 Hz) using a home-built torsional wave apparatus. For the rheology measurements, standard mineral oil was applied around the geometry to prevent samples from drying out during the measurement. All measurements were carried out at 37 °C using a peltier plate. Similarly, in torsional wave experiments, the hydrogel samples, sandwiched between two vertically aligned plates, were enclosed in an environmental chamber with controlled temperature (34−37 °C) and humidity (>94% RH). Both measurements were performed within the linear viscoelastic region: the applied strain was 0.2% for oscillatory rheological tests, and the imposed rotational angle was 0.2° in the torsional wave experiments.
At frequencies of 0.1−10 Hz, the elastic and loss modulus for both types of hydrogels are time- and frequency-independent (Figure 9), confirming the covalent nature of the matrices. This stability indicated that the permanent chemical cross-links were not destroyed by the increasing frequency (or time) at a constant strain (0.2%). These solid-like, elastomeric materials exhibited G′ values of approximately two orders of magnitude higher than the corresponding G″ values. The average storage moduli were 930 and 390 Pa for DXNs and BGs, respectively, whereas the average loss moduli were 24 and 4 Pa for DXNs and BGs, respectively. The damping ratio (tanδ)) for DXNs was one order of magnitude higher than that for BGs. Collectively, at frequencies of <10 Hz, DXNs were stiffer and more energy dissipative as compared with BGs. The effect of particle size and size distribution on the overall viscoelasticity of DXNs can be readily observed by comparing the current DXN systems with those reported previously. DXNs generated using less-defined particles had an average G′ of 510 Pa and G″ of 8 Pa;15 both values are lower than those of the gels prepared using smaller and more monodisperse particles. We are currently investigating the effect of intra- and interparticle cross-linking on the mechanical properties of DXNs. It is likely that a decrease in intra- and interparticle cross-linking will result in a decrease in G′ and an increase in G″.
Figure 9.
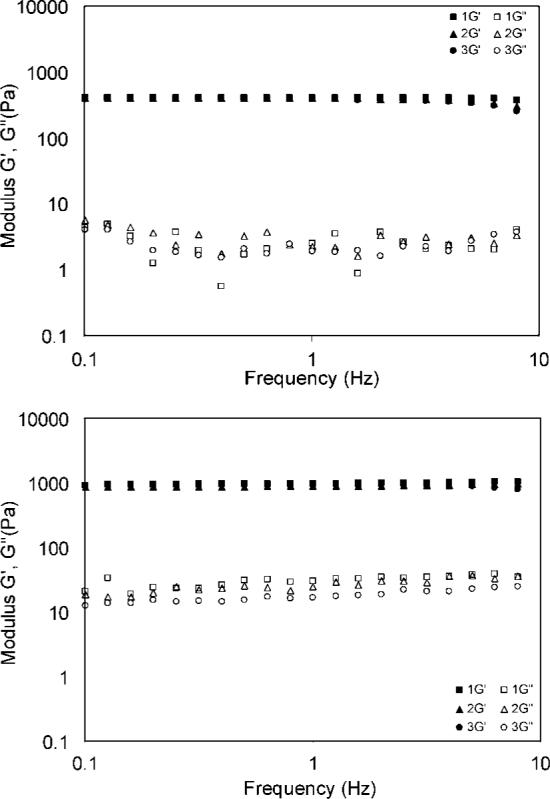
Low-frequency viscoelastic properties of HA-based bulk gels (top) and doubly cross-linked networks (bottom). The filled symbol represents the elastic modulus, and the open symbol represents the loss modulus. Three repeating measurements were performed on each sample.
We have demonstrated the capability of the torsional wave apparatus in accurately and reliably determining the viscoelasticity of hydrogel samples at phonation frequency range. This technique relies on the analysis of the amplification factor around the resonance frequency of the hydrogel samples that have the geometry of circular disks by the use of an optical lever technique combined with linear viscoelastic wave analysis.14,26 The representative frequency-dependent amplification factors for the best-fit model along with the experimental data for DXNs are included in Figure 10. Model prediction was based on the average values from three consecutive measurements on the same sample. The inset shows the hydrogel samples loaded between the rigid plates that are vertically aligned. Our studies have proved that the linear viscoelastic wave analysis provides a good fit to the observed frequency dependence of the amplification factor at the resonance frequency. Our calculation indicates that an increase in the frequency at which resonance occurs can be affected by decreasing the thickness of the sample. In other words, by changing the sample geometry, one can deduce the viscoelastic properties over a wide range of frequency.
Figure 10.
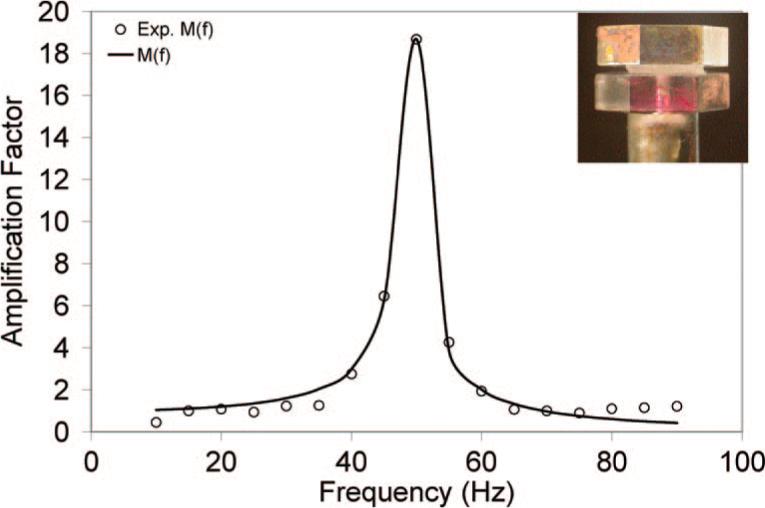
Frequency dependence of the amplification factor for HA-based DXNs. Best-fit models are shown as solid curves; experimental results are shown as symbols. The inset shows the test sample between the two plates of the loading system.
Figure 11 summarizes the frequency-dependent viscoelastic properties of DXNs and BGs. Comparing results obtained from oscillatory rheology and torsional wave analyses, we discovered that both BGs and DXNs became stiffer when the frequency of the applied mechanical perturbation increased from <10 Hz to ≥50 Hz. The average elastic modulus for BGs increased from 390 Pa at frequencies below 10 Hz to 495 Pa at 50−80 Hz, reaching 754 Pa at resonance frequencies in the range of 100−160 Hz. Similarly, the average elastic modulus for DXNs increased from 930 Pa at low frequencies to 1144 Pa at resonance frequencies of 50−70 Hz. Such increase in G′ as a function of frequency is representative of classical polymeric materials.26 It is well known that polymer molecular relaxation is strongly dependent on the frequency of the applied stress.51 Under a given applied stress, at low frequencies, the polymer chains within the bulk gel can deform or flow relatively easily – resulting in a relatively low elastic modulus. As the frequency increases, the ability of polymer chains to deform or flow at the same applied stress is diminished and the hydrogels become stiffer. The tanδ) values, on the other hand, remain essentially the same across the frequency range investigated for both BGs and DXNs. Their values are relatively small — near the lower limit of the measurements — for both the low and high frequency experiments.
Figure 11.
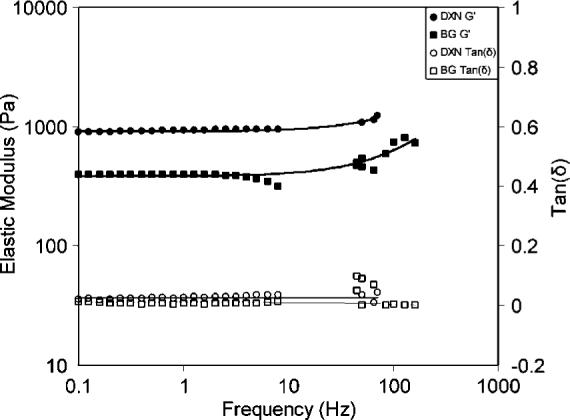
Frequency dependence viscoelastic properties of HA-based bulk gels (■,□) and doubly cross-linked networks (●,○). Filled symbols represent the elastic modulus and open symbols represent the loss tangent. Data reported are average values from measurements performed on three repeating samples.
Conclusions
The doubly cross-linked hydrogel system described in this study exhibits unique structural and mechanical characteristics hydrogel materials. The primary network lies within highly cross-linked HGPs. The secondary network was initiated from the surface of HGPs, forming stable hydrazone bonds between the aldehyde group on the particle surface and the HA derivative carrying hydrazide functionality. The interparticle spacing originates from the HAADH-threaded oxHGPs that branch out to form a network. Neutron scattering and microscopy techniques were used to confirm the hierarchical microstrucutre in DXNs. While the elastic modulus of DXNs increases as the frequency of the applied stress increases, the tanδ) values remain unchanged across the frequency range investigated. HA-based doubly cross-linked networks are promising materials for vocal fold tissue regeneration.
Supplemental Material
Acknowledgment
We are grateful to Hao Zhu for his help with the zeta potential analysis, Kirk Czymmek for his instruction on CryoSEM, and Boualem Hammouda for his stimulating discussions on SANS/USANS results. We thank Genzyme for providing HA. This work was supported by NIH/NIDCD (Jia, R01DC008965). The SANS/USANS studies were supported by a Small-Angle Neutron Scattering on Polymers and Complex Fluids Award (Pochan, U.S. Department of Commerce, no. 70NANB7H6178). This work utilized facilities partially supported by the National Science Foundation under agreement no. DMR-0454672.
Footnotes
Supporting Information Available: Optical microscopy image of as-synthesized DXNs at room temperature visualized at 40×. This material is available free of charge via the Internet at http://pubs.acs.org.
References and Notes
- 1.Peppas NA. Curr. Opin. Colloid Interface Sci. 1997;2:531–537. [Google Scholar]
- 2.Drury JL, Mooney DJ. Biomaterials. 2003;24:4337–4351. doi: 10.1016/s0142-9612(03)00340-5. [DOI] [PubMed] [Google Scholar]
- 3.Lutolf MP, Hubbell JA. Nat. Biotechnol. 2005;23:47–55. doi: 10.1038/nbt1055. [DOI] [PubMed] [Google Scholar]
- 4.Lee KY, Mooney DJ. Chem. ReV. 2001;101:1869–1879. doi: 10.1021/cr000108x. [DOI] [PubMed] [Google Scholar]
- 5.Bohidar HB, Dubin P, Osada Y, editors. Polymer Gels: Fundamentals and Applications. American Chemical Society; Washington, DC: 2002. [Google Scholar]
- 6.Haraguchi K, Farnworth R, Ohbayashi A, Takehisa T. Macromolecules. 2003;36:5732–5741. [Google Scholar]
- 7.Liu X, Nakamura K, Lowman AM. Soft Mater. 2003;1:393–408. [Google Scholar]
- 8.Nayak S, Lyon LA. Angew. Chem. Int. Ed. 2005;44:7686–7708. doi: 10.1002/anie.200501321. [DOI] [PubMed] [Google Scholar]
- 9.Zhou J, Wang GN, Zou L, Tang LP, Marquez M, Hu ZB. Biomacromolecules. 2008;9:142–148. doi: 10.1021/bm700918d. [DOI] [PMC free article] [PubMed] [Google Scholar]
- 10.Morimoto N, Endo T, Iwasaki Y, Akiyoshi K. Biomacromolecules. 2005;6:1829–1834. doi: 10.1021/bm050156x. [DOI] [PubMed] [Google Scholar]
- 11.Murthy N, Xu MC, Schuck S, Kunisawa J, Shastri N, Frechet JMJ. Proc. Natl. Acad. Sci. U.S.A. 2003;100:4995–5000. doi: 10.1073/pnas.0930644100. [DOI] [PMC free article] [PubMed] [Google Scholar]
- 12.Matsumoto A, Kawasaki N, Shimatani T. Macromolecules. 2000;33:1646–1650. [Google Scholar]
- 13.Hirano S. Curr. Opin. Otolaryngol. Head Neck Surg. 2005;13:143–147. doi: 10.1097/01.moo.0000162261.49739.b7. [DOI] [PubMed] [Google Scholar]
- 14.Jia XQ, Yeo Y, Clifton RJ, Jiao T, Kohane DS, Kobler JB, Zeitels SM, Langer R. Biomacromolecules. 2006;7:3336–3344. doi: 10.1021/bm0604956. [DOI] [PubMed] [Google Scholar]
- 15.Sahiner N, Jha AK, Nguyen D, Jia XQ. J. Biomater. Sci., Polym. Ed. 2008;19:223–243. doi: 10.1163/156856208783432462. [DOI] [PubMed] [Google Scholar]
- 16.Garg HG, Hales CA, editors. Chemistry and Biology of Hyaluronan. 1st ed. Elsevier; Boston: 2004. [Google Scholar]
- 17.Luo Y, Kirker KR, Prestwich GD. Modificationof Natural Polymers: Hyaluronic Acid. In: Atala A, Lanza RP, editors. Methods of Tissue Engineering. Academic Press; San Diego: 2001. pp. 539–553. [Google Scholar]
- 18.Aigner J, Tegeler J, Hutzler P, Campoccia D, Pavesio A, Hammer C, Kastenbauer E, Naumann A. J. Biomed. Mater. Res., Part A. 1998;42:172–181. doi: 10.1002/(sici)1097-4636(199811)42:2<172::aid-jbm2>3.0.co;2-m. [DOI] [PubMed] [Google Scholar]
- 19.Bulpitt P, Aeschlimann D. J. Biomed. Mater. Res., Part A. 1999;47:152–169. doi: 10.1002/(sici)1097-4636(199911)47:2<152::aid-jbm5>3.0.co;2-i. [DOI] [PubMed] [Google Scholar]
- 20.Burdick JA, Chung C, Jia XQ, Randolph MA, Langer R. Biomacromolecules. 2005;6:386–391. doi: 10.1021/bm049508a. [DOI] [PMC free article] [PubMed] [Google Scholar]
- 21.Jia XQ, Burdick JA, Kobler J, Clifton RJ, Rosowski JJ, Zeitels SM, Langer R. Macromolecules. 2004;37:3239–3248. [Google Scholar]
- 22.Leach JB, Bivens KA, Patrick CW, Schmidt CE. Biotechnol. Bioeng. 2003;82:578–589. doi: 10.1002/bit.10605. [DOI] [PubMed] [Google Scholar]
- 23.Yeo Y, Highley CB, Bellas E, Ito T, Marini R, Langer R, Kohane DS. Biomaterials. 2006;27:4698–4705. doi: 10.1016/j.biomaterials.2006.04.043. [DOI] [PubMed] [Google Scholar]
- 24.Stevens MM, George JH. Science. 2005;310:1135–1138. doi: 10.1126/science.1106587. [DOI] [PubMed] [Google Scholar]
- 25.Discher DE, Janmey P, Wang Y-L. Science. 2005;310:1139–1143. doi: 10.1126/science.1116995. [DOI] [PubMed] [Google Scholar]
- 26.Jiao T, Farran A, Jia X, Clifton RJ. Exp. Mech. [Online] 2008 doi: 10.1007/s11340-008-9126-4. DOI: 10.1007/s11340-008-9126-4. http://www.springerlink.com/content/ej2p738607648302/ [DOI] [PMC free article] [PubMed]
- 27.Jia XQ, Colombo G, Padera R, Langer R, Kohane DS. Biomaterials. 2004;25:4797–4804. doi: 10.1016/j.biomaterials.2003.12.012. [DOI] [PubMed] [Google Scholar]
- 28.Vandoorne F, Loccufier J, Schacht E. Makromol. Chem., Rapid Commun. 1989;10:271–275. [Google Scholar]
- 29.Eichenbaum GM, Kiser PF, Dobrynin AV, Simon SA, Needham D. Macromolecules. 1999;32:4867–4878. doi: 10.1021/ma970897t. [DOI] [PubMed] [Google Scholar]
- 30.Glinka CJ, Barker JG, Hammouda B, Krueger S, Moyer JJ, Orts WJ. J. Appl. Crystallogr. 1998;31:430–445. [Google Scholar]
- 31.Kline SR. J. Appl. Crystallogr. 2006;39:895–900. [Google Scholar]
- 32.Singh MA, Ghosh SS, Shannon RF. J. Appl. Crystallogr. 1993;26:787–794. [Google Scholar]
- 33.Tanaka Y, Gong JP, Osada Y. Prog. Polym. Sci. 2005;30:1–9. [Google Scholar]
- 34.Gong JP, Katsuyama Y, Kurokawa T, Osada Y. AdV. Mater. 2003;15:1155. [Google Scholar]
- 35.Bagwe RP, Khilar KC. Langmuir. 2000;16:905–910. [Google Scholar]
- 36.de Dios M, Barroso F, Tojo C, Blanco MC, Lopez-Quintela MA. Colloids Surf., A. 2005;270:83–87. [Google Scholar]
- 37.Kotlarchyk M, Chen SH, Huang JS. J. Phys. Chem. 1982;86:3273–3276. [Google Scholar]
- 38.Papadopoulos S, Jurgens KD, Gros G. Biophys. J. 2000;79:2084–2094. doi: 10.1016/S0006-3495(00)76456-3. [DOI] [PMC free article] [PubMed] [Google Scholar]
- 39.Kaihara S, Matsumura S, Fisher JP. Macromolecules. 2007;40:7625–7632. [Google Scholar]
- 40.Bale HD, Schmidt PW. Phys. ReV. Lett. 1984;53:596–599. [Google Scholar]
- 41.Koizumi S, Annaka M, Borbely S, Schwahn D. Physica B. 2000;276:367–368. [Google Scholar]
- 42.Hule RA, Nagarkar RP, Altunbas A, Ramay HR, Branco MC, Schneider JP, Pochan DJ. Faraday Discuss. 2008;139:251–264. doi: 10.1039/b717616c. [DOI] [PMC free article] [PubMed] [Google Scholar]
- 43.Hammouda B, Worcestery D. Biophys. J. 2006;91:2237–2242. doi: 10.1529/biophysj.106.083691. [DOI] [PMC free article] [PubMed] [Google Scholar]
- 44.McClain JB, Betts DE, Canelas DA, Samulski ET, DeSimone JM, Londono JD, Cochran HD, Wignall GD, Chillura-Martino D, Triolo R. Science. 1996;274:2049–2052. doi: 10.1126/science.274.5295.2049. [DOI] [PubMed] [Google Scholar]
- 45.Mortensen K, Talmon Y. Macromolecules. 1995;28:8829–8834. [Google Scholar]
- 46.Pressly ED, Rossin R, Hagooly A, Fukukawa KI, Messmore BW, Welch MJ, Wooley KL, Lamm MS, Hule RA, Pochan DJ, Hawker CJ. Biomacromolecules. 2007;8:3126–3134. doi: 10.1021/bm700541e. [DOI] [PubMed] [Google Scholar]
- 47.Guinier A, Fournet G. Small-Angle Scattering of X-rays. Wiley; New York: 1955. [Google Scholar]
- 48.Titze IR. Principles of Voice Production. Prentice Hall; Englewood Cliffs, NJ: 1994. [Google Scholar]
- 49.Chan RW. J. Acoust. Soc. Am. 2004;115:3161–3170. doi: 10.1121/1.1736272. [DOI] [PubMed] [Google Scholar]
- 50.Chan RW. J. Acoust. Soc. Am. 2001;110:1548–1561. doi: 10.1121/1.1387094. [DOI] [PubMed] [Google Scholar]
- 51.Shaw MT, MacKnight WJ. Introduction to Polymer Viscoelasticity. Wiley-Interscience; Hoboken, NJ: 2005. [Google Scholar]
- 52.Bromberg L, Temchenko M, Hatton TA. Langmuir. 2003;19:8675–8684. [Google Scholar]
- 53.Hunter AK, Carta G. J. Chromatogr., A. 2002;971:105–116. doi: 10.1016/s0021-9673(02)01027-0. [DOI] [PubMed] [Google Scholar]
Associated Data
This section collects any data citations, data availability statements, or supplementary materials included in this article.