

Abstract
Adaptive beamformer analyses of magnetoencephalograms (MEG) have shown promise as a method for functional imaging of cortical processes. Although recent evidence is encouraging, it is unclear whether these methods can both localize and reconstruct the time course of activity in subcortical structures such as the amygdala. Fourteen healthy participants (7 women) performed a perceptual matching task of negative emotional faces (angry and fearful) and geometric shapes that was designed for functional magnetic resonance imaging (fMRI) studies to maximize amygdala activation. Neuromagnetic data were collected with a 275-channel whole-head magnetometer, and event-related adaptive beamformer analyses were conducted to estimate broadband evoked responses to faces and shapes across the whole brain in 7mm steps. Group analyses revealed greater left amygdala activity to faces over shapes, both when face-matching and shape-matching trials were presented in separate blocks and when they were randomly intermixed. This finding was replicated in a second experiment with 7 new participants (3 women). Virtual sensor time series showed clear evoked responses in the left amygdala and left fusiform gyrus in both runs and experiments. We conclude that amygdala activity can be resolved from MEGs with adaptive beamformers with temporal resolution superior to other neuroimaging modalities. This demonstration should encourage use of MEG for elucidating functional networks mediating fear-related neural phenomena that likely unfold rapidly in time across cortical and subcortical structures.
Keywords: adaptive beamformer, amygdala, anger, facial expressions, fear, magnetoencephalography
Introduction
Magnetic source imaging techniques have begun to capitalize on the wealth of information existing in magnetoencephalograms (MEG) recorded by whole-head neuromagnetometers. While most MEG studies focus on the cerebral cortex, increasing evidence suggests that subcortical sources can be observed despite relatively low signal strength (Cornwell, Johnson, Holroyd, Carver, & Grillon, 2008; Ioannides, Liu, Kwapien, Drozdz & Streit, 2000; Moses et al., 2007; Streit et al., 2003; Tesche & Karhu, 2000). An array of different source analysis techniques have been employed to localize activation in thalamus, hippocampus and cerebellum, among other regions. Recently, three separate studies have reported observing amygdala activation elicited by negatively affective stimuli using minimum-variance adaptive beamformer techniques (Cornwell et al., 2007; Garolera et al., 2007; Luo, Holroyd, Jones, Hendler & Blair, 2007).
Adaptive beamformer analysis has proven successful in spatial localization of cortical activity associated with sensory and cognitive processes (Hillebrand, Singh, Holliday, Furlong & Barnes, 2005; Schultz et al., 2004; Singh, Barnes, Hillebrand, Forde, Williams, 2002; Taniguchi et al., 2000). An adaptive beamformer acts as an optimum spatial filter tuned to a particular point in source space that passes through the uncorrelated fraction of activity (signal plus noise) at that point and attenuates activity from elsewhere (Van Veen, van Drongelen, Yuchtman, & Suzuki, 1997; Vrba & Robinson, 1999). Computationally, the output of an adaptive beamformer is the weighted sum of sensor data, where these weights or coefficients are derived from the biomagnetic forward solution for a specific source location and the covariance matrix of unaveraged sensor data for a defined time-frequency window (Vrba & Robinson, 1999). The distribution of activity across the brain can be mapped by defining a 3-dimensional grid and constructing, one-by-one, beamformers at each point in the volume, with each point yielding an estimate of source power integrated over the time-frequency window used for covariance calculation. Statistical volumes can be produced from the source power estimates, spatially co-registered to structural magnetic resonance images (MRI) and spatially warped into a standardized space (i.e., Talairach space) for group analyses (Barnes & Hillebrand, 2003; Hillebrand et al., 2005).
Previous work with intracranial electroencephalography (iEEG) has shown differential event-related potentials (ERPs) in the amygdala to faces displaying negative and positive emotional expressions, with fearful expressions eliciting a greater response than other expressions by 200ms following stimulus presentation (Krolak-Salmon et al., 2004). Despite the clear spatial and temporal resolving ability of intracranial recordings, it is difficult to determine what properties of the data may not be generalizable to the healthy brain given that they are obtained from patients suffering from intractable epileptic seizures that require surgical intervention. Our aim was to explore the extent to which event-related beamformer analyses can produce from noninvasive MEG recordings information about amygdala activity with a similar level of temporal specificity. Such a demonstration would greatly enhance our ability to investigate rapid fear-related neural processes in healthy participants on a time-scale impossible with other noninvasive imaging modalities.
We administered a facial emotion matching task that is widely-used to elicit robust amygdala activation in fMRI studies (Bertolino et al., 2005; Hariri et al., 2002a; Hariri, Tessitore, Mattay, Fera & Weinberger, 2002b). In blocked-design format, participants are presented trial-by-trial with a target face that they must match with one of two other faces presented simultaneously, with all three faces displaying negative emotional expressions such as fear and anger (Figure 1). In separate blocks, participants perform a similar matching task with geometric shapes. A simple fMRI contrast analysis between the hemodynamic (BOLD) response during the face-matching blocks and the shape-matching blocks reliably demonstrates greater amygdala activity for the former relative to the latter (Hariri et al., 2002a; 2002b). Although an experimental design such as this one does not properly isolate what component(s) of emotional faces is(are) driving amygdala activation, it is ideal for our purposes in showing that an evoked response can be localized to the amygdala, and its time course defined, by adaptive beamformer analyses.
Figure 1.
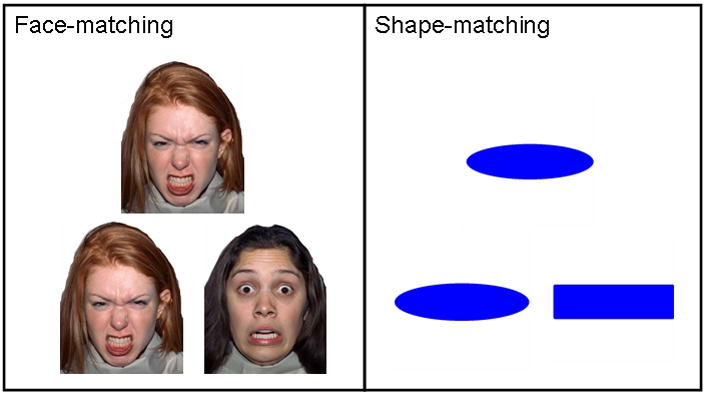
Format of stimulus presentation for face-matching (left) and shape-matching (right) trials. Triads were presented simultaneously and participants were instructed to match the top image (target image) with either the bottom left or bottom right image by a corresponding button press.
In this study, we presented face-matching and shape-matching trials in the standard blocked-trial format and also randomly intermixed in two different runs to explore the reliability of the results within the same participants. The latter run was also intended to limit the degree to which evoked responses to faces and shapes were influenced by state-related neural activity, as might be expected in a blocked-trial format when participants are repeatedly exposed to a particular kind of stimulus (in this case, negative emotional faces). These procedures were then repeated in a second experiment to examine the replicability of the findings in a second group of participants. In the second experiment, we explicitly instructed participants to focus on the emotional expressions of the faces to make their matching judgments to potentially increase amygdala reactivity in these participants (Pessoa, Japee, Sturman & Ungerleider, 2006; Pessoa, McKenna, Guiterrez, & Ungerleider, 2002).
Results
Statistical analyses of activation images across participants revealed greater activation of multiple structures, including the left amygdala, by faces compared to shapes in the 100-200ms and 150-250ms post-stimulus windows (Table 1). For Experiment 1, blocked and randomized presentation of negative faces elicited an evoked response of the left amygdala 100-200ms post-stimulus onset (Figure 2). For Experiment 2, left amygdala activation was also observed in both runs (within 1 mm according to the Talairach Daemon, Lancaster et al., 2000), with its peak response occurring in the 150-250ms window for the blocked run and the 100-200ms window for the randomized run (Figure 2). Other structures activated within these time windows by negative faces relative to shapes in Experiment 1 were as follows: right insula, right superior temporal gyrus (Brodmann Area (BA) 39), left fusiform gyrus (BA 19), left cerebellum, and right posterior cingulate (BA 29). In Experiment 2, regions displaying greater activity to faces over shapes included the following: right fusiform gyrus (BA 37), left fusiform gyrus (BA 37), right inferior parietal lobule (BA 40), left cingulate gyrus (BA 31), right insula (BA 13), right cerebellum, right middle temporal gyrus (BA 39), right middle occipital gyrus (BA 18), right middle occipital gyrus (BA 19) and left parahippocampal gyrus (BA 36). Regions commonly activated in both experiments by negative faces, besides the left amygdala, were the left fusiform gyrus, right insula, and right superior/middle temporal gyrus (Figure 3). No other time windows revealed differentially greater activity for faces over shapes consistently across blocked and randomized runs.
Table 1.
Peak differential activations occurring 100-200ms relative to stimulus onset comparing face-evoked activity to shape-evoked activity.
| Region | Run | x | y | z | Power Ratio | Student t |
|---|---|---|---|---|---|---|
| Experiment 1 | ||||||
| Amygdala L | Blocked | -21 | -2 | -14 | 0.81 | 3.12 |
| Randomized | -28 | -2 | -14 | 0.99 | 4.16 | |
| Cerebellum L | Blocked | -42 | -43 | -29 | 0.87 | 3.15 |
| Randomized | -42 | -50 | -27 | 1.16 | 3.86 | |
| Insula R | Blocked | 41 | -7 | 1 | 1.23 | 4.02 |
| Randomized | 36 | -7 | 7 | 0.91 | 5.59 | |
| Posterior cingulate R | Blocked | 14 | -45 | 20 | 1.01 | 4.27 |
| Randomized | 14 | -45 | 20 | 1.33 | 4.18 | |
| Superior Temporal R | Blocked | 43 | -50 | 13 | 1.25 | 4.23 |
| Randomized | 50 | -48 | 8 | 1.26 | 4.08 | |
| Experiment 2 | ||||||
| Amygdala L | Blocked | -21 | -1 | -11 | 1.86 | 3.86 |
| Randomized | -21 | -1 | -11 | 2.15 | 8.89 | |
| Cerebellum R | Blocked | 13 | -58 | -30 | 0.87 | 4.75 |
| Randomized | 6 | 51 | -30 | 1.07 | 3.32 | |
| Cingulate L | Blocked | -19 | -45 | 26 | 1.82 | 5.61 |
| Randomized | -20 | -43 | 26 | 1.63 | 3.75 | |
| Fusiform L | Blocked | -31 | -45 | -15 | 1.85 | 6.34 |
| Randomized | -46 | -50 | -15 | 1.47 | 4.97 | |
| Fusiform R | Blocked | 34 | -57 | -14 | 1.71 | 3.95 |
| Randomized | 49 | -50 | -21 | 1.75 | 3.71 | |
| Inferior parietal R | Blocked | 42 | -31 | 27 | 1.61 | 5.88 |
| Randomized | 49 | -37 | 21 | 2.06 | 14.34 | |
| Insula R | Blocked | 35 | -1 | 13 | 1.76 | 6.89 |
| Randomized | 35 | -7 | 22 | 1.62 | 7.40 | |
| Middle occipital R | Blocked | 28 | -84 | -8 | 1.64 | 7.47 |
| Randomized | 28 | -84 | -8 | 1.53 | 6.43 | |
| Middle occipital R | Blocked | 35 | -71 | -10 | 1.68 | 5.90 |
| Randomized | 35 | -79 | -1 | 1.56 | 5.01 | |
| Middle temporal R | Blocked | 55 | -56 | 6 | 1.51 | 2.93 |
| Randomized | 44 | -44 | 11 | 2.07 | 6.07 | |
| Parahippocampal L | Blocked | -22 | -41 | -8 | 1.79 | 3.38 |
| Randomized | -28 | -41 | -8 | 1.22 | 4.46 | |
Note: Power ratios are normalized or scaled to the within-volume standard deviation. Coordinates are in Talairach space.
Figure 2.
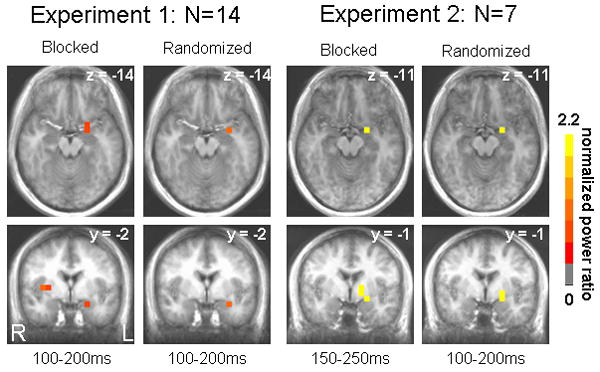
Axial and coronal views of left amygdala activity for both blocked and randomized runs in Experiment 1 and Experiment 2. Color map represents magnitude of normalized log10 power ratios. Anatomical underlays are averaged anatomical images across participants within an experiment. Images are in radiological view (right = left, and vice versa). Coordinates are in Talairach space.
Figure 3.
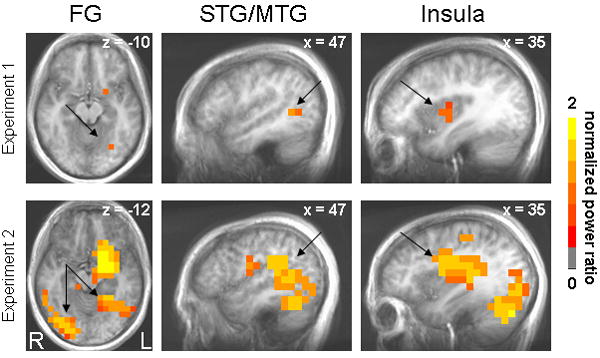
Axial and sagittal views showing significantly greater evoked activity to negative faces compared to shapes 100-200ms post-stimulus onset that was common to both the blocked and randomized runs and both experiments. Color map represents mean normalized log10 power ratios for the blocked and randomized data. Anatomical underlays are averaged structural images across participants within an experiment, and shown in radiological orientation. Coordinates are in Talairach space. FG = fusiform gyrus, STG/MTG = superior temporal gyrus/middle temporal gyrus.
Virtual sensor time series were created for the left amygdala and left fusiform gyrus sources with coordinates based on the group statistical local maxima in the 100-200ms time window for the blocked and randomized runs for both experiments (Figure 4). For the left amygdala source, local maxima were as follows: -21, -2, -14 mm (Experiment 1, blocked run), -28, -2, -14 mm (Experiment 1, randomized run), and -21, -1, -11 mm (Experiment 2, both runs). For the left fusiform source, local maxima were as follows: -28, -63, -9 mm (Experiment 1, both runs), -31, -45, -15 mm (Experiment 2, blocked run), and -46, -50, -15 mm (Experiment 2, randomized run). Each time course revealed a greater evoked response to faces compared to shapes with little variability in peak latency across blocked and randomized trial runs. Grand-averaged evoked responses in the left amygdala peaked between 136-146 ms following face onset in Experiment 1, and between 183-188ms in Experiment 2. Grand-averaged evoked responses of the left fusiform gyrus showed peaks at 125-130 ms and 177-183 ms following face onset in Experiment 1. For Experiment 2, there was a single peak response for faces at 170 ms for both runs in the left fusiform gyrus.
Figure 4.
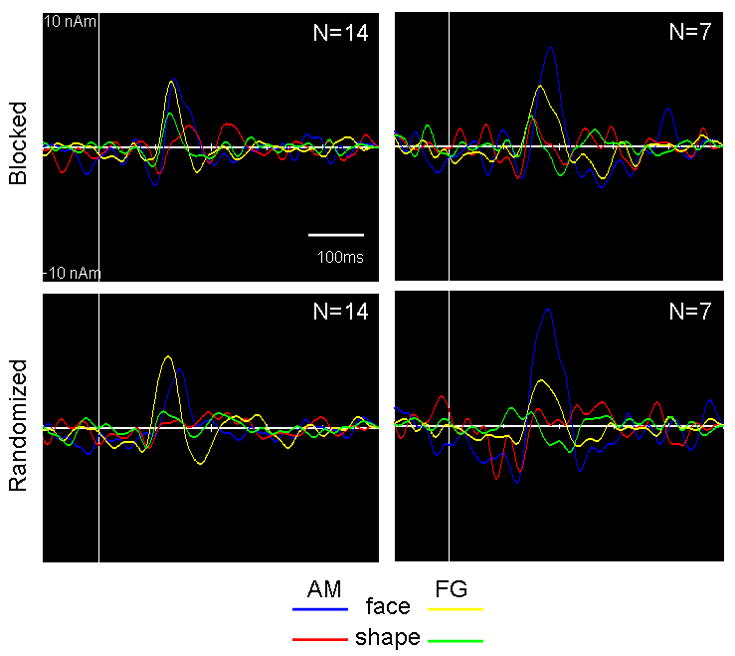
Grand-averaged waveforms of left amygdala and left fusiform gyrus activity for the blocked (top) and randomized runs (bottom) and for Experiment 1 (left) and Experiment 2 (right). Virtual sensor time series for each structure were projected from the location in Talairach standardized space of the group statistical local maxima for each run and experiment. Please see Results for the specific coordinates. AM = amygdala, FG = fusiform gyrus.
Based on the peak latencies of the evoked left amygdala responses, we defined a 10-ms window and conducted volumetric analyses using the same covariance matrices as in the main analyses. Figure 5 presents single-subject images for 5 participants for which local maxima in the left amygdala were evident. The majority of participants showed activations that extended into, but peaked outside, the left amygdala.
Figure 5.
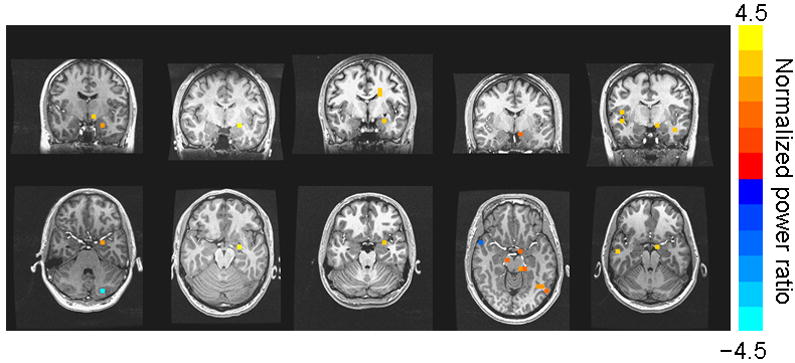
Single-subject images, in axial and coronal views, showing local maxima in the left amygdala. Normalized power ratio data are overlayed on individual anatomical MRIs in original subject space, shown in radiological orientation.
Effect sizes were computed at peak latencies for the left amygdala response to compare the difference in evoked activity across experiments. Cohen’s d’s were as follows: 1.08 (Experiment 1, blocked), 1.41 (Experiment 1, randomized), 2.43 (Experiment 2, blocked) and 2.08 (Experiment 2, randomized). For both runs, negative faces elicited larger left amygdala responses in Experiment 2 relative to Experiment 1.
Discussion
Results of this study constitute a successful demonstration that event-related beamformer analyses can resolve amygdala activity in whole-head MEG recordings, consistent with previous studies using minimum-variance adaptive beamformers (Cornwell et al., 2007; Garolera et al., 2007; Luo et al., 2007). Using a well-tested paradigm for eliciting amygdala activity in fMRI studies (Hariri et al., 2002a; 2002b), we observed and replicated greater left amygdala activity to negative emotional faces relative to geometric shapes as participants across two experiments performed a simple matching task. Similar activation of the left amygdala was found irrespective of trial presentation format, both when face-matching and shape-matching trials were blocked and intermixed/randomized, demonstrating consistency in capturing signals from the amygdala within subjects over time. We also observed activation of the left fusiform gyrus, right insula and superior/middle temporal cortices in both experiments, structures that have been widely shown to be involved in facial emotional processing (for a review, see Haxby, Hoffman & Gobbini, 2000).
Of central interest, projection of virtual sensor time series of the left amygdala source evidenced a clear evoked response that was larger for faces compared to shapes and consistent in peak latency within subjects across trial presentation formats (i.e., between runs). Time courses revealed that the left amygdala activity peaked earlier than those obtained from iEEG recordings in epileptic patients (Halgren et al., 1994; Krolak-Salmon et al., 2004). These time courses generally fit with the detailed neuroanatomical model of facial emotion recognition proposed by Adolphs (2002). Peak latencies of the amygdala responses appeared to differ by as much as 50ms between experiments, but response onsets differed by no more than 30ms. Although volumetric analyses showed high consistency in localizing amygdala activity in both experiments, projected time courses were more variable and thus seem to be more dependent on sample size for reliable estimation. Nevertheless, with these estimated time courses, we were able to show focal activation of the left amygdala at the peak latency in several individual participants.
Given that negative emotional faces and geometric shapes differ in multiple ways, we cannot make strong conclusions about what differential amygdala activity reflects in this study. Our findings could be interpreted as showing that greater attention to negative faces increased evoked activity of the left amygdala, in line with fMRI findings (Pessoa et al., 2006; Pessoa et al., 2002), and led to more widespread activation of posterior visual areas (Figure 4). An effect size comparison across experiments, which is not biased by unequal sample sizes, suggests that presentation of negative emotional faces exerted a stronger effect on left amygdala activity in participants in Experiment 2 relative to Experiment 1. The critical procedural difference between the two experiments was that Experiment 2 demanded that participants use the emotional expression of the faces, or at least the internal features of the face, as the basis by which to make matching responses, insofar as triads were comprised of different facial expressions of the same individual actor. Participants in Experiment 1 could have used nonemotional cues, such as the identity of the actors, to make correct matching responses because the distractor face in each triad differed by emotional expression and identity from the target face. More generally, the difference in response magnitudes across experiments could be result of greater constraint on the kinds of cognitive processes mediating task performance without being a specific function of greater attention to emotional content in Experiment 2. The large magnitude of effect sizes obtained in both experiments confirms our expectation that this experimental procedure of presenting three negative facial expressions simultaneously elicits robust amygdala activity.
We did not find evidence of a right amygdala response to the negative emotional faces in either experiment. Although there is abundant evidence of left and right amygdala involvement in emotional face processing (for reviews, see Adolphs, 2002; Calder, Lawrence, & Young, 2001; Davidson & Irwin, 1999), we lack an understanding by which to judge the validity of unilateral left amygdala activation as we present here. Indeed, a meta-analysis of neuroimaging studies of emotional processes across diverse paradigms concluded that left amygdala activity was found more commonly than right amygdala activity but the authors were unable to determine what factors might be differentially driving activity in these structures (Baas, Aleman, & Kahn, 2004). Similarly, for negatively-valenced stimuli as used in the present study, left amygdala activity was found predominantly over right amygdala activity (Wager, Phan, Liberzon, & Taylor, 2003). On these grounds, the left amygdala response we observed with event-related beamformer analyses is consistent with the preponderance of other neuroimaging evidence reporting left amygdala activity in studies that have used negative emotional stimuli.
Another structure consistently activated by negative faces across both runs and experiments was the left fusiform gyrus, which generally peaked earlier than the left amygdala response. The fusiform gyrus is thought to be involved in perceptual encoding of facial stimuli based on fMRI evidence and source analyses of the N170 (or M170), a scalp-recorded component that is selectively enhanced by faces compared to other complex visual stimuli (e.g., houses). An earlier component that peaks around 100ms (M100) also shows face selectivity in MEG studies (Liu, Harris & Kanwisher, 2002). Based on our projected virtual sensor time series, it appeared in Experiment 1 that the left fusiform gyrus could be the source of both these components. Compared to shapes, faces elicited stronger responses peaking between 125-130ms and 177-183ms in the left fusiform gyrus, a very similar pattern of activity observed at the sensors by Liu et al (2002). In Experiment 2, the left fusiform response peaked around 170ms in both runs. Several factors including different sample sizes and signal to noise ratio, as well as task strategy differences could account for the variability in the time courses observed across experiments. Nevertheless, the overall similarities serve to highlight the reliability and reproducibility of our findings.
Magnetic source imaging is becoming an integral tool to explore functional networks mediating perceptual and cognitive processes at a finer temporal scale than possible with other neuroimaging modalities. We are particularly encouraged by the present results because our understanding of rapidly unfolding fear-related neural phenomena will certainly benefit from a neuroimaging approach that can characterize the temporal dynamics of cortical and subcortical sources. By replicating our results across two samples, our findings, together with related studies (Cornwell et al., 2007; Garolera et al., 2007; Luo et al., 2007), strengthen the argument that MEG beamformers are sensitive to deep sources and can resolve amygdala activity on a millisecond scale.
Experimental Procedures
Experiment 1
Participants
Sixteen individuals (8 women, mean age = 26.6 yrs, range = 19 to 39 yrs) participated in a single MEG session followed by an MRI session. This study was approved by the National Institute of Mental Health Institutional Review Board and all participants gave informed consent prior to participation. Participant inclusion criteria included: (1) no past or current psychiatric disorders as per Structured Clinical Interview for DSM-IV (First et al., 1995); (2) no current use of psychoactive medications as per self-report; and (3) no current use of illicit drugs determined by urine analysis. Participants were also screened for metallic implants, tattoos and other non-removable metallic objects. Because of excessive head movement (displacement exceeding 5mm based on pre- and post-run calculations), two participants were excluded from analyses. The final sample consisted of 14 participants (7 women, mean age = 26.5 yrs, range 19 to 39 yrs).
Stimuli
Emotional faces were taken from the NimStim-MacBrain Face Stimulus Set, overseen by Nim Tottenham and supported by the John D. and Catherine T. MacArthur Foundation Research Network on Early Experience and Brain Development. Please contact Nim Tottenham at tott0006@tc.umn.edu for more information concerning the stimulus set. In brief, it is a set of static, color photographs of male and female actors’ faces exhibiting diverse negative and positive facial emotional expressions. From this set, we selected fearful and angry open-mouth facial displays from 30 different actors (50% women). Geometric shapes, ovals and rectangles, were created in horizontal orientation and varied among 6 different colors across trials. Figure 1 presents sample face and shape stimuli. All stimuli were back-projected onto a screen positioned approximately 75cm from the participant. A fiber-optic button box was used to record responses of the participants.
Procedure
Participants completed two runs of a matching task with each run consisting of 120 trials divided into 6 blocks (5s break between blocks). Each trial consisted of a 1s presentation of a triad of faces or geometric shapes with a triangular arrangement (Figure 1). The top image was defined as the target, and participants were instructed to match it with either the bottom left or bottom right image by button press. To cue participants to a new trial, triads were preceded 500-600ms by rectangular cues of the same dimension in the same locations. Participants were instructed to fixate the target image location to limit early eye movements. Following 1s presentation of a triad, participants were cued to make a manual response. They were asked to only make a response after triad presentation ended; since responses were withheld for a 1s duration, reaction times were unlikely to contain information about task difficulty or speed of mediating cognitive processes and were therefore not analyzed. There was a 2s interval between the end of a triad presentation and the onset of a new set of fixation cues. Across trials within a run, the same target image was never repeated, although the same actor posing an angry or fearful expression may have been presented as the target image on two different trials and the same image may have served as the target on one trial and as the distractor image on another. The distractor image was always a different actor posing a different emotional expression than the target image.
In one run, blocks alternated between the face-matching task and shape-matching task, with 20 trials per block and 3 blocks per task. Each block began with the relevant instructions presented on the screen for 5 s (i.e., “Match Faces” or “Match Shapes”). The blocked format closely matches the design typically conducted in fMRI studies (blocked run). We also administered a second run in which the two tasks were intermixed, with instructions to “Match Stimuli” after every 20 trials (randomized run). In the randomized run, the order of task trials was pseudo-randomized with the constraint that there were no more than 3 consecutive trials of either face-matching or shape-matching. The order of blocked and randomized runs was counterbalanced across participants.
Data Acquisition
Neuromagnetic activity was measured in a magnetically-shielded room (Vacuumschmelze, Germany) with a CTF-OMEGA whole-head magnetometer equipped with 275 radial 1st order gradiometers (VSM MedTech, Ltd., Canada). Synthetic 3rd gradient balancing was used for active noise cancellation (Vrba & Robinson, 1999). Magnetic flux density was digitized at a 1200Hz rate with a bandwidth of 0-300Hz. Fiducial coils were attached to the nasion and right and left preauricular sites. Coils were energized before and after data collection of each run to determine head position in the dewar. Total head displacement during a run was recorded at the end.
Magnetic resonance images (MRI) were obtained in a separate session using a 3-Tesla whole-body scanner (GE Signa, USA). A high resolution T1-weighted anatomical image was obtained from each participant with the same three fiducial sites indicated by radiological markers (IZI Medical Products Corp, USA).
Event-related beamformer analysis
Typically, source power is calculated for a time window of 100ms or more, thus limiting temporal resolution in adaptive beamformer analyses. It is possible to estimate source activity at the same sampling rate at which the data were collected by projection of a virtual sensor time series using the beamformer weights. However, these time series contain a high amount of uncorrelated noise and thus appear to be without clear temporal structure. Several strategies have been developed to reduce noise in virtual sensor time series (e.g., Sekihara, Nagarajan, Poeppel, Marantz, & Miyashita, 2002). For instance, one technique has been introduced, event-related beamformer analysis, that involves time-domain averaging of estimated source activity to attenuate noise and extract the stimulus-locked evoked responses of various sources (Cheyne, Bakhtazad, & Gaetz, 2006; Robinson, 2004). Cheyne et al. (2006) was able to resolve multiple sources within somatosensory and motor cortices along with their individual time courses of evoked activity during movement preparation and execution. We have adopted a similar approach to study the time course of amygdala activity.
The following analyses were done individually for the blocked and randomized trial runs. A single covariance matrix was calculated over unaveraged 1-sec epochs of both face-matching and shape-matching trials (120 trials in total), from -500 to +500ms relative to face and shape onset, with a 2-30Hz bandpass filter. Beamformer weights were calculated with the normalized vector formulation of Sekihara et al. (2001), which determines the optimal source orientation in three dimensional space at each voxel location. Independent calculations were performed in 7mm steps across the volume, using a multi-sphere head model derived from individual participants’ structural MRIs and based on gross brain morphology. At each voxel, virtual sensor time series were projected by vector multiplication of the data time series by the beamformer weights. The virtual sensor time series were then averaged in the time domain for face epochs and shape epochs separately.
Before visualizing putative time courses of amygdala activity in each run, we performed volumetric analyses to study the spatial distribution of evoked activity to faces and shapes. Because we did not know a priori the specific shape or latency of these evoked responses, volumetric analyses were done for evoked activity integrated over 100ms time windows from -200 to 500ms relative to stimulus onset, using a sliding window approach with 50% overlap in time. Average evoked activity was directly contrasted between face and shape trials in corresponding windows by taking the ratio of mean power in each signal; these power ratios were log10 transformed to create a symmetric distribution centered at zero, with positive values indicating more activity for faces and negative values indicating more activity for shapes at a particular voxel:
where F is the voxel statistic, xi refers to sample values in a target window, xj refers to sample values in a baseline window and n represents the window length in samples.
Volumetric images were processed in the following sequence using AFNI software (Cox, 1996). Source images were spatially co-registered to participants’ anatomical MRIs using the fiducial markers and normalized within-volume (i.e., individual voxel values were divided by the volume-wide standard deviation) to compensate for inter-subject variability in global power. All images were then spatially warped into a common Talairach space for group analyses. One-sample Student t tests were conducted for each time window comparing source power ratios against a test case of zero, with the null hypothesis being equal power for faces and shapes. To correct for multiple comparisons, false discovery rates (FDR) were computed for each image for the blocked and randomized data (Genovese, Lazar & Nichols, 2002; Logan & Rowe, 2004). An FDR of 10% or less (q ≤ .10) was established as the criterion for rejection of the null hypothesis for each voxel. To further limit the probability of false positives, we report only those voxels that survived a criterion of q ≤ .10 in both the blocked and randomized runs. In other words, we considered as statistically significant only those local regions showing a greater response to faces compared to shapes regardless of the format of trial presentation.
Based on these group statistical results, we projected the virtual sensor time series for the local maximum among those remaining voxels surviving multiple comparison correction in the left amygdala and also in the left fusiform gyrus (see Results). The spatial coordinates defining the local maximum were reverse transformed from Talairach space to individual subjects’ spaces before final projection of the virtual sensor time series corresponding to these sources. Because virtual sensor time series are based on estimates of dipole activity with a known orientation but unknown polarity, individual subjects’ data may show opposite polarity at peak latencies. We therefore rectified these time series by taking absolute values, and determined peak latency from the grand-averaged rectified time series (data not shown). In order to compute grand-averaged virtual sensor time series without first rectifying these data, we inverted those time series that showed negative polarity at the peak latency identified in the grand-averaged rectified data.
To demonstrate the spatial selectivity of source activity in the left amygdala, we performed additional volumetric analyses for single subjects. Using the estimated peak latency of amygdala activity in the blocked and randomized runs, we defined a 10ms window centered at the peak and directly contrasted average evoked activity to faces relative to shapes (as we did for the initial set of volumetric analyses using 100ms windows).
Experiment 2
To replicate our findings from Experiment 1, we conducted a second experiment with one modification to the procedure to potentially increase the salience of the emotional content of the faces and constrain the ways in which participants could make correct judgments. For Experiment 2, each triad of faces consisted of three images of the same individual actor so that emotional expression became the diagnostic criterion for making the correct matching response. Moreover, participants were instructed to focus on the emotional expression of the faces to make their matching judgments. In Experiment 1, by contrast, the distractor face was not only different in emotional expression but also different in identity from the other faces, allowing the possibility that participants developed other strategies for making correct judgments without attending to the emotional content of the faces (i.e., identity-based judgment). Because of evidence suggesting that greater attention to the emotional content of faces leads to greater amygdala activity (Pessoa et al., 2006; Pessoa et al., 2002), we expected that an amygdala response to negative emotional faces would be stronger in those participants who were forced to actively attend to the emotional content of the faces (i.e., a greater effect size). All other procedures were identical to Experiment 1.
Participants
Eight additional healthy participants (3 women), mean age = 25.4 yrs, range = 22 to 32 yrs) were recruited for Experiment 2. One participant was excluded from analysis for excessive head movement, leaving 7 participants (3 women, mean age = 24.4 yrs, range = 22 to 29 yrs).
Acknowledgments
This research was supported by the intramural research program at the National Institute of Mental Health. We would like to thank Arter Biggs for his assistance in obtaining MRIs from participants. We are grateful to Stephen Robinson (Neuromagnetism Laboratory, Department of Neurology, Henry Ford Hospital, Detroit, MI) for developing the SAMerf program that we used for event-related beamformer analysis.
Footnotes
Publisher's Disclaimer: This is a PDF file of an unedited manuscript that has been accepted for publication. As a service to our customers we are providing this early version of the manuscript. The manuscript will undergo copyediting, typesetting, and review of the resulting proof before it is published in its final citable form. Please note that during the production process errors may be discovered which could affect the content, and all legal disclaimers that apply to the journal pertain.
Literature References
- Adolphs R. Recognizing emotion from facial expressions: Psychological and neurological mechanisms. Behav Cogn Neurosci Rev. 2002;1(1):21–62. doi: 10.1177/1534582302001001003. [DOI] [PubMed] [Google Scholar]
- Baas D, Aleman A, Kahn RS. Lateralization of amygdala activation: a systematic review of functional neuroimaging studies. Brain Res Rev. 2004;45:96–103. doi: 10.1016/j.brainresrev.2004.02.004. [DOI] [PubMed] [Google Scholar]
- Bertolino A, Arciero G, Rubino V, Latorre V, De Candia M, Mazzola V, et al. Variation of human amygdala response during threatening stimuli as a function of 5’HTTLPR genotype and personality style. Biol Psychiatry. 2005;57:1517–1525. doi: 10.1016/j.biopsych.2005.02.031. [DOI] [PubMed] [Google Scholar]
- Buchel C, Morris J, Dolan RJ, Friston KJ. Brain systems mediating aversive conditioning: an event-related fMRI study. Neuron. 1998;20:947–957. doi: 10.1016/s0896-6273(00)80476-6. [DOI] [PubMed] [Google Scholar]
- Calder AJ, Lawrence AD, Young AW. Neuropsychology of fear and loathing. Nat Neurosci Rev. 2001;2:352–363. doi: 10.1038/35072584. [DOI] [PubMed] [Google Scholar]
- Cheyne D, Bakhtazad L, Gaetz W. Spatiotemporal mapping of cortical activity accompanying voluntary movements using an event-related beamforming approach. Hum Brain Mapp. 2006;27:213–229. doi: 10.1002/hbm.20178. [DOI] [PMC free article] [PubMed] [Google Scholar]
- Cornwell BR, Baas JM, Johnson L, Holroyd T, Carver FW, Lissek S, Grillon C. Neural responses to auditory stimulus deviance under threat of electric shock revealed by spatially-filtered magnetoencephalography. NeuroImage. 2007;37:282–289. doi: 10.1016/j.neuroimage.2007.04.055. [DOI] [PMC free article] [PubMed] [Google Scholar]
- Cornwell BR, Johnson LL, Holroyd T, Carver FW, Grillon C. Human hippocampal and parahippocampal theta during goal-directed spatial navigation predicts performance on a virtual Morris water maze. J Neurosci. 2008;28:5983–5990. doi: 10.1523/JNEUROSCI.5001-07.2008. [DOI] [PMC free article] [PubMed] [Google Scholar]
- Cox RW. AFNI: Software for analysis and visualization of functional magnetic resonance neuroimages. Comput Biomed Res. 1996;29:162–173. doi: 10.1006/cbmr.1996.0014. [DOI] [PubMed] [Google Scholar]
- Davidson RJ, Irwin W. The functional neuroanatomy of emotion and affective style. Trends Cogn Sci. 1999;3(1):11–21. doi: 10.1016/s1364-6613(98)01265-0. [DOI] [PubMed] [Google Scholar]
- First MB, Spitzer RI, Williams JBW, Gibbon M. Structured clinical interview fro DSM-IV (SCID) Washington, DC: American Psychiatric Association; 1995. [Google Scholar]
- Garolera M, Coppola R, Munoz KE, Elvevag B, Carver FW, Weinberger DR, Goldberg TE. Amygdala activation in affective priming: a magnetoencephalogram study. Neuroreport. 2007;18:1449–1453. doi: 10.1097/WNR.0b013e3282efa253. [DOI] [PubMed] [Google Scholar]
- Genovese CR, Lazar NA, Nichols T. Thresholding of statistical maps in functional neuroimaging using false discovery rates. Neuroimage. 2002;15:772–786. doi: 10.1006/nimg.2001.1037. [DOI] [PubMed] [Google Scholar]
- Halgren E, Bauden P, Heit G, Clark JM, Marinkovic K. Spatiotemporal stages of face and word processing. 1. Depth-recorded potentials in the human occipital, temporal and parietal lobes. J Physiol. 1994;88:1–50. doi: 10.1016/0928-4257(94)90092-2. [DOI] [PubMed] [Google Scholar]
- Hariri AR, Mattay VS, Tessitore A, Kolachana B, Fera F, Goldman D, Egan MF, Weinberger DR. Serotonin transporter genetic variation and the response of the human amygdala. Science. 2002a;297(5580):400–403. doi: 10.1126/science.1071829. [DOI] [PubMed] [Google Scholar]
- Hariri AR, Tessitore A, Mattay VS, Fera F, Weinberger DR. The amygdala response to emotional stimuli: a comparison of faces and scenes. NeuroImage. 2002b;17:317–323. doi: 10.1006/nimg.2002.1179. [DOI] [PubMed] [Google Scholar]
- Haxby JV, Hoffman EA, Gobbini MI. The distributed human neural system for face perception. Trends Cog Sci. 2000;4:223–233. doi: 10.1016/s1364-6613(00)01482-0. [DOI] [PubMed] [Google Scholar]
- Hillebrand A, Singh KD, Holliday IE, Furlong PL, Barnes GR. A new approach to neuroimaging with magnetoencephalography. Hum Brain Mapp. 2005;25:199–211. doi: 10.1002/hbm.20102. [DOI] [PMC free article] [PubMed] [Google Scholar]
- Ioannides AA, Liu LC, Kwapien J, Drozdz S, Streit M. Coupling of regional activations in a human brain during an object and face affect recognition task. Hum Brain Mapp. 2000;11:77–92. doi: 10.1002/1097-0193(200010)11:2<77::AID-HBM20>3.0.CO;2-0. [DOI] [PMC free article] [PubMed] [Google Scholar]
- Krolak-Salmon P, Henaff MA, Vighetto A, Bertrand B, Mauguiere F. Early amygdala reaction to fear spreading in occipital, temporal, and frontal cortex: A depth electrode ERP study in human. Neuron. 2004;42(4):665–676. doi: 10.1016/s0896-6273(04)00264-8. [DOI] [PubMed] [Google Scholar]
- LaBar KS, Gatenby JC, Gore JC, LeDoux JE, Phelphs EA. Human amygdala activation during conditioned fear acquisition and extinction: a mixed-trial fMRI study. Neuron. 1998;20:937–945. doi: 10.1016/s0896-6273(00)80475-4. [DOI] [PubMed] [Google Scholar]
- Lancaster JL, Woldorff MG, Parsons LM, Liotti M, Freitas CS, Rainey L, Kochunov PV, Nickerson D, Mikiten SA, Fox PT. Automated Talairach atlas labels for functional brain mapping. Hum Brain Mapp. 2000;10:120–131. doi: 10.1002/1097-0193(200007)10:3<120::AID-HBM30>3.0.CO;2-8. [DOI] [PMC free article] [PubMed] [Google Scholar]
- Liu J, Harris A, Kanwisher N. Stages of processing in face perception: an MEG study. Nat Neurosci. 2002;5(9):910–916. doi: 10.1038/nn909. [DOI] [PubMed] [Google Scholar]
- Logan BR, Rowe DB. An evaluation of thresholding techniques in fMRI analysis. Neuroimage. 2004;22:95–108. doi: 10.1016/j.neuroimage.2003.12.047. [DOI] [PubMed] [Google Scholar]
- Luo Q, Holroyd T, Jones M, Hendler T, Blair J. Neural dynamics for facial threat processing as revealed by gamma band synchronization using MEG. NeuroImage. 2007;34(2):839–847. doi: 10.1016/j.neuroimage.2006.09.023. [DOI] [PMC free article] [PubMed] [Google Scholar]
- Moses SN, Houck JM, Martin T, Hanlon FM, Ryan JD, Thoma RJ, et al. Dynamic neural activity recorded from human amygdala during fear conditioning using magnetoencephalography. Brain Res Bull. 2007;71:452–460. doi: 10.1016/j.brainresbull.2006.08.016. [DOI] [PubMed] [Google Scholar]
- Pessoa L, Japee S, Sturman D, Ungerleider LG. Target visibility and visual awareness modulate amygdala responses to fearful faces. Cereb Cortex. 2006;16(3):366–375. doi: 10.1093/cercor/bhi115. [DOI] [PubMed] [Google Scholar]
- Pessoa L, McKenna M, Gutierrez E, Ungerleider LG. Neural processing of emotional faces requires attention. Proc Natl Acad Sci USA. 2002;99:1458–1463. doi: 10.1073/pnas.172403899. [DOI] [PMC free article] [PubMed] [Google Scholar]
- Robinson SE. Localization of event-related activity by SAM(erf) Neurol Clin Neurophysiol. 2004;109 [PubMed] [Google Scholar]
- Robinson SE, Vrba J. Functional neuroimaging by synthetic aperture magnetometry. In: Yoshimine T, Kotani M, Kuriki S, Karibe H, Nakasato N, editors. Recent Advances in Biomagnetism: Proceedings from the 11th International Conference on Biomagnetism. Sendai: Tokoku University Press; 1999. pp. 302–305. [Google Scholar]
- Sekihara K, Nagarajan SS, Poeppel D, Marantz A, Miyashita Y. Reconstructing spatio-temporal activities of neural sources using an MEG vector beamformer technique. IEEE Trans Biomed Eng. 2001;48:760–771. doi: 10.1109/10.930901. [DOI] [PubMed] [Google Scholar]
- Sekihara K, Nagarajan SS, Poeppel D, Marantz A, Miyashita Y. Application of an MEG eigenspace beamformer to reconstructing spatio-temporal activities of neural sources. Hum Brain Mapp. 2002;15(4):199–215. doi: 10.1002/hbm.10019. [DOI] [PMC free article] [PubMed] [Google Scholar]
- Singh KD, Barnes GR, Hillebrand A, Forde EME, Williams AL. Task-related changes in cortical synchronization are spatially coincident with the hemodynamic response. NeuroImage. 2002;16:103–114. doi: 10.1006/nimg.2001.1050. [DOI] [PubMed] [Google Scholar]
- Schultz M, Chau W, Graham SJ, McIntosh AR, Ross B, Ishii R, Pantev C. An integrative MEG-fMRI study of the primary somatosensory cortex using cross-modal correspondence analysis. NeuroImage. 2004;22:120–133. doi: 10.1016/j.neuroimage.2003.10.049. [DOI] [PubMed] [Google Scholar]
- Streit M, Dammers J, Simsek-Kraues S, Brinkmeyer J, Wolwer W, Ioannides A. Time course of regional brain activations during facial emotion recognition in humans. Neurosci Lett. 2003;342(1):101–104. doi: 10.1016/s0304-3940(03)00274-x. [DOI] [PubMed] [Google Scholar]
- Taniguchi M, Kato A, Fujita N, Hirata M, Tanaka H, Kihara T, et al. Movement-related desynchronization of the cerebral cortex studied with spatially filtered magnetoencephalography. NeuroImage. 2000;12:298–306. doi: 10.1006/nimg.2000.0611. [DOI] [PubMed] [Google Scholar]
- Tesche CD, Karhu J. Theta oscillations index human hippocampal activation during a working memory task. Proc Natl Acad Sci USA. 2000;97(2):919–924. doi: 10.1073/pnas.97.2.919. [DOI] [PMC free article] [PubMed] [Google Scholar]
- Van Veen BD, van Drongelen W, Yuchtman M, Suzuki A. Localization of brain electrical activity via linearly constrained minimum variante spatial filtering. IEEE Trans Biomed Eng. 1997;44:867–880. doi: 10.1109/10.623056. [DOI] [PubMed] [Google Scholar]
- Vrba J, Robinson SE. Signal processing in magnetoencephalography. Methods. 1999;25:249–271. doi: 10.1006/meth.2001.1238. [DOI] [PubMed] [Google Scholar]
- Wager TD, Phan KL, Liberzon I, Taylor SF. Valence, gender, and lateralization of functional brain anatomy in emotion: a meta-analysis of findings from neuroimaging. NeuroImage. 2003;19:513–531. doi: 10.1016/s1053-8119(03)00078-8. [DOI] [PubMed] [Google Scholar]