Abstract
We present a novel type of spectral diffusion experiment in the millikelvin range to characterize the energy landscape of a protein as compared with that of a glass. We measure the time evolution of spectral holes for more than 300 hr after well-defined initial nonequilibrium conditions. We show that the model of noninteracting two-level systems can describe spectral diffusion in the glass, but fails for the protein. Our results further demonstrate that randomness in the energy landscape of a protein shows features of organization. There are “deep minimum” states separated by barriers, the heights of which we are able to estimate. The energy landscape of a glass is featureless by comparison.
Keywords: myoglobin, hole burning, relaxation, order-disorder
The folding routes, the three-dimensional structure, the dynamics, and the specific functions of a protein are all determined by the protein’s energy landscape. This landscape is very complex and, hence, very difficult to measure (1), even qualitatively. What is well known, so far, is that despite the high level of structural organization (2), there is randomness in the energy landscape (3), which is reflected, for instance, in a variation of Debye–Waller factors in x-ray diffraction (4, 5), in inhomogeneous line broadening (6–8), in dispersive kinetics (9–11), and in spectral diffusion (6, 8, 12–14). Much less is known about whether the randomness itself shows features of organization. It was suggested over a decade ago that the energy landscape of a protein may be organized in a hierarchical fashion (15). Recently, we found evidence for such self-similar features, although only in a qualitative sense, based on spectral diffusion experiments in the millikelvin range (13). The results showed that features in the energy landscape that were found at temperatures where the molecules become physiologically active (16) were also found in experiments below 1 K. These features are the roughness of the energy surface and the so-called deep minimum states. Quite recently, stimulated echo experiments on Zn–protophorphyrin–IX-substituted myoglobin have shown that the self-similar organization of the energy landscape may even hold in a quantitative sense (17, 18).
EXPERIMENTAL DETAILS
As stated above, the experimental access to specific structures in the energy landscape of proteins is difficult and not always very direct. It is the interplay of various techniques that eventually leads to a consistent picture. Our approach is persistent spectral hole burning (for reviews, see refs. 6 and 19–22). This technique has several quite attractive features. First, this technique has high spectral resolution, which allows for experiments close to the natural linewidth limit. Second, the persistency of the holes allows for experiments with nearly unlimited time scales. Third, extreme sensitivity allows the experimentalist to work with light power levels in the nanowatt range. This, in turn, makes optical experiments in the millikelvin range possible.
The experiments on which we report here involve spectral diffusion. In these experiments the change of the linewidth of an optical transition is investigated as a function of time. Hole burning is probably the best technique for spectral diffusion experiments. In the past decade it has mainly been exploited in experiments on glasses (23, 24), but several experiments on proteins have appeared as well (6, 12, 13). Two types of spectral diffusion experiments are common: (i) time-dependent experiments where the width of a hole is monitored as a function of waiting time after burning (25) and (ii) temperature-cycling experiments where the width of a hole immediately after the cycle is monitored as a function of cyclic temperature changes (26, 27).
In this paper we report on a novel type of spectral diffusion experiment that involves a combination of the above two experiments. The novelty of the experiment concerns the initial condition: The sample is allowed to equilibrate for about 10 days at a temperature of 100 mK before burning the first hole (hole A). After hole burning, a cyclic temperature change is carried out, which has a well-defined excursion temperature (the highest temperature in the cycle) and a well-defined duration. Immediately after the temperature cycle, a second hole (hole B) is burnt. The widths of both holes A and B are measured as a function of time at 100 mK. Because the two holes were burnt after different initial conditions, they are expected to behave differently. With the protein we performed two independent experiments, both with an equilibration period of 10 days. The excursion temperatures, however, were different, namely 4 and 8 K, respectively. The duration of the temperature cycle in both cases was about 80 min. After the temperature cycle both holes were observed for about 300 hr. As a comparison, we performed an additional experiment on a glass, which had an excursion temperature of 4 K, and all other conditions were identical.
The protein investigated was protoporphyrin–IX-substituted myoglobin (see Fig. 1). It was dissolved in a glycerol/water glass [2.5:1 (vol/vol)] at a concentration chosen in a way to yield an optical density of 0.2 in a 1.2 mm cuvette. In the comparative glass sample, the dye probe was also protoporphyrin IX. However, the glass was modified to ensure solubility. We used a mixture of glycerol with dimethylformamide [2.5:1 (vol/vol)].
Figure 1.
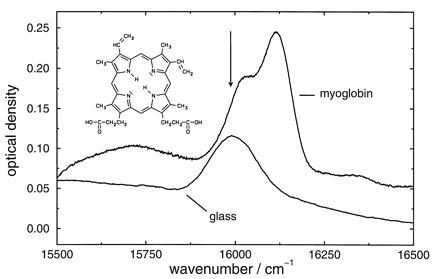
Inhomogeneous absorption spectrum of protoporphyrin–IX-substituted myoglobin in a glycerol/water glass and of protoporphyrin IX in a glycerol/dimethylformamide glass. Concentrations: myoglobin in glycerol/water, 290 mg: 2.5 ml:1 ml; protoporphyrin IX in glycerol/dimethylformamide = 0.25 mg: 2.5 ml:1 ml. Temperature is 100 mK. The arrow indicates where hole burning was performed. (Inset) The chromophore.
Spectral hole burning in protoporphyrin IX is quite efficient. The photoreaction is a rearrangement of the two inner-ring protons (28, 29). Hole burning was performed with a ring dye laser with a resolution of about 500 kHz. Burning times and power levels were on the order of 2 min and 150 nW/cm2, respectively. The experiments were performed in a 3He–4He-dilution cryostat with optical windows. The temperature was measured in the mixing chamber with a germanium resistor and was accurate to within 1 mK at 100 mK. To ensure a proper thermal coupling between sample and mixing chamber, a platinum ribbon directly immersed in the sample was flanged to the mixing chamber. The holes were detected in transmission. To this end, the platinum ribbon had a 2.5-mm hole. A dilution cryostat works in a closed cycle fashion, and hence experimental time is, in principle, unlimited.
RESULTS
Fig. 1 shows the inhomogeneous absorption bands of the protein and the glass sample. The arrow indicates the wavenumber where hole burning was performed. The results for the hole broadening for the protein experiment with a cycle temperature of 4 K are summarized in Fig. 2. The spectra of hole A are shown in the insert: spectrum I reflects the hole at 100 mK after the 10 days equilibration period but before the temperature cycle. We consider it as a marker of the protein state after the equilibration period. Spectrum II reflects the hole immediately after the temperature cycle. The spectral diffusion width of hole A runs through a time regime where it narrows considerably. This regime lasts for about 10 hr. It is followed by a regime where broadening dominates. Spectral diffusion narrowing with time in proteins is a novel observation that is described here for the first time.
Figure 2.
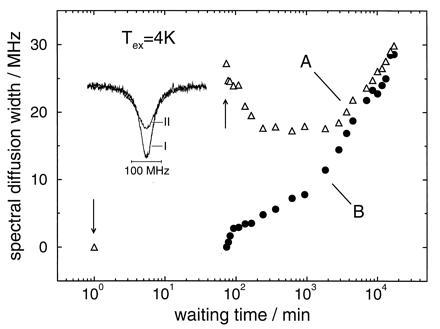
(A) Spectral diffusion width of a hole after a cyclic temperature variation between 100 mK and 4 K as a function of waiting time. (B) Spectral diffusion width of a hole burnt immediately after the cyclic temperature variation between 100 mK and 4 K as a function of waiting time. The insert shows hole A before (I) and immediately after (II) the temperature cycle (arrows). Sample: protoporphyrin–IX-substituted myoglobin in a glycerol/water glass.
Immediately after the cycle, the protein is far from equilibrium. Hole B can be considered as a marker of this nonequilibrium state. Hole B broadens as a function of time. An interesting question concerns the asymptotic behavior of the time-dependent line broadening of the two holes. Fig. 2 clearly demonstrates that, for the protein, there is an asymptotic approach but no crossing.
The experimental results on the protein for an excursion temperature of 8 K are shown in Fig. 3, and are very similar to the ones for the lower cycling temperature. It is quite surprising that the hole width as a function of time not only shows the same qualitative features, namely a narrowing regime followed by a broadening regime, but also has almost identical absolute magnitudes, at least for the first 10 hr, despite the much higher excursion temperature. In the asymptotic time regime, broadening was somewhat stronger at the higher excursion temperature but, again, the linewidths of the two holes avoid crossing and approach each other.
Figure 3.
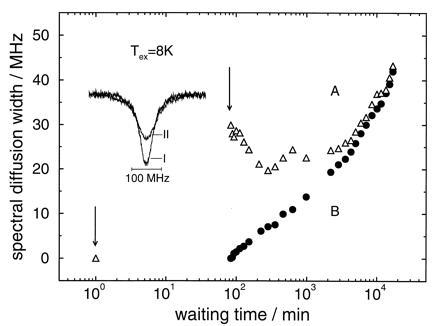
Same as Fig. 2, except the cycle temperature is 8 K instead of 4 K.
In the glass sample (Fig. 4), the situation is drastically different. First, although the widths of the initial marker holes (holes A, spectrum I) are comparable for protein and glass samples, the broadening upon a temperature excursion to 4 K is much larger in the glass (by almost a factor of 4) than in the protein. This large broadening is the reason for the strong scattering of the data. Second, like the protein, the glass sample shows a time regime where hole A narrows. However, even after a waiting time of almost 300 hr there is no indication of a minimum in the linewidth and no onset of a broadening regime. Third, hole B broadens more strongly in the glass than in the protein. Finally, unlike the protein, in the glass there is no asymptotic approach of the two line broadening curves for holes A and B. Instead they appear to cross!
Figure 4.
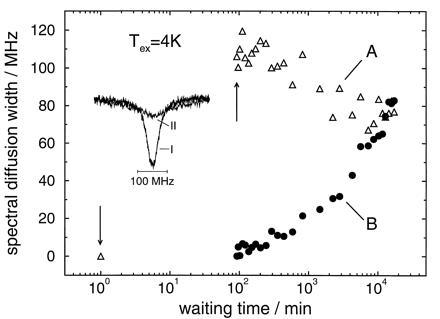
(A) Spectral diffusion width of a hole burnt at 100 mK after a temperature excursion to 4 K as a function of waiting time. (B) Spectral diffusion width of a hole burnt at 100 mK immediately after the temperature excursion. The insert shows hole A before (I) and immediately after (II) the temperature cycle (arrows). Sample: protoporphyrin IX in glycerol/dimethylformamide.
We note that the very different time evolutions of hole A for the protein and glass systems provide clear evidence that the protein experiments are measuring protein rather than glass dynamics. This conclusion is also supported by previous thermal cycling experiments (13).
In summary, the results show that the protein and glass have quite different and specific features in their spectral diffusion dynamics. These specific features presumably reflect specific properties of the respective energy landscapes. Our goal is to elucidate these properties for the protein by using the glass as a normative state.
DISCUSSION
A necessary condition for spectral diffusion to be observed is that a specific class of conformations, namely those whose chromophores have identical excitation energies, can be marked. In our case this is done by burning a narrow hole. As time passes, the selected conformations change due to structural dynamics. Concomitantly, the microscopic interactions between the dye probes and the lattice change, causing changes in the transition frequencies of the chromophores, which leads to an increase in the width of the initial hole. The change in linewidth (the so-called spectral diffusion broadening) is the quantity measured.
Traditionally, spectral diffusion in low-temperature glasses is interpreted within the two-level system (TLS) model (23–25, 30–33). In this model the relevant conformational changes in the chromophore’s environment are assumed to involve a set of uncoupled double-well potentials, each of which has two low-energy quantum states. Each TLS is characterized by an energy splitting, E, and a relaxation rate, R, for making transitions between the two states. R depends on E and increases with increasing temperature. The TLS is coupled to the chromophore by electrostatic or strain dipolar interactions.
In the TLS model, the spectral diffusion broadening γ occurring within a time t is proportional to the average number of TLS that have changed their state in this time. For a system in thermal equilibrium at a temperature T, this is proportional to (30, 31, 33, 34):
 |
1 |
where p(T) = [1 + eE/kT]−1 is the probability of finding a TLS with splitting E in its excited state, and the angular brackets indicate an average over the TLS parameters.
Let us, for the moment, suppose that both the glass and the protein experiments reported in this paper can be described by the TLS model. The thermal cycling experiments are not performed under equilibrium conditions, and therefore the above expression is not applicable. Although a quantitative calculation for these nonequilibrium experiments is quite involved (35), one can reach some interesting conclusions from reasonably general arguments, which we outline below. Before hole A was burnt, the system was cooled for 10 days at 100 mK. The ensemble of TLS is described by a very wide distribution of relaxation rates. Most of the TLS have relaxation rates at 100 mK that are faster than 0.1 day−1, and so they will be in equilibrium at the end of the cooling period. However, some of the TLS have relaxation rates that are slower than 0.1 day−1, and hence they will not be in equilibrium (36). Nonetheless, for simplicity, we will assume that by the end of the cooling period all of the TLS are in equilibrium at 100 mK ≡ Ti. Next consider what happens during the 80-min thermal cycle at, for example, 4 K. Recall that the rates of individual TLS increase with temperature. Some of the TLS have such slow rates that they are unlikely to flip, even at this relatively high temperature. Since these same TLS are even more unlikely to flip after the temperature is lowered again, they will not contribute to the spectral diffusion broadening, and can be neglected. On the other hand, faster TLS will have flipped once, twice, or many times during the cycle. Therefore, as a first approximation we will assume that by the end of the cycle the populations of these TLS are characterized by Boltzmann equilibrium at the cycle temperature, Tc. At this point the temperature is returned to 100 mK, and the TLS relax from what is now a nonequilibrium state back to equilibrium.
With these assumptions it is straightforward to show, by calculating the number of TLS that have changed state since the hole was burnt, that the widths of holes B and A are given by
 |
2 |
 |
3 |
where γ is a constant and the indices i and c refer to Ti = 100 mK and Tc = 4 and 8 K, respectively.
 |
 |
4 |
and t is the time after the thermal cycle. Given the temperature ordering Tc > Ti, it follows that p(Ti)[1 − p(Tc)] + p(Tc)[1 − p(Ti)] > 2p(Ti)[1 − p(Ti)]. Therefore, one can show with complete generality, that is, for any model for the distributions of TLS parameters, that fic(t) > fii(t). It is also easy to show that fαβ(t) and fic(t) − fii(t) are monotonically increasing functions of t. In addition, clearly fαβ(0) = 0. From the above, it follows that: (i) γA(t) is a monotonically decreasing function of t; (ii) γA(0) ≥ γB(t) for all t; (iii) γA(∞) < γB(∞). The first statement is self-explanatory; the second means that the broadening of hole B is bounded from above by the initial value of hole A; and the third statement means that the curves for γA(t) and γB(t) must cross, since γA(0) > γB(0) = 0.
Now let us examine the experimental data for the protein and the glass within the context of this TLS model. The curves for the glass (Fig. 4) are in agreement with all three of the above statements, indicating that the glass behavior is consistent with the TLS model described above. On the other hand, for the protein (Figs. 2 and 3), for each cycling temperature all three statements are violated! This indicates that the protein data is clearly not consistent with this TLS model.
We can rationalize these findings for the protein experiments with the following explanation. The violation of the three statements described above is consistent with the idea that both holes A and B show more broadening than is predicted by the TLS model. Therefore, it follows that during the temperature cycle some structural rearrangement occurred that produced broadening of the holes over and above that predicted by the TLS model. One way to interpret this result is by invoking interacting TLS (36–39). Suppose, for instance, that there is one special TLS whose relaxation rate is essentially zero at 100 mK, but which is faster at 4 K than the inverse of the time of the thermal cycle. Therefore, during the cycle this TLS can flip. If this special TLS is coupled to the other ones, it means that when this TLS makes a transition it changes the parameters and/or identities of the other TLS. Such an assumption will, very generally, lead to a broadening of both holes A and B in the thermal cycling experiment greater than that predicted by the noninteracting TLS model described above.
Thinking more generally, one can abandon the TLS description entirely, and consider more global features of the protein’s energy landscape. This landscape has basins separated by saddle points. At the low temperature of 100 mK, each protein molecule finds itself near the bottom of one of these basins. Specific conformational substates are selected by hole burning, and transitions to other conformational substates within each basin lead to normal spectral diffusion. During the thermal cycle the system accesses many new configurations, and hence the initial value (after the cycle) of hole A is quite large. If, after the thermal cycle, each protein molecule remains in its original energy basin, then as the system relaxes back to equilibrium the width of hole A will decrease. If, however, during the thermal cycle each molecule makes a transition to a new basin, then the width of hole A should not decrease appreciably. The fact that in these experiments the width of hole A first decreases and then levels off, suggests that during the thermal cycle the system is able to access one or more new energy basins. Some of the population remains in the original energy basin, leading to a significant decrease in the width of hole A, while the remaining population is transferred to new basins. In these experiments with cycle temperatures of 4 or 8 K, the number of new basins accessed must be quite small. That is, if it were substantially larger than one, the amount of population remaining in the original basin would be very small, as would the corresponding amplitude of the decrease in the width of hole A. One final point: The increase in the width of hole A at very long times presumably arises from transitions (possibly by tunneling) to new basins, that is, ones that were not accessed by the thermal cycle.
As discussed above, the thermal cycling experiment with an excursion temperature of 4 K shows that new energy basins are accessed during the cycle. If R is the rate for making a transition to a new basin, then this means that Rτ > 1, where τ is the duration of the thermal cycle. If one adopts a classical picture of motion on the energy landscape, then R = Ae−V/kT, where V is the barrier height and A is the preexponential factor. Rτ > 1 means that V < kTln(Aτ). From stimulated echo experiments, Thorn Leeson and Wiersma (17) have shown that A ≈ 107 s−1. Taking τ ≈ 80 min indicates that in our experiments the height of the saddle point separating the energy basins is less than about 100 K. Recall that the initial broadening of hole A for a cycle temperature of 8 K was nearly identical to that for the 4 K experiment. We interpret this to mean that there are no additional saddle points on the energy landscape between about 100 and 200 K, for if there were, they would be crossed in the higher temperature experiment, leading to greater spectral diffusion broadening immediately after the cycle.
Further information about the protein’s energy landscape can also be gleaned from these experiments. Since the narrowing of hole A after the cycle at 4 K is very slow (on the order of 10 hr), this suggests that the energy landscape below 4 K must be reasonably rough. In addition, since the time evolution of the holes after the 8 K cycle is nearly identical to that for the 4 K experiment, it suggests that the sides of the valleys on the landscape between 4 and 8 K must be relatively smooth—if they were rough one would expect that the time evolution of the holes after the 8 K experiment would be slower than for the 4 K experiment.
Earlier thermal cycling experiments (13), on the same system but with excursion temperatures of 1 K and below, showed that the initial broadening of hole A was much smaller than for the present experiments at cycling temperatures of 4 and 8 K. This fact indicates that the saddle points discussed above are at energies larger than about 25 K. In addition, the fact that spectral diffusion at 100 mK (in the absence of a thermal cycle) is observed (13) provides further support for the idea that the bottom of each energy basin is rough.
These features of the energy landscape are summarized schematically in Fig. 5. This picture supports the hierarchical nature of conformational substates, as proposed by Frauenfelder and coworkers (15). It is also similar to that derived from Mössbauer experiments at much higher temperatures (16). The stimulated photon echo experiments of Thorn Leeson and Wiersma (17) (see also ref. 40) suggest that the energy landscape has three tiers of barriers, with barrier heights of approximately 23, 44, and 85 K. We find evidence for barriers between about 25 and 100 K (and for the absence of barriers between about 100 and 200 K), which is consistent with this result.
Figure 5.
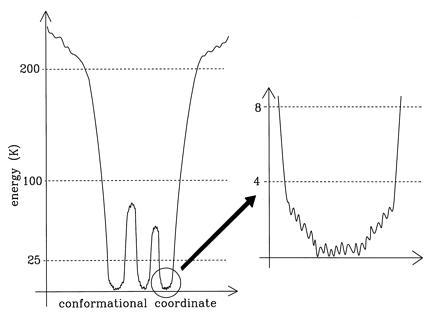
Features of the energy landscape of a protein. The protein is characterized by deep minimum states separated by barriers. The flatter areas are rough. Some energy scales (in Kelvin) as derived from our experiments are indicated.
CONCLUSIONS
Our spectral diffusion experiments demonstrate that randomness in the energy landscape of proteins is organized. That is, there are regions in the landscape that are relatively rough, and regions where the landscape is relatively smooth. Moreover, there are saddle points in the landscape at only specific energies, rather than at all energies. Given the high degree of structural organization in a protein, it is perhaps not so surprising that the randomness is organized as well. No such organization can be inferred from the experiments on the glass.
Our experiments also demonstrate that although the model of noninteracting TLSs describes the low-temperature structural dynamics of the glass satisfactorily, it fails for the protein. One possible reason for this failure may follow quite naturally from the high level of structural connectivity of the protein building blocks, through covalent bonds, hydrogen bonds, long-range interactions, etc. This connectivity makes it likely that a local rearrangement is coupled to the rest of the protein. This coupling between different regions of the protein is reminiscent of the allosteric effect, which is important for the proper functioning of many proteins at physiological temperatures.
Acknowledgments
We acknowledge stimulating discussions with Prof. Bob Silbey and Dr. Atusi Kurita. Financial support came from Deutsche Forschungsgemeinschaft (Graduiertenkolleg “Nichtlineare Spektroskopie und Dynamik,” SFB 279 C2) and the Fonds der Chemischen Industrie. J.L.S. acknowledges support from the National Science Foundation Grant CHE-9526815 and from the Humboldt Foundation.
Footnotes
Abbreviation: TLS, two-level system.
References
- 1.Frauenfelder H, Wolynes P. Phys Today. 1994;47:58–64. [Google Scholar]
- 2.Huber R. Angew Chemie Int Ed Engl. 1989;101:849–871. [Google Scholar]
- 3.Frauenfelder H, Parak F, Young R D. Annu Rev Biophys Biophys Chem. 1988;17:451–479. doi: 10.1146/annurev.bb.17.060188.002315. [DOI] [PubMed] [Google Scholar]
- 4.Frauenfelder H, Petsko G A, Tsernoglou D. Nature (London) 1979;280:558–563. doi: 10.1038/280558a0. [DOI] [PubMed] [Google Scholar]
- 5.Parak F, Hartmann H, Aumann K D, Reuscher H, Rennekamp G, Bartunik H, Steigemann W. Eur Biophys J. 1987;15:237–249. doi: 10.1007/BF00577072. [DOI] [PubMed] [Google Scholar]
- 6.Friedrich J. Methods Enzymol. 1995;246:226–259. doi: 10.1016/0076-6879(95)46012-8. [DOI] [PubMed] [Google Scholar]
- 7.Ormos P, Ansari A, Braunstein D, Cowen B R, Frauenfelder H, Hong M K, Iben J E T, Sauke T B, Steinbach P J, Young R D. Biophys J. 1990;57:191–199. doi: 10.1016/S0006-3495(90)82522-4. [DOI] [PMC free article] [PubMed] [Google Scholar]
- 8.Zollfrank J, Friedrich J, Vanderkooi J M, Fidy J. Biophys J. 1991;59:305–312. doi: 10.1016/S0006-3495(91)82224-X. [DOI] [PMC free article] [PubMed] [Google Scholar]
- 9.Frauenfelder H. Helv Phys Acta. 1984;57:165–187. [Google Scholar]
- 10.Ansari A, Berendzen J, Braunstein D, Cohen B R, Frauenfelder H, Hong M K, Iben I E T, Johnson J B, Ormos P, Sauke T B, Scholl R, Schulte A, Steinbach P J, Vittitow J, Young R D. Biophys Chem. 1987;26:337–355. doi: 10.1016/0301-4622(87)80034-0. [DOI] [PubMed] [Google Scholar]
- 11.Doster W, Bowne S F, Frauenfelder H, Reinisch L, Shyamsunder E. J Mol Biol. 1987;194:299–312. doi: 10.1016/0022-2836(87)90377-9. [DOI] [PubMed] [Google Scholar]
- 12.Zollfrank J, Friedrich J, Vanderkooi J M, Fidy J. J Chem Phys. 1991;95:3134–3136. [Google Scholar]
- 13.Gafert J, Pschierer H, Friedrich J. Phys Rev Lett. 1995;74:3704–3707. doi: 10.1103/PhysRevLett.74.3704. [DOI] [PubMed] [Google Scholar]
- 14.Shibata Y, Kurita A, Kushida T. J Chem Phys. 1996;104:4396–4405. [Google Scholar]
- 15.Ansari A, Berendzen J, Bowne S F, Frauenfelder H, Iben I E T, Sauke T B, Shyamsunder E, Young R D. Proc Natl Acad Sci USA. 1985;82:5000–5004. doi: 10.1073/pnas.82.15.5000. [DOI] [PMC free article] [PubMed] [Google Scholar]
- 16.Parak F, Knapp E W. Proc Natl Acad Sci USA. 1984;81:7088–7092. doi: 10.1073/pnas.81.22.7088. [DOI] [PMC free article] [PubMed] [Google Scholar]
- 17.Thorn Leeson D, Wiersma D A. Nat Struct Biol. 1995;2:821–823. doi: 10.1038/nsb1095-848. [DOI] [PubMed] [Google Scholar]
- 18.Thorn Leeson D, Wiersma D A. Phys Rev Lett. 1995;74:2138–2141. doi: 10.1103/PhysRevLett.74.2138. [DOI] [PubMed] [Google Scholar]
- 19.Friedrich J. In: Light in Biology and Medicine. Douglas R H, Moan J, Rontó G, editors. Vol. 2. New York: Plenum; 1991. pp. 345–356. [Google Scholar]
- 20.Friedrich J. Mol Cryst Liq Cryst. 1990;183:91–103. [Google Scholar]
- 21.Jankowiak R, Hayes J M, Small G J. Chem Rev. 1993;93:1471–1502. [Google Scholar]
- 22.Reddy N R S, Lyle P A, Small G J. Photosynth Res. 1992;31:167–194. doi: 10.1007/BF00035536. [DOI] [PubMed] [Google Scholar]
- 23.Friedrich J, Haarer D. In: Optical Spectroscopy of Glasses. Zschokke-Gränacher I, editor. Dordrecht, The Netherlands: Reidel; 1986. pp. 149–198. [Google Scholar]
- 24.Narasimhan L R, Littau K A, Pack D W, Bai Y S, Elschner A, Fayer M D. Chem Rev. 1990;90:439–457. [Google Scholar]
- 25.Breinl W, Friedrich J, Haarer D. J Chem Phys. 1984;81:3915–3921. [Google Scholar]
- 26.Köhler W, Zollfrank J, Friedrich J. Phys Rev B. 1989;39:5414–5423. doi: 10.1103/physrevb.39.5414. [DOI] [PubMed] [Google Scholar]
- 27.Köhler W, Friedrich J. Europhys Lett. 1988;7:517–522. [Google Scholar]
- 28.Abraham R J, Hawkes G E, Smith K M. Tetrahedron Lett. 1974;16:1483–1486. [Google Scholar]
- 29.Völker S, van der Waals J H. Mol Phys. 1976;32:151–157. [Google Scholar]
- 30.Black J L, Halperin B I. Phys Rev B. 1977;16:2879–2895. [Google Scholar]
- 31.Bai Y S, Fayer M D. Phys Rev B. 1989;39:11066–11084. doi: 10.1103/physrevb.39.11066. [DOI] [PubMed] [Google Scholar]
- 32.Suárez A, Silbey R. Chem Phys Lett. 1994;218:445–453. [Google Scholar]
- 33.Kikas J, Skinner J L. Chem Phys Lett. 1994;230:429–436. [Google Scholar]
- 34.Reilly P D, Skinner J L. J Chem Phys. 1994;101:965–973. [Google Scholar]
- 35.Fritsch K, Friedrich J, Kharlamov B M. J Chem Phys. 1996;105:1798–1806. [Google Scholar]
- 36.Maier H, Kharlamov B M, Haarer D. Phys Rev Lett. 1996;76:2085–2088. doi: 10.1103/PhysRevLett.76.2085. [DOI] [PubMed] [Google Scholar]
- 37.Klein M W. Phys Rev Lett. 1990;65:3017–3020. doi: 10.1103/PhysRevLett.65.3017. [DOI] [PubMed] [Google Scholar]
- 38.Burin A L, Kagan Y. JETP Lett. 1994;79:347–354. [Google Scholar]
- 39.Burin A L, Kagan Y. JETP Lett. 1995;80:761–768. [Google Scholar]
- 40.Frauenfelder H. Nat Struct Biol. 1995;2:821–823. doi: 10.1038/nsb1095-821. [DOI] [PubMed] [Google Scholar]


