

Abstract
The neural circuitry supporting mature visual spatial working memory (VSWM) has been well delineated in nonhuman primates and in human adults. However, we still have limited understanding about developmental change through adolescence in this network. We present results from a fast event-related functional MRI (fMRI) study aimed at characterizing developmental changes in brain mechanisms supporting VSWM across different delay periods. Forty-three healthy subjects (17 adults, 18–30 yr; 13 adolescents, 13–17 yr; 13 children, 8–12 yr) were scanned as they performed an oculomotor delayed response (ODR) task with short (2.5 s) and long (10 s) delay period trials. Results showed that all age groups recruited a common network of regions to support both delay trials, including frontal, parietal, and temporal regions, indicative of a core circuitry needed to perform the task. Several age-related differences were found in the recruitment of regions, supporting short delay trials, including fronto-caudal areas, which could contribute to known differences in initial memory-guided saccade precision. To support extended delay trials, adults primarily recruited additional posterior parietal cortex (PPC), whereas children and adolescents recruited a considerably more extensive distributed circuitry. Our findings indicate that brain processes supporting basic aspects of working memory across cortex are established by childhood. We also find evidence for continued immaturities in systems supporting working memory precision, reflected by differences in the circuitry recruited by children and by continued refinement of fronto-insular-temporal regions recruited by adolescents. Taken together, these results suggest distinct developmental changes in the circuitry supporting visual spatial working memory.
INTRODUCTION
The circuitry supporting mature working memory has been well delineated in nonhuman primates and human adults and includes distributed frontal, parietal, and striatal regions (Funahashi et al. 1989; Sweeney et al. 1996). However, less is known about the processes leading to maturity of this network. Working memory is evident in infancy (Diamond and Goldman-Rakic 1989) but shows continued improvements into adolescence (Brocki and Bohlin 2004; DeLuca et al. 2003; Demetriou et al. 2002; Gathercole et al. 2004; Luna et al. 2004; Swanson 1999; Zald and Iacono 1998), suggesting continued refinements in the underlying circuitry (Nagy et al. 2004; Olesen et al. 2003). Several lines of evidence support increased sophistication of working memory function through adolescence. Our initial behavioral studies using the oculomotor delayed response (ODR) task (Hikosaka and Wurtz 1983) showed that, although basic aspects of working memory appear mature by adolescence, the precision of corrective responses (Weber and Daroff 1972), thought to reflect the fidelity of the maintained spatial information, continues into the second decade of life (Luna et al. 2004). Functional neuroimaging studies have found that children performing simple working memory tasks (e.g., N-back tasks with 1 intervening distracter) recruit similar fronto-parietal circuitry as adults (Casey et al. 1995; Nelson et al. 2000; Thomas et al. 1999), yet fail to do so when performing more complex tasks (Ciesielski et al. 2006; Schweinsburg et al. 2005). Our results using a blocked design ODR task indicated age-related changes in BOLD signal magnitude in task-necessary regions (e.g., posterior parietal cortex), as well as the additional recruitment of presumed performance-enhancing regions [e.g., left dorsolateral prefrontal cortex (DLPFC)] (Scherf et al. 2006). Age-related magnitude differences in prefrontal and parietal cortex have been found to correspond to improved working memory performance, indicating specific changes in brain function supporting improvements in behavior (Crone et al. 2006; Klingberg et al. 2002; Olesen et al. 2007; Scherf et al. 2006). The fact that demanding tasks tax the immature brain suggests that some aspects of working memory mature early, whereas others have protracted maturation. Currently, the specific aspects of working memory with protracted development are not well understood. Working memory tasks involve multiple components, including encoding, maintenance, manipulation (when required), and response execution. We previously found that adults dynamically recruit areas such as left DLPFC (BA 10, 46) to support temporally extended delays, indicating that this region may support improved maintenance and fidelity of stored information (Geier et al. 2007).
Given that maintenance is central to working memory, we sought to specifically characterize developmental changes in this component. Toward this end, we characterized the circuitry supporting different delay lengths in an ODR task. We aimed to identify common regions central to spatial working memory and elucidate their functional role, as well as characterize differences in the circuitry supporting more demanding long delay trials. We hypothesized that, although a basic circuitry supporting spatial working memory performance would not show age-related differences, regions that support precision and the ability to have extended maintenance would show age-related differences in terms of both regions recruited or magnitude differences.
METHODS
Subjects
Forty-six healthy subjects (13 children, 15 adolescents, and 18 adults) were initially recruited for this study. Imaging data from two adolescents and one adult were excluded from analyses because of excessive (>1/2 voxel) head motion in the scanner. For the remaining subjects, there were no differences in head motion across age groups. The remaining 43 subjects [13 children (8–12 yr old; 6 females), 13 adolescents (13–17 yr old; 6 females), and 17 adults (18–30 yr old; 9 females)] had far visual acuity of ≥20/40 (corrected or uncorrected) and medical histories that showed no neurological disease, brain injury, or major psychiatric illness in the subject or first-degree relative. Age groups were selected to represent different developmental stages of childhood and adolescence, because our previous work indicated that the ability to generate an initial memory-guided saccade is still improving before age 14, whereas adult level performance, characterized by the accuracy of corrected saccades, improves until age 19 (Luna et al. 2004). Participants and/or their legal guardians provided informed consent before participating in this study. Experimental procedures for this study complied with the Code of Ethics of the World Medical Association (1964; Declaration of Helsinki) and the Institutional Review Board at the University of Pittsburgh. Subjects were paid for their participation in the study. The data from a subset of the adult subjects has been published elsewhere (Geier et al. 2007).
ODR task
Our task consisted of ODR (a.k.a. memory-guided saccade) trials and visually guided saccade trials (Fig. 1) adapted to a fast, event-related design (methods are also described in Geier et al. 2007). On ODR trials (Fig. 1A), subjects were instructed to fixate a yellow cross subtending ∼0.5° of visual angle for 2,425 ms. A target stimulus (filled yellow circle) was briefly presented (75 ms) in the periphery at ±4 or ±8° of visual angle. The location of the stimulus on each trial was randomly chosen and counterbalanced across visual hemifields. Subjects were instructed to maintain fixation during stimulus presentation and subsequent delay period, but to remember the location of the target stimulus in space. A variable delay period of either 2.5 (short delay) or 10 s (long delay) ensued. Equal numbers of short and long delay trials (10 each) were presented randomly during each scanning run. Immediately following the delay period, the central fixation cross disappeared, cueing the subjects to move their eyes toward the remembered location of the peripheral stimulus. For VGS trials (Fig. 1B), a green central fixation cued the subjects to simply look at the peripheral stimulus when it appeared. Ten visually guided saccade VGS and 20 ODR (10 of each delay type) trials were pseudorandomly presented during each run. VGS trials were examined to assure that expected oculomotor regions were engaged during the task and were coded separately in our regression model, but were not involved in further statistical analysis for the purposes of this study. Intertrial fixation periods (Fig. 1C) were jittered between 5, 7.5, 10, and 12.5 s, with the duration of each fixation chosen based on a decaying exponential function (Dale 1999; Dale and Buckner 1997). Two runs of the ODR task were presented per scanning session.
FIG. 1.

A depiction of the oculomotor delayed response (ODR) task. A: a gray fixation cross indicated a spatial working memory trial. The dashed border around the delay slide indicates that subjects encountered either a 2.5 or a 10 s delay (see methods), but this border was not present in the experiment. The white arrows indicate the appropriate eye movement response but also were not present in the experiment. B: a dark gray fixation indicated a visually guided saccade (VGS) trial. C: a white cross indicated an inter-stimulus period. Spatial working memory and VGS trials were pseudo-randomly presented together during each run (see methods). VGS trials were inter-mixed with working memory trials during each run and included as a separate regressor in our deconvolution model but were not further analyzed.
Eye tracking
Subjects were first tested in our behavioral laboratory within 1 wk before being scanned to assure they understood and were able to perform the task. In the MR scanning environment, eye movements were obtained with a long-range optics eye tracking system (Model 504LRO, Applied Science Laboratories, Bedford, MA) that recorded eye position by pupil-corneal reflection obtained by a mirror mounted on the head coil. Simultaneous video monitoring of eye movements was also used to assure task compliance. At the beginning of each eye tracking session and when necessary, a nine-point calibration procedure was performed. Stimuli were presented using E-Prime (Psychology Software Tools, Pittsburgh, PA), rear-projected onto a flat screen positioned on a standard radiofrequency (RF) head coil. All eye data were scored off-line using a combination of ILAB software (Gitelman 2002) and in-house scoring programs written in MATLAB (Math Works). Early technical limitations restricted the quality of the eye tracking in the scanner, resulting in scored eye data for seven adults, three adolescents, and five children; all subjects showed high compliance with the task reflective of our behavioral data.
Functional MRI acquisition and preprocessing
Imaging data were collected using a 3.0-T Signa whole body MR scanner (General Electric Medical Systems, Milwaukee, WI). A gradient-echo echo-planar imaging sequence sensitive to BOLD contrast (T2*) was used (Kwong et al. 1992; Ogawa et al. 1992). The acquisition parameters were as follows: TR = 2.5 s; TE = 25 ms; flip angle = 90°; single shot; full k-space; 64 × 64 acquisition matrix with FOV = 20 × 20 cm. Twenty-three 5-mm-thick axial slices with a 1-mm gap were collected, aligned to the base of the genu and splenium of the corpus callosum, generating 3.125 × 3.125 × 5-mm voxels, which covered the entire cortex and most of the cerebellum. A three-dimensional volume spoiled gradient-echo (SPGR) pulse sequence with 124 slices (1.5-mm slice thickness) was used to acquire the structural images in the axial plane.
Functional images were preprocessed using FMR/B software library (Smith SM et al. 2004). Two-dimensional images were first reconstructed into four dimensions (three dimensions plus time). Images were corrected for rotational and translational head motion by aligning each volume in the time series to the volume obtained in the middle of the acquisition. Structural images (SPGR) were affine registered to functional images using the FLIRT utility available in FSL (Jenkinson and Smith 2001). Slice timing correction was performed to adjust for interleaved slice acquisition. Functional images were registered to the Montreal Neurological Institute (MNI) template. Brain extraction was performed using the brain extraction tool (BET) in FSL (Smith 2002). Images were resampled into 3-mm isotropic voxels, spatially smoothed with an 8-mm full-width at half maximum (FWHM) kernel, and subjected to high-pass temporal filtering (0.027 Hz; sigma = 37.5 s) to remove low-frequency scanner drift. Finally, functional images for each run were scaled to a mean signal intensity of 100 and concatenated across runs.
AFNI (analysis of functional neuro-images) (Cox 1996) was used for deconvolution and subsequent group statistical analyses. Deconvolution methods followed steps delineated in Ward (1998). Briefly, our deconvolution (regression) model consisted of three orthogonal regressors of interest (short and long delay ODR trials and VGS trials), regressors modeling baseline, linear, and nonlinear trends, as well as six motion parameters as nuisance regressors. Sine basis functions were used to estimate the hemodynamic response to the various stimuli of interest (Johnstone et al. 2007). The estimated impulse response function (i.e., hemodynamic response function) for each regressor of interest was determined by a weighted linear sum of five sine basis functions (each of different frequency) multiplied by the least squares estimated beta weight. In this manner, we specified the duration of the response (35 s) for each trial but did not make assumptions about its specific shape beyond using zero as the start point. The estimated time course values from ODR trials encompassed the entire trial; that is, presentation of the peripheral stimulus, delay period, and the motor response. Several goodness-of-fit statistics were calculated from the deconvolution, including partial F-statistics for each regressor and T scores comparing each of the 15 estimated time course values to zero. Jittered intertrial fixation periods ensured that there were a sufficient number of independent linear equations to separately estimate the time series for each trial type. Three-dimensional surface images were generated by mapping functional data onto the human PALS atlas using Caret software (version 5) (Van Essen 2002; Van Essen et al. 2001).
Group statistical analyses
Our first aim was to characterize similarities and differences in task-necessary or core regions across age groups. Second, we aimed to characterize differences in regions recruited to support temporally extended VSWM within and between each age group. Toward these ends, we conducted the analyses described below.
CORE TASK–RELATED REGIONS.
Subjects did not know at the start of each trial whether they would encounter a short or a long delay; therefore, activity associated with stimulus encoding and early maintenance processing (≤2.5 s) was equivalent across trial types. Furthermore, the motor response required in each trial was the same (i.e., generate a memory-guided saccade to the remembered location). We thus considered activity related to short delay trials as reflecting the core spatial working memory network, contributing to encoding, early maintenance, and the saccadic response (Geier et al. 2007). Additional activity in the longer delay trials reflected processes related to extended delay period activity of which maintenance is a primary contributor given that this is the main difference between short and long delay trials.
To quantitatively characterize similarities in core task–related regions recruited across the age groups, we ran mixed-effects ANOVA using the short delay trial estimated time course values from all subjects, with time (0–15) and age group as fixed factors and subjects (n = 43) as the random factor. Next, we extracted time courses for each age group from significantly active clusters identified in the overall main effect of time map (Velanova et al. 2008; Wheeler et al. 2008). First, the uncorrected main effect of time map was spatially smoothed with a 4-mm FWHM kernel. Peak voxels that exceeded a threshold of P < 0.01 (uncorrected) were identified and sorted by magnitude of the F-statistic, and a 9-mm-diam sphere was placed around the maximum. Less significant peaks that fell within spheres centered on larger maximum were removed. We corrected the original main effect of time image for multiple comparisons using criteria from a Monte Carlo simulation (see Supplementary Table 1 for parameters).1 Functional regions of interest (ROIs) were defined by including all the voxels that fell within the 9-mm sphere of a maximum on the uncorrected image and excluding those voxels that did not appear in the multiple comparisons corrected image. Finally, we used the functionally defined ROIs as masks and extracted the average time courses (short delay trials only) from each subject. This procedure allowed us to directly compare the magnitude and shape of the estimated time course for short delay trials from the same voxels across all subjects. Extracted time courses for each subject were analyzed with repeated-measures ANOVA. Statistical analyses of time courses allowed us to identify specific regions where there were significant differences, beyond subject interpretation based on visual inspection of the time courses. Clusters with time courses that had significant main effects of time for each age group, but no significant main effect of age group (P < 0.05) or age group by time interaction (P < 0.05), were characterized as commonly recruited core task–related circuitry.
We also used the identified short delay clusters as masks and extracted from their constituent voxels the time courses from short and long delay trials. By comparing the time course patterns from the same voxels across different delays in this ODR paradigm, we gain additional insight on the functional role contributed by each common region (Geier et al. 2007). In this study, we focused on a priori patterns previously identified in adults (Geier et al. 2007) and examined whether similar patterns were evident in younger subjects. Regions involved in maintaining a representation across a delay would be expected to have a time course with a single peak during short trials and a similar magnitude, but temporally extended response for long delay trials (Boynton et al. 1996). More inclusively, clusters with biphasic long delay time course responses that do not return to baseline between peaks could also be considered maintenance related given that persistent activity across a delay period likely reflects maintenance (Curtis et al. 2004). Regions participating in response preparation and/or covert shifts of attention would be expected to show a single peak in short trials and similarly sized double peaks in long delay trials, with a return to or very near baseline between peaks. This double peak shift during long delay trials may represent a false start after 2.5 s on long delay trials for response preparation-related areas (Geier et al. 2007) and/or a transient shift of attention (Awh and Jonides 2001; Egeth and Yantis 1997). Finally, regions related to either a later stage of response preparation occurring close to the motor response or perhaps in feedback processing after a saccade would be expected to show a single peak in both short and long delay trials. Alternatively, these types of responses could also reflect processing related to the shift in visual input that occurs immediately following a saccade. Adult short delay time courses were used to categorize regions, allowing us to further assess which areas may not be fully mature in adolescents and children.
As an additional level of analysis to identify core task regions active within each age group, we ran a mixed-effects ANOVA using the estimated time course values from short delay trials, with time as a fixed factor and subjects (n = 13 for children, n = 13 for adolescents, n = 17 for adults) as a random factor. This produced three main effects of time statistical maps (one each for children, adolescents, and adults). For each map, as noted above, alpha probability simulations were run to determine the appropriate cluster size to use with a voxel threshold of P = 0.01 to achieve a corrected alpha level of 0.05 (Supplementary Table 1).
Differences in core task–related regions recruited across the age groups were examined using an age group by time interaction map generated from the mixed-effects ANOVA run on the short delay trial estimated time course values from all subjects, with time (0–15) and age group as fixed factors and subjects (n = 43) as the random factor. Functional ROIs were generated using the interaction map as the base image, and differences in extracted time courses were characterized using repeated-measures ANOVA.
EXTENDED DELAY–RELATED REGIONS.
To examine differences in the circuitry recruited to support longer relative to shorter delay trials within each age group, we ran a mixed-effects ANOVA using the estimated time course values from all subjects and both delay trial types, with time (15 time points), delay trial type (2: short and long), and age group (3: children, adolescents, and adults) as fixed factors and subjects as the random factor. Our primary interest here were planned contrast maps showing voxels that were more active in long compared with short delay trials (P < 0.01) within each age group. In addition, we also examined the age group by time by delay type interaction map. Specifically, we compared this interaction image with the main effect of time for short delay trials (all subjects included) to determine which, if any, areas come on-line and differ across age or time during the longer delays. Such an area presumably would be recruited to assist in the additional demands (i.e., maintenance) of the longer delay trials.
As a means to quantify differences in regions supporting temporally extended VSWM trials across age groups, we generated an age group by time interaction map from an omnibus three-way mixed-effects ANOVA (time and age group as fixed factors, subjects as the random factor), using the long delay trial estimated time course values. We examined the estimated time courses using repeated-measures ANOVA in SPSS extracted from identified clusters.
Finally, separate age group main effect of time images for long delay trials were also generated for qualitative comparison with short delay trial activations.
RESULTS
Eye tracking
In the scanner, video monitoring of subjects' eyes during testing provided on-line visual evidence of task compliance. Overall percent correct rates were expectedly high for each age group [adults (n = 7), mean = 99.1 ± 1.4%; adolescents (n = 3), mean = 96.8 ± 3.83%; children (n = 7), mean = 82.4 ± 5.39], which is in line with our previous behavioral results (Luna et al. 2004). Across all age groups, errors consisted of incorrectly breaking fixation and looking toward the direction of the cue before the end of the delay period. For children, errors also included failing to respond when fixation was extinguished, occurring on a single trial in two subjects.
fMRI
CORE TASK–RELATED REGIONS: SIMILARITIES.
A distributed circuitry comprised of canonical oculomotor and VSWM-related regions was recruited to support short delay trials (Fig. 2). Direct comparison of time course activation profiles from clusters identified in a mixed-effects ANOVA main effect of time map showed similarities across the age groups in multiple regions, including putative frontal eye field (FEF; we delineate this functionally defined region as in Luna et al. 2001 and Paus 1996), superior frontal gyrus, cingulate, inferior and superior parietal lobule, precuneus, and insula (Fig. 3; Table 1). Corroborating this evidence, separate main effect of time maps for each age group also indicated that a qualitatively similar distributed network was recruited to support short delay trial performance, including multiple clusters in putative FEFs, supplementary eye field (SEF) (as delinated in Luna et al. 2001), superior parietal lobule, intraparietal sulcus (IPS), and precuneus (Fig. 4A; also see Supplementary Fig. 1).
FIG. 2.
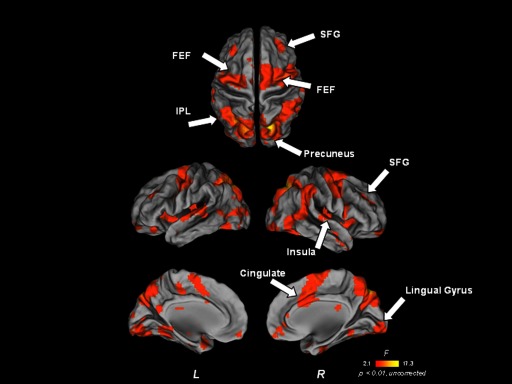
Omnibus main effect of time map–short delay trials only. Functional image is overlaid on partially inflated human PALS atlas cortical surfaces using Caret software. IPL, inferior parietal lobule; FEF, frontal eye field; SFG, superior frontal gyrus.
FIG. 3.

Mean BOLD time courses from representative core regions commonly recruited across age groups during short delay trials. Error bars represent SE at each time point. For illustrative purposes, a 4-mm sphere centered on each peak coordinate is shown. Talairach coordinates of peak voxel from each cluster are also provided. For time courses: adults, solid line; adolescents, dash-dot; children, dotted line. FEF, frontal eye field; SFG, superior frontal gyrus; SPL, superior parietal lobule.
TABLE 1.
Commonly recruited core regions
| Talairach Coordinates |
Region | BA | Peak F | ||
|---|---|---|---|---|---|
| x | y | z | |||
| Frontal | |||||
| 42 | −3 | 48 | Right precentral gyrus (FEF)* | 6 | 9.583993 |
| 33 | −6 | 60 | Right superior precentral gyrus (FEF)* | 6 | 7.839912 |
| 27 | −9 | 48 | Right precentral gyrus (FEF)* | 6 | 7.556803 |
| 45 | 0 | 39 | Right inferior precentral gyrus (VLPFC)* | 6,44 | 8.3306 |
| 36 | 45 | 33 | Right superior frontal gyrus | 9 | 4.799655 |
| 9 | 12 | 42 | Right cingulate† | 32 | 8.133585 |
| −39 | −9 | 48 | Left precentral gyrus (FEF) | 6 | 7.762268 |
| −24 | −6 | 57 | Left precentral gyrus (FEF)† | 6 | 7.185485 |
| Parietal | |||||
| 15 | −75 | 48 | Right precuneus† | 7 | 17.307175 |
| 36 | −45 | 36 | Right inferior parietal lobule† | 40 | 10.603397 |
| 57 | −45 | 24 | Right supramarginal gyrus† | 40 | 4.408795 |
| −27 | −63 | 48 | Left superior parietal lobule† | 7 | 12.147823 |
| −18 | −72 | 57 | Left superior parietal lobule† | 7 | 11.355011 |
| −15 | −78 | 42 | Left precuneus† | 7,19 | 11.700447 |
| Occipital | |||||
| 27 | −66 | 27 | Right superior occipital gyrus* | 7 | 8.132529 |
| 15 | −90 | −9 | Right lingual gyrus‡ | 17,18 | 6.431231 |
| −30 | −78 | 12 | Left middle occipital gyrus* | 19 | 7.475461 |
| Insular | |||||
| 36 | 18 | 6 | Right insula† | 13 | 5.396509 |
| −33 | 15 | 9 | Left insula† | 13 | 5.069032 |
All P < 0.01.
Pattern 1: response preparation related.
Pattern 2: Maintenance related.
Pattern 3: Visual response related. FEF, frontal eye field; VLPFC, ventrolateral prefrontal cortex.
FIG. 4.
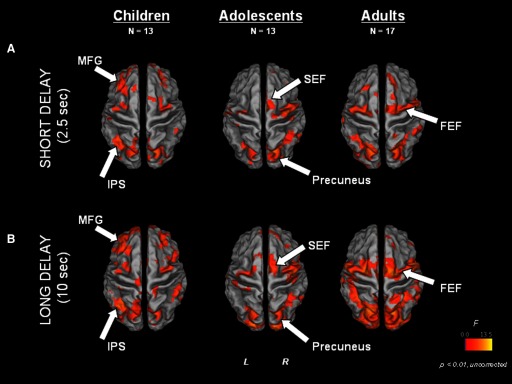
Main effect of time statistical maps for each age group and each delay trial type [A = short delay (2.5 s), B = long delay (10 s)], overlaid on partially inflated human PALS atlas cortical surface using Caret software. Dorsal view is shown. FEF, frontal eye field; IPS, intraparietal sulcus; MFG, middle frontal gyrus; SEF, supplementary eye field.
CORE TASK–RELATED REGIONS: PATTERN ANALYSIS.
Common core clusters (i.e., short delay clusters with similar time course activation profiles) were used as functional masks from which time courses from short and long delay trials were extracted and quantitatively compared, allowing the functional role of these regions to be probed. Several of the regions identified as core areas were also found to exhibit time course similarities for long delay periods across the age groups. We note that, although the core regions did not show any significant interactions (age group by delay or age group by delay by time), the time courses from children and adolescents in a number of regions (e.g., right FEF; Fig. 5) did show differences. These differences were primarily in terms of the peak magnitude—adolescents showed the highest short delay peak, whereas children consistently showed the lowest. In previous work, we identified three distinct time course patterns in adults (Geier et al. 2007). Here,we show that similar patterns are present across different age groups as well. Figure 5 shows time courses from representative regions demonstrating each pattern. For completeness, time courses from additional regions showing each pattern are provided as Supplementary Figs. 3 and 4.
FIG. 5.

Mean BOLD time courses from representative core regions showing 3 observed patterns similarly across all age groups. Error bars represent SE at each time point. The y-axes for individual time course plots are scaled for best view. For each age group: long delay responses, dotted line; short delay responses, solid line. FEF, frontal eye field; SFG, superior frontal gyrus.
PATTERN 1: RESPONSE PREPARATION OR ATTENTION SHIFT RELATED.
Pattern 1 time courses were characterized by having a single peaked hemodynamic response in short delay trials (∼7.5 s into the trial) and a biphasic response in long delay trials with a return to baseline between peaks. This pattern was observed in multiple regions in the right FEF (Talairach coordinates: 42, −3, 48; 33, −6, 60; 27, −9, 48), as well as right superior occipital gyrus (27, −66, 27), left middle occipital gyrus (−30, −78, 12), and right inferior precentral gyrus [ventrolateral prefrontal cortex (VLPFC); 45, 0, 39].
Pattern 2: maintenance related
Pattern 2 time courses were characterized by 1) similarities in the rise and time of initial peak for both short and long delay responses and 2) a long delay response that was temporally extended relative to the short. Time courses that showed a biphasic response that did not return to baseline between peaks were included in this pattern and also considered to come from maintenance-related brain areas. These patterns were observed in bilateral precuneus (right: 15, −75, 48; left: −15, −78, 42), left superior parietal lobule (−18, −72, 57; −27, −63, 48), right inferior parietal lobule (36, −45, 36), left FEF (−24, −6, 57), right cingulate gyrus (9, 12, 42), right supramarginal gyrus (57, −45, 24), bilateral insula (right: 36, 18, 6; left: −33, 15, 9), and the right superior frontal gyrus (36, 45, 33).
PATTERN 3: VISUAL RESPONSE RELATED.
A third type of response was also observed in which a single peak was observed for both short and long delay responses. The short peak occurred later (∼10 s into the trial) than the short peak in pattern 1 time courses. Across the three age groups, this response type was observed in a single region, located in the right lingual gyrus (15, −90, −9).
CORE TASK–RELATED REGIONS: DIFFERENCES.
Table 2 lists regions showing significant age group by time interactions during short delay trials (Fig. 6A), indicative of age group differences in the functional activation of core task-related circuitry over time.
TABLE 2.
Differentially recruited core regions
| Talairach Coordinates |
Region | BA | Peak F | P (Uncorrected) | Contrasts* | ||
|---|---|---|---|---|---|---|---|
| x | y | z | |||||
| Frontal | |||||||
| 18 | 30 | 42 | Right superior frontal gyrus | 8,6 | 2.568896 | 0.01 | A = T>C |
| 27 | 12 | 36 | Right middle frontal gyrus | 8 | 2.330479 | 0.01 | A = T>C |
| 51 | 18 | −3 | Right inferior frontal gyrus | 47 | 2.096121 | 0.005 | A = T>C |
| −3 | 54 | −9 | Left medial frontal gyrus | 10,11 | 2.265154 | 0.01 | T>A>C |
| −9 | 60 | 0 | Left medial frontal gyrus | 10 | 2.170119 | 0.01 | T>A>C |
| Temporal | |||||||
| 39 | −66 | 15 | Right middle temporal gyrus | 37 | 2.812112 | 0.001 | T>A>C |
| 51 | −30 | −6 | Right middle temporal gyrus | 21 | 2.111621 | 0.01 | T>A>C |
| Insular | |||||||
| 42 | −9 | −6 | Right insula | 13 | 3.020082 | 0.01 | T>A = C |
| Subcortical | |||||||
| 15 | 18 | 9 | Right caudate | * | 2.207764 | 0.005 | A=T>C |
Contrasts based on Tukey's HSD, significance level set at α = 0.05. A, adults; T, adolescents; C, children.
FIG. 6.
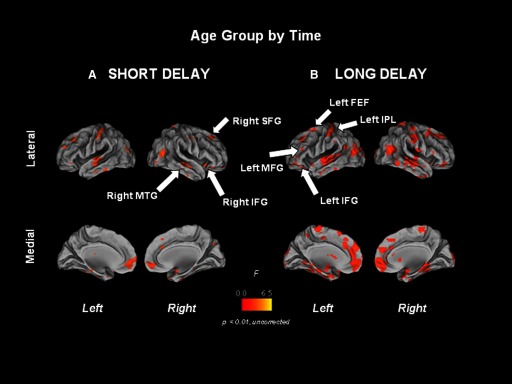
Short (A) and long (B) delay age group by time interaction statistical maps overlaid on partially inflated human PALS atlas cortical surfaces using Caret software. Medial and lateral cortical surfaces are shown for both hemispheres. FEF, frontal eye field; IFG, inferior frontal gyrus; MFG, middle frontal gyrus; SFG, superior frontal gyrus.
Examination of the mean time courses from the regions listed in Table 2 showed several recurrent patterns (Fig. 7). First, the adolescent group showed heightened activation relative to children and adults in a fronto-insular-temporal network (right insula, inferior/medial frontal cortex, and middle temporal cortex; e.g., right IFG and MTG; Fig. 7). Second, children showed negative-going time courses in all regions observed. Finally, in all regions except the inferior frontal gyrus (BA 47) and superior frontal gyrus (BA 8, 6), the adult group showed weak or negative-going responses.
FIG. 7.

Mean BOLD time courses from regions showing age group by time interactions in short delay trials. Error bars represent SE at each time point. Adults, solid line; adolescents, dash-dot; children, dotted line. For illustrative purposes, a 4-mm sphere was centered on each peak coordinate except for the right caudate, where a 5-mm sphere was used to enable visualization on surface map. Talairach coordinates of peak voxel from each cluster are also provided. IFG, inferior frontal gyrus; MTG, middle temporal gyrus; SFG, superior frontal gyrus.
Extended delay–related regions
WITHIN-AGE GROUP DIFFERENCES.
Each age group recruited a circuitry to support long delay trial performance that was qualitatively similar to the circuitry for short delay trials (Fig. 4B). However, in a contrast of short and long delay trial activity within each age group (Fig. 8), adults showed significantly (P < 0.01, uncorrected) more long delay trial activity in four areas: bilateral inferior parietal lobule (right: 51, −45, 51; left: −51, −51, 48), right inferior frontal gyrus (IFG, BA 9; 51, 15, 21), and a small region in left IFG (BA 10, 46; −46, 54, 0).
FIG. 8.
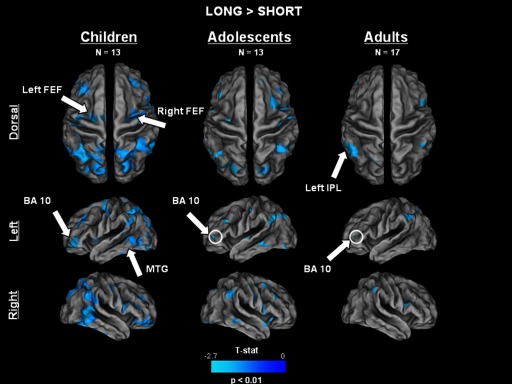
Contrast map showing regions that were significantly (P < 0.01) more active during long compared with short delay trials. Adolescents and children recruited considerably more widespread regions than adults to assist in long delay trials. FEF, frontal eye field; DLPFC, dorsolateral prefrontal cortex; IPL, inferior parietal lobule; MTG, middle temporal gyrus.
In contrast to adults, adolescents and children each recruited considerably more widespread regions to assist in long delay trials. Notably, adolescents recruited bilateral middle frontal gyrus, supramarginal gyrus, fusiform, inferior and superior parietal lobules, precuneus, and middle frontal gyrus (BA 9), among others (Table 3). Children showed the most extensive recruitment of regions to support the demands of the longer delay period, with significantly active regions in bilateral FEF, inferior, middle, and superior frontal gyri, supramarginal gyrus, inferior and superior parietal lobules, precuneus, insula, and middle temporal gyrus, among others (Table 3).
TABLE 3.
Long > short delay contrasts
| Age Group | Talairach Coordinates |
Region | BA | T Value | ||
|---|---|---|---|---|---|---|
| x | y | z | ||||
| Adults | ||||||
| Frontal | ||||||
| 51 | 15 | 21 | Right Inferior Frontal Gyrus | 9, 45 | −3.781 | |
| −46 | 54 | 0 | Left inferior frontal gyrus | 10, 46 | −2.855 | |
| Parietal | ||||||
| 51 | −45 | 51 | Right inferior parietal lobule | 40 | −3.361 | |
| −51 | −51 | 48 | Left inferior parietal lobule | 40 | −3.768 | |
| Adolescents | ||||||
| Frontal | ||||||
| 36 | 18 | 57 | Right middle frontal gyrus | 6, 8 | −4.23724 | |
| 45 | 33 | 33 | Right middle frontal gyrus | 9 | −3.259147 | |
| 9 | 12 | 45 | Right medial frontal gyrus | 32 | −3.579746 | |
| 30 | 27 | −9 | Right inferior frontal Gyrus | 47 | −3.195389 | |
| 39 | 3 | 33 | Right Inferior frontal gyrus (VLPFC) | 44, 6 | −3.17793 | |
| 54 | −3 | 27 | Right precentral gyrus | 6 | −3.340235 | |
| 51 | 6 | 27 | Right Inferior frontal gyrus (VLPFC) | 9, 44 | −3.292772 | |
| −33 | −15 | 48 | Left precentral gyrus (FEF) | 6 | −4.052175 | |
| −42 | 30 | 36 | Left middle frontal gyrus | 9 | −3.169266 | |
| −40 | 47 | 1 | Left inferior frontal gyrus | 10 | −2.89517 | |
| Parietal | ||||||
| 51 | −42 | 39 | Right inferior parietal lobule | 40 | −4.237628 | |
| 27 | −72 | 51 | Right precuneus | 7 | −2.980708 | |
| 12 | −78 | 42 | Right precuneus | 7 | −3.500082 | |
| 12 | −78 | 42 | Right precuneus | 7 | −3.500082 | |
| −42 | −57 | 42 | Left inferior parietal lobule | 40 | −3.522972 | |
| −12 | −75 | 36 | Left precuneus | 7 | −3.198881 | |
| −27 | −81 | 42 | Left precuneus | 7 | −3.702606 | |
| −63 | −51 | 24 | Left supramarginal gyrus | 40 | −3.523619 | |
| −51 | −54 | 33 | Left supramarginal gyrus | 40 | −3.382912 | |
| Temporal | ||||||
| 54 | 15 | −15 | Right medial temporal pole | 38 | −3.212978 | |
| 60 | −42 | −12 | Right inferior temporal gyrus | 20 | −3.086238 | |
| −66 | −42 | −12 | Left middle temporal gyrus | 21, 22 | −3.800118 | |
| −45 | −30 | −27 | Left fusiform | 20 | −3.675577 | |
| Occipital | ||||||
| 18 | −90 | −15 | Right fusiform gyrus | 18 | −4.211634 | |
| 30 | −84 | −15 | Right fusiform gyrus | 18 | −4.026827 | |
| −45 | −75 | −15 | Left fusiform | 19 | −3.139779 | |
| 0 | −87 | −15 | Left fusiform | 18 | −2.953291 | |
| Cerebellum | ||||||
| 45 | −54 | −36 | Right cerebellum | — | −2.975923 | |
| −36 | −57 | −36 | Left cerebellum | — | −3.396233 | |
| Children | ||||||
| Frontal | ||||||
| 21 | 51 | −18 | Right superior frontal gyrus | 11 | −4.389614 | |
| 30 | 60 | −18 | Right superior frontal gyrus | 11 | −3.734151 | |
| 30 | 42 | 30 | Right superior frontal gyrus | 9 | −3.694493 | |
| 39 | 51 | −6 | Right middle frontal gyrus | 10 | −3.685566 | |
| 42 | 33 | 3 | Right inferior frontal gyrus | 46, 45 | −4.777605 | |
| 48 | 39 | −18 | Right inferior frontal gyrus | 47 | −3.736039 | |
| 57 | 12 | 33 | Right inferior frontal gyrus (VLPFC) | 9, 44 | −3.694322 | |
| 42 | −9 | 42 | Right precentral gyrus (FEF) | 6 | −4.373305 | |
| −39 | −12 | 48 | Left precentral gyrus (FEF) | 6 | −3.670287 | |
| −15 | −9 | 63 | Left superior frontal gyrus | 6 | −4.575884 | |
| −39 | 48 | −3 | Left inferior frontal gyrus | 10 | −4.084029 | |
| −30 | 33 | 45 | Left middle frontal gyrus | 8 | −3.899304 | |
| −33 | 24 | 33 | Left middle frontal gyrus | 9 | −3.733121 | |
| −36 | 33 | 33 | Left middle frontal gyrus | 9 | −3.724365 | |
| −33 | 39 | 24 | Left middle frontal gyrus | 10 | −3.567452 | |
| Parietal | ||||||
| 27 | −51 | 39 | Right precuneus | 7 | −3.822221 | |
| 18 | −78 | 48 | Right precuneus | 7 | −4.165061 | |
| 39 | −45 | 45 | Right inferior parietal lobule | 40 | −3.779302 | |
| 60 | −57 | 33 | Right supramarginal gyrus | 40 | −4.31957 | |
| −45 | −57 | −54 | Left superior parietal lobule | 40,7 | −4.018792 | |
| −48 | −57 | 51 | Left superior parietal lobule | 40,7 | −3.99716 | |
| −27 | −69 | 51 | Left superior parietal lobule | 7 | −4.706358 | |
| −33 | −54 | 45 | Left inferior parietal lobule | 40 | −4.50069 | |
| −57 | −51 | 54 | Left inferior parietal lobule | 40 | −4.314076 | |
| −66 | −48 | 30 | Left supramarginal gyrus | 40 | −4.043684 | |
| −54 | −54 | 36 | Left supramarginal gyrus | 40 | −3.653291 | |
| Temporal | ||||||
| 54 | −51 | −6 | Right middle temporal gyrus | 37 | −5.501911 | |
| 63 | −63 | 6 | Right middle temporal gyrus | 37 | −3.849518 | |
| −66 | −42 | 6 | Left middle temporal gyrus | 22 | −3.831663 | |
| −45 | −54 | 0 | Left middle temporal gyrus | 37 | −4.168494 | |
| Occipital | ||||||
| 9 | −75 | 3 | Right lingual gyrus | 18 | −3.761104 | |
| 18 | −87 | −3 | Right lingual gyrus | 18 | −4.022568 | |
| 60 | −72 | 3 | Right middle occipital gyrus | 37 | −3.689686 | |
| −3 | −87 | 3 | Left lingual gyrus | 17, 18 | −4.549102 | |
| −15 | −81 | 30 | Left cuneus | 19 | −4.249011 | |
| −30 | −78 | 9 | Left middle occipital gyrus | 19 | −4.21622 | |
| Insular | ||||||
| 48 | 9 | 9 | Right insula | 44 | −4.163343 | |
| −42 | 12 | 3 | Left insula | 13 | −3.745996 | |
All P < 0.01. See Table 1 for abbreviations.
BETWEEN-AGE GROUP DIFFERENCES.
Significant age group by time interactions for long delay trials (Fig. 6B) were found in several regions throughout the brain (Table 4). In these areas, age-related differences evident in the time courses were largely because of children showing an early yet transient response, whereas adults, and to a lesser extent adolescents, showed a later response (peaking ∼20-s post-trial onset; Fig. 9).
TABLE 4.
Age group by time interactions for long delay trials
| Talairach Coordinates |
Region | BA | P Value | P (Uncorrected) | Contrasts* | ||
|---|---|---|---|---|---|---|---|
| x | y | z | |||||
| Frontal | |||||||
| 33 | 42 | −18 | Right superior frontal gyrus | 11 | 3.683531 | 0.01 | T>A |
| 15 | 36 | 42 | Right superior frontal gyrus | 8 | 2.990342 | 0.01 | T>A=C |
| 33 | 15 | 51 | Right superior frontal gyrus | 8, 6 | 2.43077 | 0.01 | T>A>C |
| −27 | 6 | 57 | Left middle frontal gyrus | 6 | 2.941265 | 0.01 | A=T=C |
| −6 | 30 | 33 | Left anterior cingulate | 32 | 2.336303 | 0.01 | T>A>C |
| −9 | 45 | 12 | Left anterior cingulate | 10, 32 | 2.290629 | 0.01 | A=T>C |
| −42 | 30 | 18 | Left middle frontal gyrus | 46 | 2.333182 | 0.005 | C>T>A |
| −27 | 33 | 45 | Left middle frontal gyrus | 8 | 4.647783 | 0.01 | A=T=C |
| −45 | 45 | 3 | Left inferior frontal gyrus | 10, 46 | 1.971907 | 0.005 | T>A=C |
| Parietal | |||||||
| −42 | −39 | 36 | Left inferior parietal lobule | 40 | 2.941974 | 0.001 | A=T>C |
| −36 | −48 | 39 | Left inferior parietal lobule | 40 | 2.269211 | 0.001 | A>C |
| Temporal | |||||||
| 42 | −66 | 15 | Right middle temporal gyrus | 39 | 3.643531 | 0.01 | T>A=C |
| Occipital | |||||||
| −42 | −84 | 30 | Left superior occipital gyrus | 19 | 3.254029 | 0.01 | T>C |
| 0 | −90 | 27 | Left cuneus | 19 | 2.709918 | 0.01 | A=T=C |
| Subcortical | |||||||
| 18 | 18 | 12 | Right caudate | * | 2.427366 | 0.01 | A=T>C |
Contrasts based on Tukey's HSD, significance level set at α = 0.05. A, adults; T, adolescents; C, children.
FIG. 9.

Mean BOLD time courses from regions showing age group by time interactions in long delay trials. Error bars represent SE at each time point. For illustrative purposes, a 4-mm sphere centered on each peak coordinate is shown. Talairach coordinates of peak voxel from each cluster are also provided. Adults, solid line; adolescents, dash-dot; children, dotted line. FEF, frontal eye field; IFG, inferior frontal gyrus; IPL, inferior parietal lobule; MFG, middle frontal gyrus.
AGE GROUP BY TIME BY DELAY COMPARISONS.
A small number of regions showed an age group by time by delay interaction as determined from the omnibus ANOVA (Supplementary Fig. 2). In the uncorrected image, three areas were observed that were distinct from the short delay trial main effect of time image (all subjects included), including bilateral cingulate gyrus and superior frontal gyrus, and an anterior-lateral portion of the right inferior parietal lobule (IPL; BA 40), near the supramarginal gyrus. Of these regions, only the cluster in the right IPL survived correction for multiple comparisons (corrected alpha level of 0.05).
DISCUSSION
The nature of age-related brain changes that underlie developmental improvements in working memory is currently not well understood. In this study, we identified similarities in the recruitment of a core or task-essential circuitry supporting working memory, as well as differences in how some regions are recruited with age. We also studied developmental differences in the mechanisms that support maintenance processes by comparing short and long delay trials.
Core task–related regions
In line with prior developmental imaging studies (Klingberg et al. 2002; Kwon et al. 2002; Luna et al. 2001; Nagy et al. 2004; Olesen et al. 2003; Scherf et al. 2006; Thomas et al. 1999), we found that all age groups similarly recruited a network of regions to support basic task performance, including superior frontal gyrus, superior and inferior parietal lobules, and cortical eye fields (FEF, SEF). Each of these areas has been associated with component processes critical for successful ODR task execution in adults. For example, the FEF has been shown to be involved in response preparation, response selection, and shifts in attention (Corbetta et al. 1998; Curtis 2006; LaBar et al. 1999; Luna et al. 1998), the SFG in aspects of maintenance and response selection (Postle et al. 2000), the superior and inferior parietal lobule in maintenance and shifts of attention (Brown et al. 2004; Schluppeck et al. 2005; Serences et al. 2004), and the precuneus and insula in early visual processing and covert shifts of spatial attention (Beauchamp et al. 2001; LaBar et al. 1999).
Time course analysis showed that the functional roles contributed by much of the core circuitry supporting working memory appear mature by childhood. These roles may include 1) response preparation and/or shifts of attention (e.g., right FEF, middle occipital gyrus), 2) maintenance (e.g., left superior parietal lobule, right superior frontal gyrus), and 3) visual-related response (e.g., left lingual gyrus). Evoked signal in lingual gyrus could reflect the apparent movement of objects in the visual field, expected to occur after subjects move their eyes (e.g., the relative location of the mirror). Alternatively, given that we observed pattern 3 in the left lingual gyrus across all age groups in this experiment, the lingual gyrus may be involved in spatial updating, or remapping, of the visual scene following the memory-guided saccade (Merriam et al. 2003, 2007). Visual remapping would occur immediately after the saccade and would be expected to have a time course very similar to those regions involved more directly with a motor response. In contrast, the lateral cerebellum, which showed a similar response shape but only in adults (Geier et al. 2007), may participate in processing related to the precision of corrective saccades following the initial memory-guided saccade. This is supported by evidence indicating that precision is a hallmark of mature, adult behavioral performance on this task (Luna et al. 2004) and that the cerebellum plays a role eye movement precision (Leigh and Zee 1999). Finally, we found that the majority of the regions identified as being common core areas were involved in shifts of attention and/or response preparation processes. This finding supports a model in which these processes in particular are crucial to spatial working memory function (Postle 2006) and further suggests that this is the case even in childhood.
However, we also found evidence for immaturities in regions supporting basic working memory processing. We define immaturity here as evoked brain responses that are significantly different from the mature, adult state. In our aim to characterize a developing system, that is, a change toward maturity, we use the adult data as a model of the mature system. Therefore any differences with the adult data, be it decreased or increased BOLD responses, are considered as immature. Previous developmental work, including our own (Luna et al. 2001; Rubia et al. 2006; Scherf et al. 2006; Tamm et al. 2002), has characterized both hypo- and hyper-responding relative to adults in different regions participating in executive function tasks, providing evidence for the varied nature of immature responses. Decreases in responses with age are interpreted as indicating that a specific circuitry is no longer needed with age, whereas age-related increases are interpreted as in immaturity in accessing a more appropriate region. Different responses across time were found in the superior and inferior frontal gyrus, as well as the middle temporal gyrus, insula, and caudate (Fig. 7; Table 2). The middle temporal gyrus has been implicated in allocentric stimulus encoding and may function to continually update internal maps of space relative to the external environment (Schmidt et al. 2007). The caudate, SFG, and IFG are components of a prefrontal-striato-thalamo-cortical loop (Alexander et al. 1986; Haber et al. 1995; Middleton and Strick 2002; Selemon and Goldman-Rakic 1985) that supports various functional roles in spatial working memory, including maintenance, flexibility, and reinforcement of rules, as well as stimulus encoding (Goldman-Rakic et al. 1992). The insula is known to contribute to shifts of visual attention as well as aspects of spatial working memory function (LaBar et al. 1999) and the basic cognitive control system (Dosenbach et al. 2006). The extracted time courses from each of the above regions in children had negative percent signal changes. Although the interpretation of negative time courses remains controversial (Gusnard and Raichle 2001; Harel et al. 2002; Smith AT et al. 2004), recent studies have associated negative-going BOLD responses with decreases in neuronal activity in nonhuman primates (Shmuel et al. 2006). One possible explanation for these results is that children may be less efficient in recruiting and using distributed regions (Luna and Sweeney 2004) and therefore may reduce activity in regions that mediate computations that are nonessential to performance of the task but may contribute to improved performance in the mature system. We use the term efficiency here broadly to reflect the speed and fidelity of information processing within localized brain regions and communication between distant regions, processes largely supported by synaptic pruning and myelination, respectively. We note that while we cannot directly measure lower processing efficiency in younger subjects in this study, we suggest that this may be the case based on a growing literature providing evidence of protracted structural maturation in these regions (Gogtay et al. 2004; Sowell et al. 2002). Given that children can approximate adult level accuracy, e.g., their responses are close but not as precise as those of adults even after short delays (Luna et al. 2004), the regions noted above may collectively support those processes that are specific to providing fidelity in working memory responses in older subjects. The circuitry that supports enhanced working memory precision may be inadvertently suppressed because of immaturities that do not yet allow them to be used effectively (e.g., quickly) to guide memory-guided responses. Children may thus reduce activity in these regions and instead focus processing capacity on regions that support general aspects of accuracy but not necessarily precision, such as the posterior parietal cortex. Adolescents' time courses from clusters in a fronto-insular-temporal network, including IFG and MTG, had greater percent signal changes relative to adults (Fig. 7). These results suggest that, although they recruit similar regions as adults, adolescents need to exert more effort and/or are less efficient in their ability to recruit those regions, possibly reflective of continued underlying structural immaturities.
Extended delay regions
During long delay trials, all age groups recruited a distributed network of regions, including the cortical eye fields, posterior parietal cortex, and various prefrontal foci (Fig. 4B), qualitatively quite similar to short delay trials (Fig. 4A). In a contrast of short and long delay trial activations within each age group, however, differences were apparent. Adults activated bilateral inferior parietal lobule more during long delay trials than short, similar to findings implicating IPL in maintenance processing (Curtis 2006; Curtis et al. 2004). Adults also recruited two lateral prefrontal regions more during long delays than short, a region in the right inferior frontal gyrus (BA 9, 45) and one in left inferior frontal gyrus (BA 10, 46). Interestingly, the left IFG was recruited by each age group, but the magnitude of the contrast was less in older compared with younger subjects. One interpretation of this observation is that adults may not have to work as hard to engage this region. Given that adults generate the most precise final corrective saccade, these areas may be involved in specific performance enhancing computations (e.g., recruited to reduce distracters or re-update the maintained memory trace) (Geier et al. 2007; Sakai et al. 2002).
In contrast to adults, adolescents, and children recruited considerably more regions to support long delay trials (Table 3), suggesting both immaturities in maintenance processes and in the efficiency of supporting maintenance with a well-defined and restricted circuitry. An interesting difference between the children and adolescent group is that children had more numerous activity differences in posterior parietal cortex than adolescents. This result suggests that, although some underlying VSWM processes may not yet be fully mature in adolescence, posterior parietal regions mediating maintenance functions are mostly mature. Furthermore, children showed greater long delay differences in regions throughout the prefrontal cortex, notably in left IFG (BA 10). These results are similar to previous reports (Olesen et al. 2007), indicating enhanced prefrontal activity in children relative to adults and suggest that long delays tax the immature system, perhaps making it more susceptible to distraction. Alternatively, at least some of the activation differences could also be explained if children and adolescents have differential sensitivity to changes in the delay length (i.e., younger subjects may pay more attention to the delay duration) compared with adults. Future developmental studies will need to examine activity related to such perceptual judgments.
Comparing between age groups for long delay trials, we found several clusters with age by time interactions, including specific foci in MFG, IPL, FEF, and IFG (Fig. 9). In these regions, children showed an early peak, whereas adults and adolescents did not recruit most of these regions until later in the trial. The late activation of FEF and IFG by adults could reflect a role in feedback processing following the initial memory-guided response, ultimately leading to more precise corrective saccades. The IPL was active throughout the trial, again reflecting a role in maintenance. In IPL, IFG, and FEF, the children's early response was transient and returned to baseline before the end of the trial, whereas the MFG response persisted at a high magnitude. This pattern suggests that children are heavily relying on the MFG throughout the trial, perhaps as a maintenance region or, alternatively, to inhibit task irrelevant distracters (D'Esposito et al. 2006; Sakai et al. 2002).
Finally, a qualitative comparison between the omnibus age group by time by delay trial type interaction and the short delay trials main effect of time image showed that an anterior-lateral portion of the right inferior parietal lobule came on-line during long but not short delay trials. This suggests that one function of the right IPL may be to support the additional demands on the working memory system imposed by the long delay trials, the primary component of which is maintenance. These results are consistent with results indicating that load-dependent activation increases in inferior parietal cortex (Kirschen et al. 2005).
We note that one limitation of this study was the inclusion of all trials regardless of behavioral performance. As such, it is possible that a portion of the activation observed, particularly in children, was caused by the processing of errors. However, we would expect such introduced noise to be minimal for several reasons. First, the majority of errors made by all subjects were inhibitory failures during the delay period—breaking fixation and generating a memory-guided response to the target location. As such, even during error trials, a memory-guided response was still generated. Second, we note that the correct response rates of scored trials were still reasonably high (≥82.4%). Inhibitory errors during the memory-guided saccade task are typically low, as we have shown in a large population (∼5% for adolescents and adults and 10% for children) (Luna et al. 2004) and as was reflected from scored trials (≤18%), indicating that a majority of the activation observed is still reasonably attributable to correct trials.
In summary, our findings indicate that brain processes supporting basic spatial working memory, including prefrontal systems, are established by childhood. These core processes enable children to make goal-directed responses based on information stored in working memory. However, brain systems contributing to the fidelity of the working memory representation and response precision continue to mature through adolescence. Adolescents recruited a similar circuitry as adults but still showed immaturities in recruiting fronto-insular-temporal regions. The mature system was distinguished from the earlier stages of development by presumed efficiency in the recruitment of regions and the well-defined system, supporting more difficult extended periods of working memory maintenance. Taken together, these results suggest that from childhood to adolescence the optimal circuitry is still being established, whereas from adolescence to adulthood, the established circuitry continues to be specialized. This increased specialization may support behavioral improvements in spatial working memory accuracy (Luna et al. 2004).
GRANTS
This work was supported by National Institute of Mental Health Grants MH-01727 and MH-067924.
Acknowledgments
We thank J. Sweeney, K. Velanova, M. Wheeler, and E. Reichle for valuable discussions and advice related to the methods and analyses conducted in this manuscript. We also thank the staff at the Laboratory of Neurocognitive Development and all participants and their families who volunteered for this study.
The costs of publication of this article were defrayed in part by the payment of page charges. The article must therefore be hereby marked “advertisement” in accordance with 18 U.S.C. Section 1734 solely to indicate this fact.
Footnotes
The online version of this article contains supplemental data.
REFERENCES
- Alexander et al. 1986.Alexander GE, DeLong MR, Strick PL. Parallel organization of functionally segregated circuits linking basal ganglia and cortex. Ann Rev Neurosci 9: 357–381, 1986. [DOI] [PubMed] [Google Scholar]
- Awh and Jonides 2001.Awh E, Jonides J. Overlapping mechanisms of attention and spatial working memory. Trends Cogn Sci 5: 119–126, 2001. [DOI] [PubMed] [Google Scholar]
- Beauchamp et al. 2001.Beauchamp MS, Petit L, Ellmore TM, Ingeholm J, Haxby JV. A parametric fMRI study of overt and covert shifts of visuospatial attention. NeuroImage 14: 310–321, 2001. [DOI] [PubMed] [Google Scholar]
- Boynton et al. 1996.Boynton GM, Engel SA, Glover GH, Heeger DJ. Linear systems analysis of functional magnetic resonance imaging in human V1. J Neurosci 16: 4207–4221, 1996. [DOI] [PMC free article] [PubMed] [Google Scholar]
- Brocki and Bohlin 2004.Brocki KC, Bohlin G. Executive functions in children aged 6 to 13: A dimensional and developmental study. Dev Neuropsych 26: 571–593, 2004. [DOI] [PubMed] [Google Scholar]
- Brown et al. 2004.Brown MR, Desouza JF, Goltz HC, Ford K, Menon RS, Goodale MA, Everling S. Comparison of memory- and visually guided saccades using event-related fMRI. J Neurophysiol 91: 873–889, 2004. [DOI] [PubMed] [Google Scholar]
- Casey et al. 1995.Casey BJ, Cohen JD, Jezzard P, Turner R, Noll DC, Trainor RJ, Giedd J, Kaysen D, Hertz-Pannier L, Rapoport JL. Activation of prefrontal cortex in children during a nonspatial working memory task with functional MRI. NeuroImage 2: 221–229, 1995. [DOI] [PubMed] [Google Scholar]
- Ciesielski et al. 2006.Ciesielski KT, Lesnik PG, Savoy RL, Grant EP, Ahlfors SP. Developmental neural networks in children performing a categorical N-back task. NeuroImage 33: 980–990, 2006. [DOI] [PubMed] [Google Scholar]
- Corbetta et al. 1998.Corbetta M, Akbudak E, Conturo TE, Snyder AZ, Ollinger JM, Drury HA, Linenweber MR, Petersen SE, Raichle ME, Van Essen DC, Shulman GL. A common network of functional areas for attention and eye movements. Neuron 21: 761–773, 1998. [DOI] [PubMed] [Google Scholar]
- Cox 1996.Cox RW AFNI: Software for analysis and visualization of functional magnetic resonance neuroimages. Comput Biomed Res 29: 162–173, 1996. [DOI] [PubMed] [Google Scholar]
- Crone et al. 2006.Crone EA, Wendelken C, Donohue S, van Leijenhorst L, Bunge SA. Neurocognitive development of the ability to manipulate information in working memory. Proc Natl Acad Sci USA 103: 9315–9320, 2006. [DOI] [PMC free article] [PubMed] [Google Scholar]
- Curtis 2006.Curtis CE Prefrontal and parietal contributions to spatial working memory. Neuroscience 139: 173–180, 2006. [DOI] [PubMed] [Google Scholar]
- Curtis et al. 2004.Curtis CE, Rao VY, D'Esposito M. Maintenance of spatial and motor codes during oculomotor delayed response tasks. J Neurosci 24: 3944–3952, 2004. [DOI] [PMC free article] [PubMed] [Google Scholar]
- D'Esposito et al. 2006.D'Esposito M, Postle BR, Rypma B. Prefrontal cortical contributions to working memory: evidence from event-related fMRI studies. Exp Brain Res 133: 3–11, 2006. [DOI] [PubMed] [Google Scholar]
- Dale 1999.Dale AM Optimal experimental design for event-related fMRI. Human Brain Mapp 8: 109–114, 1999. [DOI] [PMC free article] [PubMed] [Google Scholar]
- Dale and Buckner 1997.Dale AM, Buckner RL. Selective averaging of rapidly presented individual trials using fMRI. Human Brain Mapp 5: 329–340, 1997. [DOI] [PubMed] [Google Scholar]
- DeLuca et al. 2003.DeLuca CR, Wood SJ, Anderson V, Bucanan J, Proffitt TM, Mahony K. Normative data from the Cantab. I. Development of executive function over the lifespan. J Clin Exp Neuropsychol 25: 242–254, 2003. [DOI] [PubMed] [Google Scholar]
- Demetriou et al. 2002.Demetriou A, Christou C, Spanoudis G, Platsidou M. The development of mental processing: efficiency, working memory, and thinking. Monogr Soc Res Child Dev 67: 1–155, 2002. [PubMed] [Google Scholar]
- Diamond and Goldman-Rakic 1989.Diamond A, Goldman-Rakic PS. Comparison of human infants and rhesus monkeys on Piaget's AB task: evidence for dependence on dorsolateral prefrontal cortex. Exp Brain Res 74: 24–40, 1989. [DOI] [PubMed] [Google Scholar]
- Dosenbach et al. 2006.Dosenbach NU, Visscher KM, Palmer ED, Miezin FM, Wenger KK, Kang HC, Burgund ED, Grimes AL, Schlaggar BL, Petersen SE. A core system for the implementation of task sets. Neuron 50: 799–812, 2006. [DOI] [PMC free article] [PubMed] [Google Scholar]
- Egeth and Yantis 1997.Egeth HE, Yantis S. Visual attention: control, representation, and time course. Ann Rev Psychol 48: 269–297, 1997. [DOI] [PubMed] [Google Scholar]
- Funahashi et al. 1989.Funahashi S, Bruce CJ, Goldman-Rakic PS. Mnemonic coding of visual space in the monkey's dorsolateral prefrontal cortex. J Neurophysiol 61: 331–349, 1989. [DOI] [PubMed] [Google Scholar]
- Gathercole et al. 2004.Gathercole SE, Pickering SJ, Ambridge B, Wearing H. The structure of working memory from 4 to 15 years of age. Dev Psychol 40: 177–190, 2004. [DOI] [PubMed] [Google Scholar]
- Geier et al. 2007.Geier CF, Garver KE, Luna B. Circuitry underlying temporally extended spatial working memory. Neuoimage 35: 904–915, 2007. [DOI] [PMC free article] [PubMed] [Google Scholar]
- Gitelman 2002.Gitelman DR ILAB: a program for postexperimental eye movement analysis. Behav Res Methods Instr Computers J Psychon Soc 34: 605–612, 2002. [DOI] [PubMed] [Google Scholar]
- Gogtay et al. 2004.Gogtay N, Giedd JN, Lusk L, Hayashi KM, Greenstein D, Vaituzis AC, Nugent TF3, Herman DH, Clasen LS, Toga AW, Rapoport JL, Thompson PM. Dynamic mapping of human cortical development during childhood through early adulthood. Proc Natl Acad Sci USA 101: 8174–8179, 2004. [DOI] [PMC free article] [PubMed] [Google Scholar]
- Goldman-Rakic et al. 1992.Goldman-Rakic PS, Bates JF, Chafee MV. The prefrontal cortex and internally generated motor acts. Curr Opin Neurobiol 2: 830–835, 1992. [DOI] [PubMed] [Google Scholar]
- Gusnard and Raichle 2001.Gusnard DA, Raichle ME. Searching for a baseline: functional imaging and the resting human brain. Nat Rev Neurosci 2: 685–694, 2001. [DOI] [PubMed] [Google Scholar]
- Haber et al. 1995.Haber SN, Kunishio K, Mizobuchi M, Lynd-Balta E. The orbital and medial prefrontal circuit through the primate basal ganglia. J Neurosci 15: 4851–4867, 1995. [DOI] [PMC free article] [PubMed] [Google Scholar]
- Harel et al. 2002.Harel N, Lee SP, Nagoaka T, Kim DS, Kim SG. Origin of negative blood oxygenation level-dependent fMRI signals. J Cereb Blood Flow Metab 22: 908–917, 2002. [DOI] [PubMed] [Google Scholar]
- Hikosaka and Wurtz 1983.Hikosaka O, Wurtz RH. Visual and oculomotor functions of monkey substantia nigra pars reticulata. III. Memory-contingent visual and saccade responses.J Neurophysiol 49: 1268–1284, 1983. [DOI] [PubMed] [Google Scholar]
- Jenkinson and Smith 2001.Jenkinson M, Smith S. A global optimisation method for robust affine registration of brain images. Med Image Anal 5: 143–156, 2001. [DOI] [PubMed] [Google Scholar]
- Johnstone et al. 2007.Johnstone T, van Reekum CM, Urry HL, Kalin NH, Davidson RJ. Failure to regulate: counterproductive recruitment of top-down prefrontal-subcortical circuitry in major depression. J Neurosci 27: 8877–8884, 2007. [DOI] [PMC free article] [PubMed] [Google Scholar]
- Kirschen et al. 2005.Kirschen MP, Chen SH, Schraedley-Desmond P, Desmond JE. Load- and practice-dependent increases in cerebro-cerebellar activation in verbal working memory: an fMRI study. NeuroImage 24: 462–472, 2005. [DOI] [PubMed] [Google Scholar]
- Klingberg et al. 2002.Klingberg T, Forssberg H, Westerberg H. Increased brain activity in frontal and parietal cortex underlies the development of visuospatial working memory capacity during childhood. J Cog Neurosci 14: 1–10, 2002. [DOI] [PubMed] [Google Scholar]
- Kwon et al. 2002.Kwon H, Reiss RL, Menon V. Neural basis of protracted developmental changes in visuo-spatial working memory. Proc Natl Acad Sci USA 99: 13336–13341, 2002. [DOI] [PMC free article] [PubMed] [Google Scholar]
- Kwong et al. 1992.Kwong KK, Belliveau JW, Chesler DA, Goldberg IE, Weisskoff RM, Poncelet BP, Kennedy DN, Hoppel BE, Cohen MS, Turner R, et al. Dynamic magnetic resonance imaging of human brain activity during primary sensory stimulation. Proc Natl Acad Sci USA 89: 5675–5679, 1992. [DOI] [PMC free article] [PubMed] [Google Scholar]
- LaBar et al. 1999.LaBar KS, Gitelman DR, Parrish TB, Mesulam M. Neuroanatomic overlap of working memory and spatial attention networks: a functional MRI comparison within subjects. NeuroImage 10: 695–704, 1999. [DOI] [PubMed] [Google Scholar]
- Leigh and Zee 1999.Leigh RJ, Zee DS. The Neurology of Eye Movements (3rd ed.). New York: Oxford University Press, 1999.
- Luna et al. 2004.Luna B, Garver KE, Urban TA, Lazar NA, Sweeney JA. Maturation of cognitive processes from late childhood to adulthood. Child Dev 75: 1357–1372, 2004. [DOI] [PubMed] [Google Scholar]
- Luna and Sweeney 2004.Luna B, Sweeney JA. The emergence of collaborative brain function: fMRI studies of the development of response inhibition. Ann NY Acad Sci 1021: 296–309, 2004. [DOI] [PubMed] [Google Scholar]
- Luna et al. 2001.Luna B, Thulborn KR, Munoz DP, Merriam EP, Garver KE, Minshew NJ, Keshavan MS, Genovese CR, Eddy WF, Sweeney JA. Maturation of widely distributed brain function subserves cognitive development. NeuroImage 13: 786–793, 2001. [DOI] [PubMed] [Google Scholar]
- Luna et al. 1998.Luna B, Thulborn KR, Strojwas MH, McCurtain BJ, Berman RA, Genovese CR, Sweeney JA. Dorsal cortical regions subserving visually-guided saccades in humans: an fMRI study. Cereb Cortex 8: 40–47, 1998. [DOI] [PubMed] [Google Scholar]
- Merriam et al. 2003.Merriam EP, Genovese CR, Colby CL. Spatial updating in human parietal cortex. Neuron 39: 361–373, 2003. [DOI] [PubMed] [Google Scholar]
- Merriam et al. 2007.Merriam EP, Genovese CR, Colby CL. Remapping in human visual cortex. J Neurophysiol 97: 1738–1755, 2007. [DOI] [PMC free article] [PubMed] [Google Scholar]
- Middleton and Strick 2002.Middleton FA, Strick PL. Basal-ganglia ‘projections’ to the prefrontal cortex of the primate. Cereb Cortex 12: 926–935, 2002. [DOI] [PubMed] [Google Scholar]
- Nagy et al. 2004.Nagy Z, Westerberg H, Klingberg T. Maturation of white matter is associated with the development of cognitive functions during childhood. J Cogn Neurosci 16: 1227–1233, 2004. [DOI] [PubMed] [Google Scholar]
- Nelson et al. 2000.Nelson CA, Monk CS, Lin J, Carver LJ, Thomas KM, Truwitt CL. Functional neuroanatomy of spatial working memory in children. Dev Psychol 36: 109–116, 2000. [DOI] [PubMed] [Google Scholar]
- Ogawa et al. 1992.Ogawa S, Tank DW, Menon R, Ellermann JM, Kim SG, Merkle H, Ugurbil K. Intrinsic signal changes accompanying sensory stimulation: functional brain mapping with magnetic resonance imaging. Proc Natl Acad Sci USA 89: 5951–5955, 1992. [DOI] [PMC free article] [PubMed] [Google Scholar]
- Olesen et al. 2007.Olesen PJ, Macoveanu J, Tegner J, Klingberg T. Brain activity related to working memory and distraction in children and adults. Cereb Cortex 17: 1047–1054, 2007. [DOI] [PubMed] [Google Scholar]
- Olesen et al. 2003.Olesen PJ, Nagy Z, Westerberg H, Klingberg T. Combined analysis of DTI and fMRI data reveals a joint maturation of white and grey matter in a fronto-parietal network. Cogn Brain Res 18: 48–57, 2003. [DOI] [PubMed] [Google Scholar]
- Paus 1996.Paus T Location and function of the human frontal eye-field: a selective review. Neuropsychologia 34: 475–483, 1996. [DOI] [PubMed] [Google Scholar]
- Postle 2006.Postle BR Working memory as an emergent property of the mind and brain. Neuroscience 139: 23–28, 2006. [DOI] [PMC free article] [PubMed] [Google Scholar]
- Postle et al. 2000.Postle BR, Berger JS, Taich AM, D'Esposito M. Activity in human frontal cortex associated with spatial working memory and saccadic behavior. J Cog Neurosci 12: 2–14, 2000. [DOI] [PubMed] [Google Scholar]
- Rubia et al. 2006.Rubia K, Smith AB, Woolley J, Nosarti C, Heyman I, Taylor E, Brammer M. Progressive increase of frontostriatal brain activation from childhood to adulthood during event-related tasks of cognitive control. Hum Brain Mapp 27: 973–993, 2006. [DOI] [PMC free article] [PubMed] [Google Scholar]
- Sakai et al. 2002.Sakai K, Rowe JB, Passingham RE. Active maintenance in prefrontal area 46 creates distractor-resistant memory. Nat Neurosci 5: 479–584, 2002. [DOI] [PubMed] [Google Scholar]
- Scherf et al. 2006.Scherf KS, Sweeney JA, Luna B. Brain basis of developmental change in visuospatial working memory. J Cog Neurosci 18: 1045–1058, 2006. [DOI] [PubMed] [Google Scholar]
- Schluppeck et al. 2005.Schluppeck D, Glimcher P, Heeger DJ. Topographic organization for delayed saccades in human posterior parietal cortex. J Neurophysiol 94: 1372–1384, 2005. [DOI] [PMC free article] [PubMed] [Google Scholar]
- Schmidt et al. 2007.Schmidt D, Krause BJ, Weiss PH, Fink GR, Shah NJ, Amorim MA, Müller HW, Berthoz A. Visuospatial working memory and changes of the point of view in 3D space. NeuroImage 36: 955–968, 2007. [DOI] [PubMed] [Google Scholar]
- Schweinsburg et al. 2005.Schweinsburg AD, Nagel BJ, Tapert SF. fMRI reveals alteration of spatial working memory networks across adolescence. J Int Neuropsychol Soc 11: 631–644, 2005. [DOI] [PMC free article] [PubMed] [Google Scholar]
- Selemon and Goldman-Rakic 1985.Selemon LD, Goldman-Rakic PS. Longitudinal topography and interdigitation of corticostriatal projections in the Rhesus monkey. J Neurosci 5: 776–794, 1985. [DOI] [PMC free article] [PubMed] [Google Scholar]
- Serences et al. 2004.Serences JT, Schwarzbach J, Courtney SM, Golay X, Yantis S. Control of object-based attention in human cortex. Cereb Cortex 14: 1346–1357, 2004. [DOI] [PubMed] [Google Scholar]
- Shmuel et al. 2006.Shmuel A, Augath M, Oeltermann A, Logothetis NK. Negative functional MRI response correlates with decreases in neuronal activity in monkey visual area V1. Nat Neurosci 9: 569–577, 2006. [DOI] [PubMed] [Google Scholar]
- Smith et al. 2004.Smith AT, Williams AL, Singh KD. Negative BOLD in the visual cortex: evidence against blood stealing. Hum Brain Mapp 21: 213–220, 2004. [DOI] [PMC free article] [PubMed] [Google Scholar]
- Smith 2002.Smith SM Fast robust automated brain extraction. Hum Brain Mapp 17: 143–155, 2002. [DOI] [PMC free article] [PubMed] [Google Scholar]
- Smith et al. 2004.Smith SM, Jenkinson M, Woolrich MW, Beckmann CF, Behrens TE, Johansen-Berg H, Banister PR, De Luca M, Drobnjak I, Flitney DE, Niazy RK, Saunders J, Vickers J, Zhang Y, De Stefano N, Brady JM, Matthews PM. Advances in functional and structural MR image analysis and implementation as FSL. NeuroImage 23:S208–S219, 2004. [DOI] [PubMed] [Google Scholar]
- Sowell et al. 2002.Sowell ER, Trauner DA, Gamst A, Jernigan TL. Development of cortical and subcortical brain structures in childhood and adolescence: a structural MRI study. Dev Med Child Neurol 44: 4–16, 2002. [DOI] [PubMed] [Google Scholar]
- Swanson 1999.Swanson HL What develops in working memory? A life span perspective. Dev Psychol 35: 986–1000, 1999. [DOI] [PubMed] [Google Scholar]
- Sweeney et al. 1996.Sweeney JA, Mintun MA, Kwee S, Wiseman MB, Brown DL, Rosenberg DR, Carl JR. Positron emission tomography study of voluntary saccadic eye movements and spatial working memory. J Neurophysiol 75: 454–468, 1996. [DOI] [PubMed] [Google Scholar]
- Tamm et al. 2002.Tamm L, Menon V, Reiss AL. Maturation of brain function associated with response inhibition. J Am Acad Child Adolesc Psychiatry 41: 1231–1238, 2002. [DOI] [PubMed] [Google Scholar]
- Thomas et al. 1999.Thomas KM, King SW, Franzen PL, Welsh TF, Berkowitz AL, Noll DC, Birmaher V, Casey BJ. A developmental functional MRI study of spatial working memory. NeuroImage 10: 327–338, 1999. [DOI] [PubMed] [Google Scholar]
- Van Essen 2002.Van Essen DC Windows on the brain: the emerging role of atlases and databases in neuroscience. Curr Opin Neurobiol 12: 574–579, 2002. [DOI] [PubMed] [Google Scholar]
- Van Essen et al. 2001.Van Essen DC, Drury HA, Dickson J, Harwell J, Hanlon D, Anderson CH. An integrated software suite for surface-based analyses of cerebral cortex. J Am Med Inform Assoc 8: 443–459, 2001. [DOI] [PMC free article] [PubMed] [Google Scholar]
- Velanova et al. 2008.Velanova K, Wheeler ME, Luna B. Maturational changes in anterior cingulate and frontoparietal recruitment support the development of error processing and inhibitory control. Cereb Cortex 18: 2505–2522, 2008. [DOI] [PMC free article] [PubMed] [Google Scholar]
- Ward 1998.Ward BD Deconvolution analysis of FMRI time series data. Documentation for the AFNI software package. 1998, http://afni.nimh.nih.gov/pub/dist/doc/manual/3dDeconvolve.pdf.
- Weber and Daroff 1972.Weber RB, Daroff RB. Corrective movements following refixation saccades: type and control system analysis. Brain Res 12: 467–475, 1972. [DOI] [PubMed] [Google Scholar]
- Wheeler et al. 2006.Wheeler ME, Shulman GL, Buckner RL, Miezin FM, Velanova K, Petersen SE Evidence for separate perceptual reactivation and search processes during remembering. Cereb Cortex 16: 949–959, 2006. [DOI] [PubMed] [Google Scholar]
- Zald and Iacono 1998.Zald DH, Iacono WG. The development of spatial working memory abilities. Dev Neuropsych 14: 563–578, 1998. [Google Scholar]