

Abstract
Physiological activity of the turtle cerebellar cortex (Cb), maintained in vitro, was recorded during microstimulation of inferior olive (IO). Previous single-electrode responses to such stimulation showed similar latencies across a limited region of Cb, yet those recordings lacked spatial and temporal resolution and the recording depth was variable. The topography and timing of those responses were reexamined using photodiode optical recordings. Because turtle Cb is thin and unfoliated, its entire surface can be stained by a voltage-sensitive dye and transilluminated to measure changes in its local absorbance. Microstimulation of the IO evoked widespread depolarization from the rostral to the caudal edge of the contralateral Cb. The time course of responses measured at a single photodiode matched that of single-microelectrode responses in the corresponding Cb locus. The largest and most readily evoked response was a sagittal band centered about 0.7 mm from the midline. Focal white-matter (WM) microstimulation on the ventricular surface also activated sagittal bands, whereas stimulation of adjacent granule cells evoked a radial patch of activation. In contrast, molecular-layer (ML) microstimulation evoked transverse beams of activation, centered on the rostrocaudal stimulus position, which traveled bidirectionally across the midline to the lateral edges of the Cb. A timing analysis demonstrated that both IO and WM microstimulation evoked responses with a nearly simultaneous onset along a sagittal band, whereas ML microstimulation evoked a slowly propagating wave traveling about 25 cm/s. The response similarity to IO and WM microstimulation suggests that the responses to WM microstimulation are dominated by activation of its climbing fibers. The Cb's role in the generation of precise motor control may result from these temporal and topographic differences in orthogonally oriented pathways. Optical recordings of the turtle's thin flat Cb can provide insights into that role.
INTRODUCTION
The cerebellar cortex (Cb) has a neuronal structure that is highly conserved across vertebrate species (Larsell 1967) and plays a central role in sensorimotor processing. It has three layers overlying white matter whose sole output neurons, Purkinje cells (PCs), are excited by the ascending axons of the granule cells (Cohen and Yarom 1998; Huang et al. 2006; Isope and Barbour 2002; Tolbert et al. 2004), parallel fibers (Eccles et al. 1966b), and climbing fibers (Eccles et al. 1966a), which carry signals from the contralateral inferior olive (IO) (Dow 1942). Recent hypotheses have focused on Cb's role in behavioral timing (Kistler et al. 2000; Kitazawa and Wolpert 2005; Xu et al. 2006; Yarom and Cohen 2002), although controversy surrounds reports that olivocerebellar responses (Sugihara et al. 1993) are synchronous (see Aggelopulos et al. 1995; Baker and Edgley 2006a,b and the responses of Lang et al. 2006). One approach to understand the timing of physiological responses of Cb has been to record multiple responses, first performed on about 2 mm2 of turtle Cb (8 × 8 electrode array recording extracellular fields; Bantli 1972). However, a confounding factor was that response strength and polarity varied with electrode depth (Bantli 1974). Simultaneous recordings of single rat PCs (8 × 12 array, 166-μm spacing; Fukuda et al. 2001; 4 × 8 array, 250-μm spacing; Sasaki et al. 1989) were limited to small Cb regions, due to the deeply foliated nature of mammalian Cb.
To investigate the topography and timing of the entire Cb, we study in vitro turtle cerebellum, a thin unfolded neural sheet (∼1 mm thick from pia to its ventricular surface resting over the fourth ventricle). It is connected to each side of the brain stem by a single cerebellar peduncle. The turtle brain is resistant to hypoxia, permitting topographic analysis of the entire cerebellum in vitro with its brain stem attached. In vitro brain stem neurons are also responsive to natural sensory stimuli: visual patterns imaged on retina (Ariel and Fan 1993; Fan et al. 1993) and head rotation (Fan et al. 1997). The climbing fiber input to turtle Cb was previously investigated using a single micropipette to record extracellular fields following IO microstimulation (Ariel 2005). It was found that moving the stimulus site along the fourth ventricle wall from the IO toward the peduncle shortened response latency within the Cb. However, response latency was independent of the recording site within the Cb. It was suggested that an invariant latency of the Cb following IO stimulation is caused by changes in its conduction velocity within the entire Cb but not within the brain stem. However, the poor spatial resolution of extracellular field recordings and their variability with electrode depth led to concerns about this conclusion (Baker and Edgley 2006a).
Because the turtle Cb is thin, a novel approach is developed here to simultaneously record physiological responses across the entire Cb surface using voltage-sensitive dye recording techniques developed by Salzberg and Grinvald (Baker et al. 2005; see modern reviews by Ebner and Chen 1995; Salzberg et al. 1977; Wu et al. 1998). This technique permits us to measure physiological activity with submillisecond resolution from a two-dimensional sheet of cortical tissue during afferent stimulation. Fluorescent optical recordings from Cb have been reported in vivo (Chen et al. 1996, 1998; neutral red fluorescence, Kim et al. 1989; flavoprotein autofluorescence, Reinert et al. 2004) and in vitro (fluorescent voltage-sensitive dyes in rodents, Arata and Ito 2004; Cohen and Yarom 1999, 2000b). Here, the entire turtle brain was stained in voltage-sensitive absorbance dye and then absorbance changes in transilluminated light were measured (Konnerth et al. 1987). We find that the timing and topography of Cb responses to electrical stimulation reveal a distinct orthogonal structure of radial, transverse, and sagittal pathways within this simple vertebrate cerebellar cortex.
METHODS
Common red-ear pond turtles, Trachemys scripta elegans, were housed at room temperature in an aquarium on a 16/8-h light/dark cycle, where they could swim and bask at will. The carapace lengths of the turtles were 15–18 cm, whose cerebella were 4.89 ± 0.55 mm wide and 3.81 ± 0.50 mm long (n = 24). However, in some experiments that examined responses at different layers of intracerebellar microstimulation, the cerebella of 30-cm turtles were used. The turtles were handled and housed in accordance with National Institutes of Health guidelines. The protocols of animal care and surgical procedures were approved by the Saint Louis University Animal Care Committee.
Turtle brain stem preparation
The surgery and the turtle preparation have been presented in detail previously (Fan et al. 1993; Rosenberg and Ariel 1990), so only the new technical aspects of optical recordings are now described. The brain was removed from the anesthetized animal, its telencephalon was quickly ablated, and the brain stem was placed in a petri dish of physiological media. One cerebellar peduncle was cut and the dura and choroid plexus were then carefully removed around the cerebellum to facilitate unimpeded staining. The entire tissue was immersed 30–60 min in a voltage-sensitive oxonol dye solution (1 mg/2.5 mL of oxygenated physiological media). Several oxonol dyes yielded similar results, but experiments shown here used only RH482 (supplied as NK3630 from Nippon Kankoh, Japan) or JPW 1132 from L. Loew (Univ. of Connecticut). The polarity of the absorbance changes using this dye depended on the wavelengths of the illumination, indicating that these dyes signal changes in membrane voltage and not intrinsic optical signals due to light scattering (Brown and Ariel 2007).
After staining, the intact tissue was rinsed in control oxygenated physiological media for an additional 15 min, to remove excess dye. The stained tissue was then transferred to a recording chamber on a fixed-stage pedestal above the optical condenser of a standard upright Olympus BX microscope (BX-51, Olympus, Tokyo, Japan). The floor of this Plexiglas two-level recording chamber was made of #1 thickness optical cover glass to maintain optical quality during transillumination of the tissue (Fig. 1A), The back section was 5 mm deep to accommodate the larger brain stem, whereas the Cb was placed in a 3-mm-deep front section. The entire floor of the recording chamber was covered by a 1-mm layer of Sylgard to facilitate pinning and immobilization of the tissue during recording.
FIG. 1.

In vitro turtle brain stem–cerebellum preparation stained with the voltage-sensitive dye RH482. A: photographs of a turtle preparation in the recording chamber during ambient room illumination. The camera was in the front of the microscope directed toward the microscope stage. The oxygenated media enters from the hypodermic needle at the bottom right, passes over the tissue, and then is aspirated from the back compartment of the chamber (not shown). The cerebellar cortex (Cb) is rotated away from the brain stem by cutting its left peduncle and pinning it ventricular side up to the Sylgard floor of the front shallow compartment of the chamber. The brain stem was pinned dorsal side up in the middle deeper compartment, which also contains the ground wire. For optical clarity, the Cb is covered with a rectangle of coverslip glass, which is held in place by a lead weight in the back. B: the transilluminated Cb was also photographed through the ×2 objective of the microscope via a port that maintains a fixed alignment with the photodiode array. The midline raphe is observed between the rostral and caudal midpoints (see arrows). A glass micropipette was placed into the cerebellum so that its tip, bent at 90° but no longer visible deep in the tissue, can be positioned near the Purkinje cell layer. The shank of that pipette (A, top right) had another bend to avoid touching the cover glass, the chamber walls, and the microscope objective. The top left of A shows the shank of a bipolar stimulating electrode whose tip was inserted in the contralateral inferior olive (IO), near the obex of the floor of the 4th ventricle. These photographs show the caudal Cb down, as it appears when viewed in front of the microscope. All subsequent figures display the cerebellum with its rostral end down, as viewed through the microscope oculars.
The preparation was first placed in the back section of the recording chamber with the brain stem dorsal side up. The Cb was deflected and pinned to the front section of the recording chamber, ventricular surface up. Because the Cb curves down slightly in vivo as it covers the brain stem, edges of the in vitro Cb were stretched slightly while being pinned to obtain a relatively flat and uniform surface. In some experiments, the whole preparation was flipped so that the brain stem was ventral side up and the pial surface of the Cb faced upward. In this latter case, the molecular layer (ML) was more readily accessible.
For the accurate registration of Cb topography with the photodiode array's signals, photomicrographs of the transilluminated tissue were captured by a digital camera attached to the trinocular port of the microscope (Fig. 1B). Insertions of stimulating electrodes through the ventricular surface were unimpeded, whereas the fibrous pial membrane was not penetrable. To allow unimpeded access to the ML through the pial surface, small patches of pia were removed. Also, when the pia faced upward, the midline raphe (or groove) could not be visualized, so the accurate identification of the Cb's orientation was limited.
The physiological media entered the recording chamber by gravity flow and was removed by suction. A 7-mm-wide strip of #1 cover glass was placed directly over the Cb to minimize optical distortion of the moving surface of physiological media, leaving 2 mm between the Cb's surface and the overlying cover glass. Distortion was also prevented during the 1- to 5-s recordings by closing two pinch valves on the inflow and outflow chamber tubing. Finally, the entire recording apparatus was stabilized on a vibration-isolation table.
Optical recordings
Light from a 150-W tungsten–halogen bulb powered with 8.5 A from a regulated DC power supply was directed through a standard condenser to transilluminate the tissue in the recording chamber using full-field Köhler illumination. In some cases, a point source of light illuminated the array with and without the presence of intervening Cb to evaluate light scattering by the tissue. Those data indicate that the Cb significantly increased the light scatter from the diode sensing the point source but only to the immediately adjacent diodes.
The transilluminating light was restricted to 715 ± 35 nm by an interference filter (Chroma Technology, Brattleboro, VT) so that a decrease in absorbance by the voltage-sensitive dye RH482 is equivalent to a membrane depolarization. The image of the tissue was formed through a dual-port adaptor onto either the optical element of a Motic-1000 digital camera or a 464-photodiode array (WuTech H-469IV PDA, Gaithersburg, MD), using one of two microscope objectives (×2 PlanApo numerical aperture [NA] 0.08 or ×5 UMplanFL NA 0.15; Olympus). At those magnifications, each diode detects 0.06 and 0.024 mm2 of Cb, respectively. Given 645 Purkinje cell bodies/mm2 in turtle Cb (see Ariel et al. 2005), each diode may image not only 39 and 15 somata, but also the dendritic trees of many more PCs.
Before the actual recording, the Cb is illuminated for 1 s while the signal from each photodiode (time constant of ∼20 s) was adjusted by electronically subtracting its DC offset. In all, 4,096 voltage points of each of 464 photodiodes were sampled at 1.6 kHz to generate 2.51-s traces. To orient the photodiode-array data set, it was compared with the images of the microscope's digital camera stored just prior to the optical recording. A low-magnification photograph of the preparation was made to record the position of stimulating electrodes outside the field of view of the microscopic objectives.
OLIVARY AND INTRACEREBELLAR MICROSTIMULATION AND ELECTROPHYSIOLOGICAL RECORDING.
Straight-tipped tungsten bipolar microelectrodes (125-μM tip separation) were advanced at 45° angle into the IO. Manipulating stimulating electrodes into the Cb was more difficult due to the overlying cover glass. Consequently, a right-angle bend was made 1.5 mm from the tip of each bipolar microelectrodes and the shaft was oriented parallel and just below the cover glass and then advanced perpendicular to the Cb surface. These bipolar electrodes delivered biphasic current pulses (AM Systems 2100, Carlsborg, WA) that varied between 4 pulses at 1.7 Hz and 27 pulses at 23 Hz. All stimulating pulses were 100 μs long using 5–200 μA.
In some experiments, extracellular field potentials were recorded for comparison with the optical data (Ariel 2005). A glass recording micropipette (25-μm tip diameter, filled with 3 M K-acetate, DC resistance <1 MΩ) was bent at three right angles and then advanced into the Cb under the cover glass. Potentials were recorded with respect to a chlorided silver ground wire in the recording chamber. The presence of the pipette tip did not change the local optical signals, indicating no effects of any potassium diffusion. Signals were amplified using a 3-kHz low-pass filtered cutoff frequency and recorded by NeuroPlex software (RedShirt Imaging, Fairfield, CT).
Analysis of optical signals
Absorbance changes were first analyzed using NeuroPlex software. The raw recordings of the diodes were displayed as 464 individual traces. Each trace was associated with a value of resting light intensity (RLI) measured for that diode without stimulation but with the same illumination of the tissue in the same position. The RLI values of the Cb stained with RH482 did not vary significantly over the course of these experiments (≤36 h). The NeuroPlex software automatically computed the relative optical signal (ΔI/I, the change in light intensity transmitted through the preparation divided by the absolute light intensity) for each trace and saved the raw data as a binary file of the RLI and 464 voltage traces. Assuming that regional variations in light intensity transmitted through the tissue were similar before and after staining, the optical signal can be assumed to be linearly related to the fractional change in dye absorption (−ΔA/A, the change in light absorbance of the dye divided by the steady-state absolute absorbance of the dye), which relates to the change in membrane voltage (Salzberg et al. 1977). All absorbance changes were electrically evoked because the turtle Cb has low spontaneous spike activity when studied in vitro (Fan et al. 1993) and no spontaneous waves were observed without electrical stimulation of this preparation. Also, based on the RLI, diodes were excluded from processing if they did not image the biological tissue or they had resting light levels that were too low to transmit meaningful signals.
AVERAGING AND TEMPORAL FILTERING.
Each diode of the WuTech H-469IV PDA exhibits a very long time constant (∼20 s), which permitted a baseline drift in the unfiltered signal. This drift was often similar for all of the 464 diodes, suggesting that it resulted from a common optical variable, such as changes of the lamp output or its power supply. Even after these variables were minimized, it was often necessary to remove slow artifactual drift by applying a minimal digital filter to each diode's trace. Filtering had a very minimal effect on the response onset timing and amplitude, although response duration was slightly shortened. In this experimental sample, response duration did not correlate with any stimulus parameters.
DETECTION OF RESPONSIVE DIODES.
Recordings were analyzed off-line by Matlab (The MathWorks, Natick, MA) to quantify response latency and amplitude. To detect a subset from the 464 diodes that exhibited significant responses, two methods were used: wavelet detection of the rise-time latency (maximal slope after response onset) and amplitude detection of the time-to-peak latency. Of the two methods, wavelet detection was more reliable because it was less sensitive to the shape of the response peak. In both cases, the traces were routinely viewed for errors in diode detection.
RESPONSE LATENCY.
Spatial analyses were made of the responsive diodes in each experiment. First, responses were averaged for the standard recording (four responses in each 2.51-s trace) and, if possible, so too were consecutive records of responses evoked under similar stimulus conditions. A single data set was considered statistically synchronous if the slope of the linear regression line that fit those data were not significantly different from zero. Differences between experimental groups were determined by ANOVA. If the F ratio indicated significant differences, a Fisher's least significant difference (protected t) test was performed to establish differences between individual sample means.
Quantifications of the responsive photodiodes included their response latencies, their peak amplitudes, and their distance from the stimulating point within the cerebellum (or from the peduncle for IO microstimulation; see Ariel 2005). Latencies were plotted against the conduction distance on latency–distance plots and then fitted to a line by least-squares regression. In case there were artifactual optical signals from diodes immediately adjacent to the stimulating point, those fits were also performed with those diodes excluded, although the results were the same. The correlation coefficient of the fitted line determined whether the slope was significantly different from a zero slope.
The response pattern was viewed as a grayscale latency array. The diodes were displayed as gray boxes whose darkness was scaled as a function of their response latency. Diodes with the longest response latencies were displayed as darkest and those with the shortest latencies were lightest. Latency profiles that showed a regular change in the darkening of the boxes across the array indicated that the latency changed along that vector as the response slowly propagated.
PEAK AMPLITUDE OF RESPONSE FIELDS.
From the same diodes detected for the conduction latency analysis, a threshold was chosen that would select a large yet contiguous region of responsive diodes. A custom Matlab script was used to fit an ellipse to those diodes and the major and minor axes were used to quantify the response topography. Response orientation was measured when the length of its major axis was more than twice the length of the minor axis. Orientation data were excluded from preparations in which the pia faced up to the microscope objective, thereby obscuring the midline raphe. The major axes of the remaining data set were plotted together to show the orientation of the response fields, relative to the midline of the Cb.
The response fields were viewed graphically as a dot-amplitude array as follows. All the diodes that imaged the tissue were strongly filtered to allow measurement of their peak amplitudes without latency information. The diode with the largest response amplitude was displayed on a hexagonal array as a dot filling the space occupied by that diode. The dot sizes of the remaining diodes were scaled smaller based on their amplitudes. To graphically display the orientation of the response field, a threshold was set at several SDs above the noise level, to identify an elliptical field. The axes of that ellipse were then plotted on the same dot-amplitude array. In some cases, the response fields were slightly curved or the response orientation was not exactly aligned with or orthogonal to the midline raphe. This may have been due to the unavoidable stretching of the tissue when pinned down to the chamber's floor.
A final format to display response fields uses NeuroPlex software to generate pseudocolor images as used in several figures in the following text. Those images were created with a minimal high-pass filter to remove nonphysiological baseline drifts for display purposes only. Also, a standard color threshold of 75% (as noted by the black line on the color scale) was established to remove noise so that the response field can be viewed as an overlay on the Cb image. The NeuroPlex system was also used to convert these 464 traces into pseudocolor movies as supplemental material.1 Each of the 464 diodes was sampled 1,600 times/s, whereas the optical responses would really last only tens of milliseconds. The resulting video files, using the standard mpeg video format of 30 frames/s, appear about 53 (1,600/30) times slower than the real events (see supplemental material). Responses in real-time pseudocolor movies would show an absorbance change only in a single frame (not shown).
RESULTS
Topographic changes of voltage-sensitive dye signals were recorded from the entire extent of the Cb with millisecond resolution in response to single microamp current pulses. Figure 2D shows an array of traces from the photodiodes that image a Cb placed ventricular side up in the chamber. Unlike Fig. 1, this and all remaining figures are displayed oriented with the caudal Cb on top, the cut peduncle on the bottom left corner, and peduncle attached to the brain stem in the bottom right corner (see low-magnification view in the initial frames of the movie “Sfig2-IO-response.mpg” of the supplemental material). In Fig. 2A, the tissue's mean light level reveals an outline of the Cb, indicating that most photodiodes collected light from the transilluminated tissue. Using the highlighted diode in Fig. 2A, Fig. 2B shows the time course of the absorbance changes for a typical trial. This trace exhibits clear transient depolarizations for each of four stimulating pulses presented to the IO (see stimulus trace below; 50 μA, 100 μs). Because this unfiltered signal was recorded with the equivalent of a very long time constant (∼20 s), both transient and sustained response components can be observed following each 100-μs pulse. Figure 2C shows the response to higher-frequency stimulation. These data demonstrate that the techniques are capable of recording sustained DC shifts in membrane potential, yet retain sufficient temporal resolution to capture transient events.
FIG. 2.

Analysis of cerebellar responses to IO microstimulation. A: the baseline resting light intensities (RLIs) of each diode are first measured for each preparation prior to stimulation, displayed here in grayscale. In this case, using a ×2 microscope objective, the cerebellum does not fill the field so its outline is apparent (same preparation as in Fig. 1). All subsequent recordings are divided by these RLIs, so that each diode's response is normalized to its relative absorbance, ΔA/A, to adjust for different amounts of staining within each tissue and among different preparations. Absorbance traces of each diode (ΔA/A measured for 155 ms) are displayed below in D. B: a single diode trace (from the diode outlined in A) that represents the standard raw data format (after temporal filtering) with responses to 4 current pulses (50 μA, 100 μs to the contralateral IO). C: as in B except showing responses to 26 current pulses at 12 Hz. These responses summate temporally. D: spatial display of white traces for diodes that imaged the cerebellum, superimposed on a monochrome image of the tissue (from Fig. 1B). Flat-gray lines represent diode positions in the array that did not image the cerebellum. Each trace is an average of 4 responses as shown in B. Some of the diodes have a noisier baseline because the ΔA/A computation uses a small value of RLI where the tissue was thicker. A curved line indicates the midline raphe. E: a mean absorbance trace of the single diode (n = 16) is shown on the same expanded timescale as F, the mean extracellular voltage traces (n = 20) recorded through the micropipette seen in Fig. 1B. Electrical responses to IO microstimulation often can exhibit oscillations suggestive of synchronized complex spikes. In contrast, optical responses have a longer time-to-peak.
Response topography
An example of the topography of Cb responses to IO microstimulation is shown in Fig. 2D. White traces show the average of four responses (as shown in Fig. 2B), overlaid on an image of the digital camera (as shown in Fig. 1B). The region of Cb responsiveness to IO microstimulation was clearly constrained to the cerebellar hemisphere that remained attached to the brain stem. Those Cb responses were best evoked by stimuli presented to the IO on the side contralateral to the attached peduncle. Even following IO microstimulation using higher currents, the activated region of the Cb never crossed the midline raphe of the cerebellum, although it expanded to activate much of the attached hemisphere (not shown).
The response latency and waveform of the optical signal (Fig. 2E) were compared with the averaged electrical trace recorded through a glass micropipette (Fig. 2F) inserted into the Cb at the same location imaged by the diode highlighted in Fig. 2A. Although the two measures of the response have a similar latency, the wider bandwidth of the micropipette recording reveals the characteristic oscillations that are reminiscent of the complex spikes recorded from Purkinje cells. These oscillations are not apparent in the optical recording.
To examine the topography of the Cb responses to IO microstimulation, the response amplitude of each diode was quantified, as displayed in the dot-amplitude array shown in Fig. 3A (see methods). In this case, the data used for Fig. 2 are replotted using a dot at each diode location with diameter proportional to the amplitude of the response. From a region of responsive diodes (shown in green) an ellipse was computer-fit to display the major axis (red) and minor axis (blue), as shown on a sketch of an average Cb–brain stem profile (Fig. 3A). The inset shows the same response from that IO microstimulation as a pseudocolor image made by Neuroplex software (equivalent to a frame from the pseudocolor movie “Sfig3-IO- response.mpg” of the supplemental material). Note that, in both displays, the major axis of the responsive region is parallel to the midline raphe (the vertical line bisecting the Cb profile).
FIG. 3.

Topography of cerebellar responses to IO microstimulation. A: graphical representation of amplitude responses of Fig. 2D, displayed as a dot-amplitude array having the dot diameter scaled to the peak relative absorbance change. These dots are displayed on a standard preparation drawing of a typical cerebellum and brain stem with cut peduncle and 8th cranial nerve (nVIII). A bipolar electrode stimulated the IO at the yellow dot in the 4th ventricle near the obex. Diodes are selected (green) if their response was ≳2SDs of the prestimulus baseline. A best-fit ellipse is computed for those selected diodes (major axis, red line; minor axis, blue line). B: the major ellipse axes of responses to IO stimuli are displayed as red lines on the standard preparation drawing. The lines were aligned with a common point of the rostral cerebellar midline (red dot), although the caudal end of the cerebellar midline (light blue circles) varied because the preparation size was not uniform. A ratio criterion for the major to minor axes of 2:1 was used to exclude a few circular data sets for which responses to IO microstimulation were too strong, thus filling the attached hemisphere. Note that the major axes are sagittal and lateral to the midline (vertical striped line).
Similar dot-amplitude analyses were generated from our sample of 28 responses to IO microstimulation, as summarized in Fig. 3B. The midline raphe of each Cb was aligned at the rostral boundary and the major axis of the responsive region of each experiment was displayed as a red line. Positions of these axis lines differed slightly from one another because the width and length of each tissue varied slightly. However, it is clear from the topography that IO microstimulation evoked its strongest response approximately 0.7 mm lateral to, but aligned with, the midline raphe. Notably, each of these responses extends fully in the rostrocaudal dimension of the entire Cb.
Because responses to IO microstimulation did not cross the midline, one may suspect that the unresponsive hemisphere may be damaged by cutting the peduncle on that side. The responsiveness of that hemisphere was tested using intracerebellar microstimulation. In the example shown in Fig. 4, the bipolar electrode tips were visually placed on the ventricular surface of the hemisphere opposite the attached peduncle of the turtle Cb (see “Sfig4-stim-image-thru-scope.jpg” in the supplemental material). Direct microstimulation of that surface, at the thin white matter (WM) layer, evoked strong responses (Fig. 4D) in the hemisphere that were unresponsive to IO microstimulation (Fig. 4A). Not only was that unattached hemisphere functional, but the response region was also sagittally oriented (Fig. 4D, red line) like the IO response (Fig. 4B, red line; also compare video files “Sfig6-IO.mpg” and “Sfig6-WM.mpg” in the supplemental material). Responses to WM were recorded in many Cb using different medial-to-lateral stimulus positions along the rostral aspect of the Cb. The resulting summary of the topography of responses is displayed in Fig. 4F. The major axis lines indicate that WM microstimulation results in responses that are sagittally oriented and reach the caudal edge of the Cb.
FIG. 4.

Topography of cerebellar responses depends on the stimulating location, using the same stimulus parameters (100 μA, 100-μs pulse) in the same preparation (C). Responses in A, D, and F are displayed as described for Fig. 2D. A: responses of the diode array to microstimulation of the IO, marked by a red dot in C. D: responses of the diode array to white matter (WM) microstimulation on the rostral ventricular surface of the hemisphere contralateral to the attached peduncle. Note that the shank of the stimulating electrode in C and its yellow outline in D and G display optical parallax due to the overlying cover glass. G: responses of the diode array to microstimulation of the molecular layer (ML) deep to the surface stimulation described for D. B, E, and H: using dot-amplitude arrays, whose diameters are scaled to the peak absorbance change, the topography of each response is displayed as its major (red) and minor (blue) elliptical axes. The responses spanned the full extent of the Cb. F and I: major ellipse axes (red) drawn on a standard preparation (as in Fig. 3B). The individual cerebella had variable lengths, as indicated by the position of the light blue circles on the midline raphe. The responses to WM stimuli (F, 14 experiments) were parasagittal but their medial–lateral position depended on the microstimulation site (blue dots). ML stimuli evoked transverse responses (I, 11 experiments) aligned with the rostral–caudal position of its microstimulation.
After recording responses to WM stimulation (Fig. 4D), the bipolar stimulating microelectrode was then advanced deep into the cortex toward the pial side. When the tips were well into the molecular layer (ML), microstimulation was applied. The response region that originated at the stimulating point was now oriented transversely and traveled in both directions (Fig. 4, G and H; also see video file “Sfig6-ML.mpg” in the supplemental material). Similar experiments of ML microstimulation were repeated at several positions in different Cb. The resulting summary of the topography of responses is displayed in Fig. 4I. The major axis lines are clearly oriented in the transverse plane. Their position depended on the rostrocaudal locus of microstimulation, although in all cases their transverse responses readily crossed the midline from either side and, in many cases, extended to the lateral edges of the tissue in both directions.
Stimulation depth
Stimulation at or near the two Cb surfaces evoked responses with very different spatial properties. Initial experiments of microstimulation of middle Cb layers indicated that responses contained both sagittal and transverse topographies. Because this thin flat tissue is secured by pins only on its edges, there may have been movement of the Cb during the penetration of the bipolar electrode into the tissue, making the accurate placement of the tips of the stimulating electrodes difficult in this preparation. A possibility was also considered that current was spreading radially along the electrode track. Therefore these experiments were repeated using larger turtles (carapace length, ≤30 cm) because the Cb was about 35% thicker in these animals (standard 15-cm carapace: 834 ± 114 μm; larger 30-cm carapace: 1,130 ± 121 μm). The bipolar stimulating electrode was advanced radially in 100-μm steps, from either the ventricular or the pial surface, to determine a depth that would neither evoke a sagittal or transverse response.
Figure 5 shows responses to microstimulation in the Cb of a large turtle. The left column shows pseudocolor response images when the ventricular surface faced up (Fig. 5A, top); the right column shows results from the same tissue when the pial surface faced up (Fig. 5B, top). (See magnified views of the electrode placement in supplemental material: “Sfig5A-WM-stim.jpg” and “Sfig5B-Pia-stim.jpg”.) The second row shows responses to bipolar microstimulation at or near the WM and was roughly oriented sagittally (parallel to the midline marked with a yellow line; Fig. 5A, WM, Fig. 5B, 700 μM below the pia). The third row shows small patch-like responses to stimuli in the granule cell layer (Fig. 5A, 400 μM below WM; Fig. 5B, 500 μM below the pia), using the same low current level that produced the larger responses from depths at the WM or ML. The bottom row shows responses to ML microstimulation (Fig. 5A, 600 μM below WM; Fig. 5B, Pia) that are oriented transversely (orthogonal to the midline, yellow line of second row). Six video files show these six responses in the supplemental material.
FIG. 5.

Depth analysis stimulating at 3 levels of a cerebellum of a 30-cm-long turtle. The top row shows low-magnification photographs of the preparation viewing the ventricular (A) and pial surface (B). Depth of stimulation (50 and 75 μA) was measured from the WM or pial surface, respectively. In the 2nd row, yellow lines represent the midline based on the raphe or estimated from blood vessel pattern, respectively. Responses shown in the 2nd row are to WM stimuli; in the 3rd row to granule cell layer stimuli; and in the bottom row to ML stimuli. Data for A recorded on the day of the surgery/staining; data for B recorded the next day. Pseudocolor images were generated with the same filter and threshold values. C: pseudocolor images as in middle row of A except granule cell layer stimulation reduced to 15 μA. The left image was processed as in A. The right image was processed with a threshold value of 37% (half that of the standard 75% of the left image, as noted by the black line on the color scale for each image). Grayscale latency arrays show latency computed for data represented in pseudocolor image to its left. The stimulation sites are indicated by red dots.
Although low currents were used to localize stimulation within single Cb layers, the patch-like patterns were not always circular. Therefore minimal currents were occasionally used to examine the shape of the responses evoked by the electrode tips that were estimated to be within the granule cell layer. Figure 5C shows an example of a response to very low current (15 μA) presented at the same depth that evoked the small patch-like response of Fig. 5A (75-μA pulses at 400 μM below WM). The left pseudocolor image of Fig. 5C, processed identically to that of Fig. 5A, shows a smaller patch-like response than that of Fig. 5A. However, the response to 15 μA was reanalyzed using a color threshold reduced by half (37 instead of 75%, right pseudocolor image of Fig. 5C; also see “Sfig5C-low-stim-low-threshold.mpg” in the supplemental material). The resulting image shows weak sagittal and transverse components, even in response to this lower stimulus current. In general, response fields to stimuli near the ventricular surface were oriented sagittally; those to stimuli near the pial surface were oriented transversely; and those to stimuli elsewhere within the Cb's depth exhibited a patch-like response as well as a mixture of weak sagittal and/or transverse fields.
Response timing
Because the Cb is thought to play a role in the timing of complex motor behaviors, the spatiotemporal dynamics of Cb responses were examined (Figs. 6 and 7). Each row of Fig. 6 shows a time sequence of the responses to IO, WM, or ML microstimulation as performed in Fig. 4, depicted here as a series of pseudocolor frames. (The full sequences are found in “Sfig6-IO.mpg”; “Sfig6-WM.mpg”; and “Sfig6-ML.mpg” in the supplemental material.) The left column displays the frame (0.625 ms) with the first indication of the response, which occurred at different latencies following stimulation. Each frame's latency is shown in the top left corner. The fastest response occurred following ML microstimulation (bottom row), with activity appearing at the locus of stimulation with negligible delay (“0” ms). The response to WM microstimulation was delayed by seven frames (4.38 ms) but also occurred near the tip position of the stimulating electrodes (middle row). Responses to IO microstimulation (top row) had the longest latency, appearing 15 frames (9.38 ms) after the first response frame of ML microstimulation. The larger delay in the response to IO microstimulation (relative to WM) is consistent with its stimulating point being many millimeters away in the brain stem.
FIG. 6.

Series of pseudocolor images showing the timing of the optical responses to IO, WM, and ML microstimulation. Data from the same experiment shown in Fig. 4, A, D, and G, respectively. Numbers indicate millisecond latency after the stimulating pulse.
FIG. 7.

Latency analysis of optical responses. A, D, and G: 3 rows of grayscale latency arrays show latency following IO, WM, and ML microstimulation, computed for data in the 3 rows A, D, and G of Fig. 4, respectively. See also pseudocolor images in Fig. 6. The microstimulation sites in D and G are indicated by dots. B, E, and H: latency–distance plots of data shown in A, D, and G, respectively. C, F, and I: lines of linear regression fits of B, E, H, and all other latency–distance plots in IO, WM, and ML samples, respectively. The inverse of the slope of the fits correspond to the velocity of the traveling response. Solid lines were statistically different from zero slope (P < 0.05). Dotted lines indicate fits that are statistically indistinguishable from a zero slope. Wide striped line indicates the mean slope for that sample.
Subsequent frames of Fig. 6 (columns 2, 3, and 4) depict activity recorded about 7, 18, and 50 ms after the frame shown in column 1. (See also the video files of Fig. 6 in supplemental material.) As shown, ML responses began at the tips of the microelectrode, and then traveled slowly away from the stimulating point in both directions until they reached the lateral edges of the Cb. In contrast, WM and IO response regions began later and then uniformly increased in strength within their response fields.
To quantify the temporal dynamics shown in Fig. 6, rise-time latencies of each diode within the response region were computed directly from selected diode traces sampled at 1.6 kHz and displayed as grayscale latency arrays in Fig. 7. White boxes depict zero-latency diodes; black boxes depict the longest-latency diodes. Only diodes in the response field were analyzed; the remaining diodes are indicated as small dots. For ML responses (Fig. 7G), the response diodes that had the shortest latencies (white or light gray boxes) were closest to the stimulating dot. The latency gradually increased with distance from that point while traveling along a transverse plane (e.g., increasing dark gray boxes). This finding is consistent with the activation of parallel fibers in the ML in the transverse plane. Similar analyses were performed that measured peak latencies, instead of rise-time latencies, but the conclusions are the same (see Fig. 8C in the following text).
FIG. 8.
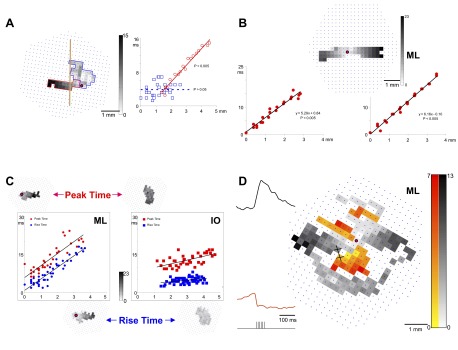
Examples of different spatial-timing analyses. A: the grayscale latency array on the left shows a mixed response to a mid-depth stimulation (700 μm below pia of Cb from a 15-cm-long turtle; same tissue as C but day 2), with a sagittal region outlined in black and a transverse region outlined in red. The vertical line is an estimate of the midline raphe because all examples in this figure came from experiments with the Cb placed pial side up. The latency–distance plot on the right shows the respective timing of the blue and red regions. B: the grayscale latency array shows bidirectional transverse responses to ML stimulation. Separate latency–distance plots were generated below for responses traveling from the stimulus point to the left and right. Both components of the response travel at a similar speed in each direction. C: comparison of responsive diode detection using wavelet analysis (blue, “rise time”) vs, maximal response amplitude (red, “peak time”). Separate latency–distance plots show data for ML microstimulation (left) and IO microstimulation (right). Insets above the plots show grayscale latency arrays when detecting peak time and insets below the plots show grayscale latency arrays when detecting the rise time. This result used the same tissue as A but from day 1. D: a modified grayscale latency array showing depolarizing diodes in shades of gray and hyperpolarizing diodes in shades of red. The top left inset has a depolarizing response trace from the gray diode marked with an “×”. The bottom left inset has a hyperpolarizing response trace from the marked red diode. The stimulus was a train of 6 pulses, as shown below the bottom left inset. The microstimulation site is indicated by a red dot.
In contrast to ML responses, each responsive diode following WM microstimulation had a short latency, irrespective of its position in its sagittal response region (see Fig. 7D). Uniform response latency along this flat tissue is unexpected because one assumes that there is a fixed conduction velocity for the sagittally oriented axons that conduct ≤6 mm. Yet the response latencies, although somewhat variable, did not vary with distance so were considered statistically synchronous. Like the WM responses, responses to IO microstimulation were also nearly synchronous, as shown in the grayscale latency array (Fig. 7A, corresponding to the traces in Fig. 4A, and top row of Fig. 6). Although Fig. 7, A, D, and G uses a common grayscale, the diodes of Fig. 7A were darker than those in Fig. 7D, indicating a longer mean latency. This may be expected because the conduction distance from the IO to the Cb is longer. However, the sagittal response field did not show any pattern of increasing latencies, indicating that the response field was statistically synchronous, like that of Fig. 7D.
To quantify the timing of IO, WM, and ML responses, the latencies shown in the grayscale latency arrays were plotted as a function of the distance from the stimulating position (WM and ML) or from the peduncle (IO; see Ariel 2005). The latency–distance plots for the data in the left column of Fig. 7 are displayed in the middle column of Fig. 7. Following ML microstimulation, latency gradually increased with distance traveled (Fig. 7H). In contrast, IO and WM latency–distance plots (Fig. 7, B and E) did not show a strong trend. These data were fit with least-square regression lines for our sample of 28 IO, 20 WM, and 28 ML microstimulations (Fig. 7, C, F, and I, respectively). Lines with slopes that were not significantly different from zero were replaced with a flat dotted line. None of the responses to ML microstimulation had nonzero slopes (Fig. 7I). In contrast, the WM and IO groups had many latency–distance fits whose slopes were not significantly different from zero. A statistical analysis of the slopes of these three groups by the one-way ANOVA method indicates that ML slopes are different from IO and WM responses (P < 0.01), although IO and WM slopes are not different from one another.
Means of the regression fits to the IO, WM, and ML latency–distance plots are shown as wide striped lines in Fig. 7, C, F, and I. From the slopes, one can estimate the conduction velocities of these responses from these data. The mean slope of the latency–distance plot for ML microstimulation was 4.1 s/m, indicating that parallel fibers conduct at 0.24 m/s. Given an average Cb width of 4.89 mm, the time difference of activation from one lateral edge to the other is 20 ms. Estimating response conduction velocities from the mean slopes for IO and WM microstimulation (0.69 and 0.49 s/m) is more inaccurate because many latency–distance slopes were statistically flat (11/28 and 8/20, respectively, for P = 0.05). Moreover, the fraction of flat slopes is dependent on the level of statistical significance required. For example, the IO and WM data sets would contain five and four additional flat lines, respectively, using P = 0.005, thereby lowering the mean slope by about 0.12 s/m. Based on these two P values, the range of time difference from rostral to caudal edges of an average Cb is 2.1–2.6 ms for IO responses and 1.5–1.9 ms for WM responses. When compared with the 20-ms time difference of ML responses between the lateral edges, the time differences of IO and WM responses are much smaller or, in many cases, statistically synchronous. Our interpretation of these data is that the responses to IO and WM stimulation can be considered synchronous across the Cb cortex.
The response onsets (y-intercepts of the regression fits of latency–distance plots) for the three stimulation conditions also exhibit statistically significant differences (P < 0.05) in Fig. 7, C, F, and I. Responses following IO microstimulation began 1.2 ms later than that of WM microstimulation. This difference may be due to the conduction delay made by the travel distance of several millimeters from the IO position in the brain stem (see Ariel 2005). Note also in turn that WM responses at zero distance from the bipolar stimulating electrode were 3.2 ms later than those of ML responses, suggesting that the different synaptic mechanisms mediate the two responses within the Cb.
The conclusion that WM and ML responses can be differentiated based on their synchrony and topography motivated the reexamination of nonspherical responses that were observed following mid-depth Cb stimulation in the granule cell layer of standard-length turtles. Such Cb response fields were complex, as displayed in Fig. 8A. The shape of the response field suggested to us that these data could be divided into two distinct regions for analysis, although some diodes near the point of stimulation may belong to both regions. The latencies of a clearly transverse region (outlined in red) were compared with those of the responsive diodes in a region that was oriented more sagittally (outlined in blue). The data in each region were plotted as blue squares and red circles on the same latency–distance plot and each data set was fitted with a least-squares linear regression. It is clear that the red line, corresponding to data from the transverse region, has a slope indicating a slowly conducting response, whereas the blue line of the sagittal region is statistically flat, indicating its response synchrony. The sagittal region exhibited a short-latency response (Fig. 8A, blue), presumably due to current spread to the WM. At the same time, the transverse response began to spread transversely (Fig. 8A, red), slowly increasing its latency much like an ML response. (See mixed response in video file “Sfig8A.mpg” in the supplemental material.)
Note that a similar approach can be used to interpret the patch-like data shown in Fig. 5A (middle row, 400 μM below WM). There, the response field to granule cell stimulation was not perfectly circular, so may be contaminated with sagittal and transverse signals. From the adjacent grayscale latency array, a component of the response forming a sagittal band is synchronous, whereas a different component forms a small transverse beam that increases its latency as it conducts slowly from the stimulating point. This phenomenon is also apparent in the grayscale latency array of Fig. 5C (right). The two topographic regions—sagittal and transverse—exhibited different latency profiles: synchronous and slowly conducting, respectively. This observation supports the conclusion from the topography that even low-intensity granule cell layer microstimulation for 30-cm turtle Cb may not evoke pure patch responses.
Figure 8B shows a grayscale latency array of the response to ML microstimulation close to the Cb midline. In this case, it was easy to subdivide the response into two regions for analysis: to the left and to the right of the stimulating point (Fig. 8B, red dot). From these regions, two latency–distance plots were generated and fit by a least-squares linear regression. The two regression lines had similar slopes (5.29 and 6.16 s/m), indicating that the conduction speed in each direction was equally slow (∼0.17 m/s). (See conduction in both directions in video files “Sfig8B.mpg” and “Sfig8B-ML-highpass-filter.mpg” in the supplemental material.)
We considered whether the technique used to measure the response timing might influence the response latency. Figure 8C compares the two approaches used in this study: a wavelet method that identifies the time of the maximal response onset slope (“rise time”) and an amplitude method that identifies the time of the maximal response amplitude (“peak time”). For these optical data, the latter method required more temporal filtering of the photodiode signals. In the same Cb, these two methods were compared for responses to ML and IO microstimulation (Fig. 8C; also see video files “Sfig8C-IO.mpg” and “Sfig8C-ML.mpg” in the supplemental material). The blue symbols indicate measurements using the wavelet method, whereas the red symbols represent data using the peak time method. Detection of the peak time obviously occurred after the time of response onset, but linear regression slopes of these two methods were very similar (Fig. 8C, black lines). The response fields, as indicated by the small grayscale latency arrays around the two plots, indicate that the topography of responses detected by each method is similar, although the peak time method selected fewer responsive diodes.
Occasionally, specific Cb regions decreased their light absorbance in response to ML microstimulation (especially to trains of pulses). These decreases indicate net membrane hyperpolarization in these Cb regions (plotted as red diodes on a modified grayscale latency array; Fig. 8D; see traces in “Sfig8D-colored-by-polarity.jpg” in the supplemental material). Two insets show the waveforms of two diode traces that are marked by × in the central array. The top diode exhibited a standard depolarizing waveform, whereas the lower diode responded with a hyperpolarization. The hyperpolarizing regions appear to straddle the depolarizing transverse beam and its onset latency differs from the depolarization region (note the gray and red scales differ; Fig. 8D). The hyperpolarization is visible in a pseudocolor scale without a color threshold (supplemental material: compare “Sfig8D-ML.mpg” with “Sfig8D-ML-no-threshold.mpg”).
DISCUSSION
Using in vitro optical recordings of voltage-sensitive activity of the entire turtle cerebellar cortex (Cb), robust responses were measured during cerebellar and brain stem stimulation. Topographically, the Cb exhibits clear orthogonal responses to microstimulation of its two surfaces: 1) transverse response fields to pia stimulation due to activation of the molecular layer (ML) of parallel fibers oriented transversely to PCs and 2) sagittal responses to the white matter (WM) stimuli, perhaps as a consequence of Cb afferents oriented sagittally along the ventricular surface of this flat cerebellar cortex. Similar to the WM response, microstimulation of the contralateral IO evoked its strongest response in a sagittal band of activation, centered about 0.7 mm from the midline. Temporal analysis demonstrated that either IO or WM microstimulation evoked Cb responses with a nearly simultaneous onset across a large area, whereas microstimulation of the ML evoked a slow wave traveling about 25 cm/s. These results support the view that the contralateral Cb responds synchronously to IO input. Moreover, the similarity of both timing and topography of IO- or WM-evoked responses suggests that WM responses are dominated by the climbing fibers within the white matter. Using this approach, the finer topography and neural processing of separate sensorimotor channels may be revealed in this simple unfoliated Cb.
Using the turtle as a model system to study olivocerebellar responses
The use of the reptilian brain for study of the cerebellum has been well established (Larsell 1932; Llinás et al. 1968). It has specific advantages in that its flat, thin profile makes a natural slice for whole-tissue optical recordings using voltage-sensitive absorbance dyes. Its thickness and PC density are quite uniform, except for a narrow lateral region distal to the peduncle (see Ariel et al. 2005). Climbing fiber input, from the IO, is readily stimulated (Ariel 2005; Straka and Dieringer 1992) near the obex where axons from the contralateral IO coalesce to form the dense bundle of olivocerebellar axons that travel together to the peduncle. A brief current pulse to this locus thereby evokes a synchronized climbing fiber input to the Cb.
In other species, there is evidence that IO normally provides a synchronous output arising from gap junctions observed there (Sotelo et al. 1974), which may mediate electrotonic coupling between IO neurons (Chorev et al. 2007; Devor and Yarom 2002; Leznik and Llinás 2005; Llinás et al. 1974; Long et al. 2002). Complex spike synchrony was observed in sagittally oriented groups of PCs but there was almost no cross-correlation of complex spikes of PCs oriented transversely (Sasaki et al. 1989). Synchrony of sagittally oriented cells was enhanced during motor behaviors (Welsh et al. 1995; Wylie et al. 1995), whereas perturbing IO activity disrupted rhythmic tongue movements (Placantonakis et al. 2004).
Synchrony has also been observed in conduction time measurements of complex spikes evoked by stimulating olivocerebellar axons near the IO (Sugihara et al. 1993). However, measurements of small conduction times and estimates of small conduction distances in highly foliated mammalian Cb resulted in disagreement as to whether the olivocerebellar conduction time is uniform (Aggelopulos et al. 1995; Baker and Edgley 2006a; also see rebuttal by Baker and Edgley 2006b and response by Lang et al. 2006). For example, Aggelopulos et al. (1995) presented latency–distance plots of complex spike responses to IO stimulation (see Fig. 3A of Aggelopulos et al. 1995) based on 285 extracellular recordings from three deeply anesthetized cats combined with anatomical estimates of conduction distance derived from histological sections from fixed brains. In spite of possible inaccuracies of these anatomical estimates in this large, highly foliated structure, the cat data can readily be compared with data from the flat turtle Cb (see Fig. 7C). In the present study, however, true synchronous responses were often independently observed in many individual turtle brains whose latency–distance plots were not statistically different from zero (i.e., exhibiting synchrony).
In our previous study (Ariel 2005), single-electrode recordings indicated that a mechanism exists within the Cb to compensate for differences in the conduction distance, resulting in nearly synchronous responses to IO microstimulation. Baker and Edgley (2006a) questioned the spatiotemporal measurements of those data based on the concern that population field potentials may have spread spatially across the tissue to confound the temporal accuracy. They also suggested that measuring peak latency is less temporally accurate than measuring onset latency. Furthermore, they questioned whether different populations of olivocerebellar axons were involved when different brain stem locations were stimulated.
These issues have been addressed in the present study. First, the responses of voltage-sensitive dyes are extremely local, with a spatial resolution limited only by the resolution of the diode array and light scattering by the tissue. In relation to measuring across 5 mm of Cb, light scattering is negligible because adjacent diodes were activated sequentially along the transverse plane of the Cb due to ML stimulation. Light scattering also did not dramatically change the response topography when the pia was up or down in the recording chamber. Second, the photodiode changes are recorded simultaneously and presented as a fractional change in dye absorption (−ΔA/A) so that the amplitude and timing of the recordings from each diode are directly comparable. From these multiple simultaneous recording sites, both onset and peak latency showed similar results (Fig. 8C). Finally, a single current pulse to the IO appeared to activate most, if not all, olivocerebellar inputs to the contralateral Cb, ensuring that a uniform set of Cb inputs was being activated. Having addressed the concerns of Baker and Edgley (2006a), the data presented earlier still show that olivocerebellar inputs arrive to the cerebellar PCs with nearly the same latency.
Assuming that there are synchronous responses among the neurons in the IO, it is still not known how olivocerebellar inputs synchronously arrive to the cerebellar PCs. In turtle, mechanisms that compensate for olivocerebellar conduction distance were shown to be localized within the Cb and not between the IO and the cerebellar peduncle (Ariel 2005). Distance compensation may require regional myelination, as suggested for axons between thalamus and cortex (Salami et al. 2003) and postnatal changes that augment the olivocerebellar synchrony observed in adult rats (Lang and Rosenbluth 2003).
Functional topography
RESPONSES TO IO STIMULATION ARE ORIENTED SAGITTALLY IN THE MEDIAL CONTRALATERAL HEMISPHERE.
A region about 0.7 mm from the midline was most excited by microstimulation of the IO contralateral to the only intact peduncle. Larger currents did activate much of the contralateral hemisphere, creating a response field that did not meet a twofold criterion of major:minor axis ratio set to evaluate the response orientation. Small single brief current pulses (10–100 μA) elicited optical signals with strong excitatory response fields that were oriented sagittally and never encroached on the midline raphe of the Cb. It is not known whether the lack of a strong response in the lateral Cb reflects a measurement bias of this technique or a meaningful biological difference in the tissue.
Similar near-threshold stimulations of WM in the in vitro guinea pig Cb would evoke optical signals limited to just part of a single folia (Rokni et al. 2007). An analysis of the major:minor axis ratio of those responses revealed differences in their response orientation. A subset of those guinea pig Cb responses was oriented sagittally, suggesting that those specific WM loci activated local bundles of climbing fibers, whereas other locations affected mossy fibers. In vivo rodent optical recordings using the neutral red dye also exhibited sagittal bands (100–300 μm wide) in response to either electrical stimulation of the vibrissae area of the ipsilateral face or directly in the contralateral IO (Chen et al. 1996; Hanson et al. 2000).
RESPONSES TO ML STIMULATION TRANSVERSES THE ENTIRE CB.
Parallel fibers are the primary axons in the ML and mainly terminate on the dendritic trees of PCs. Their axons are among the thinnest found in vertebrates (Wyatt et al. 2005). Conduction velocities of mammalian parallel fibers are 0.18–0.27 m/s, although their lengths are not proportional to brain size. In turtles, parallel fibers have a mean diameter of 0.64 ± 0.12 μm and have been observed to transverse nearly the entire Cb (Tolbert et al. 2004), forming roughly 100 synapses every millimeter. The optical responses following ML stimulation are consistent with continuous activation of the Cb along a narrow transverse beam from lateral edge to lateral edge. Their mean conduction velocity was 0.24 m/s, supporting the report that parallel fiber velocity is very conserved across species (Wyatt et al. 2005).
Hyperpolarizing responses were observed to ML stimulation, but only occasionally. Thus unlike the depolarizing responses in this preparation, inhibitory networks within the Cb may be more labile in the in vitro conditions of this preparation. Hyperpolarizing response fields are also described in the guinea pig Cb. Like turtle (Fig. 8D), they are also oriented in the transverse plane straddling the beam of excitation. Those mammalian inhibitory regions were also more short-lived than the excitatory response in that in vitro Cb preparation (Cohen and Yarom 2000a).
Observing inhibition while recording voltage may be difficult because the inhibition that uses a shunting mechanism (large conductance increases near the resting membrane potential) does not produce a large membrane voltage change even though there is a large synaptic current. Thus measuring inhibitory fields in Cb would require neuronal membrane that is tonically depolarized. That requirement would make it even more difficult to measure in this preparation than in mammals for two reasons. First, these experiments use the turtle, a cold-blooded vertebrate species with low metabolism and naturally low level of neural activity. Second, this preparation uses the turtle's adaptive ability to lower its metabolism even further to survive long dives and a dormant state in water under frozen ponds for many winter months. Recordings from a variety of turtle brain stem regions have demonstrated the very low tonic synaptic and spike activity in this in vitro preparation (Fan et al. 1993, 1997; Jones and Ariel 2008; Rosenberg and Ariel 1990). Responses in mammalian tissue are more active, even in vitro, so have exhibit more depolarized neuronal membranes on which inhibition can often be measured as a hyperpolarization (Cohen and Yarom 2000a).
Although hyperpolarizations were not commonly measured in these experiments, it is still likely that inhibition is present in turtle Cb (Midtgaard 1992a,b). Cb inhibitory fields were initially described electrophysiologically as two bands lateral to the excitatory parallel fiber beam (Eccles et al. 1966b), which are believed to limit the natural spread of those beams (Santamaria et al. 2007) and play a role in sharpening the response timing of PC responses (Mittmann et al. 2005). Optical recordings of transverse inhibitory bands indicate two distinct circuits in vitro (Cohen and Yarom 2000a), whereas in vivo recordings resulted in sagittal bands (Gao et al. 2006).
RESPONSES TO GRANULE CELL LAYER MICROSTIMULATION MAY EVOKE AN EXCITATORY PATCH.
The repeating modules of Cb each receive excitatory input from mossy fibers, which in turn stimulate granule cells (Walsh et al. 1972). Axons from granule cells ascend to the ML synapse with PCs during the ascent and bifurcate to form parallel fibers (Huang et al. 2006; Tolbert et al. 2004). Stimulating mossy fibers activates a local patch of PCs via ascending axons of granule cells (Bower and Devor 2003; Cohen and Yarom 1998; Rokni et al. 2007), as shown by correlated activity of granule cells and their overlying PCs (Lu et al. 2005). Similar patches of Cb activation were observed during tactile stimulation (Bower and Woolston 1983) in intact rats.
In the present study, microstimulation within the granule cell layer also activated limited circular regions, from a single diode up to a dozen diodes. It is not known whether optical signals of these patches are due to local activation of stained granule cells or transynaptic activation of their overlying PCs from the ascending granule cell axons. The evoked patches were often contaminated by weak responses that were oriented in either the transverse plane or the sagittal plane. Clearer patches were observed in larger animals that have a thicker Cb. This suggests that, when weakly oriented responses occurred, current spread from the granule cell layer to WM and ML axons also evoked synaptic activation of PCs.
What are these optical recordings measuring?
For optical recordings, light could be absorbed by dye anywhere along its radial path through the Cb. To identify the source of the absorbance signal, stained intact Cb was cut transversely into 1-mm-thick slices and subjected to optical recordings during microstimulation of different Cb layers (Brown and Ariel 2007). Visibly, those slices were stained throughout the layers, although the ML was darker than the granule cell layer. Optical response from those slices following focal ML stimulation exhibited slowly traveling excitatory waves emanating from the stimulus site and confined to ML, consistent with the transverse beams reported in this present study. ML responses are not due to parallel fiber depolarization because the optical signals were absent during substitution of Co2+ for Ca2+ in the media (Brown and Ariel 2007). Thus ML responses probably result from the local depolarization of PC dendritic membrane, as suggested by the report that simultaneous optical and intracellular recordings from turtle PCs exhibit a similar response shape (Lu et al. 2003).
The source of optical signals during WM stimulation is less clear. An optical response to antidromic PC activation would be immediate and brief because the dyes and photodiodes used in this optical technique have enough temporal resolution to resolve single action potentials. Nonetheless, WM responses were delayed and lasted tens of milliseconds. These WM responses were also not observed when synaptic transmission was blocked by Co2+ substitution (Brown and Ariel 2007). Both these findings suggest that WM responses reflect depolarization of postsynaptic membrane, either of granule cells activated by mossy fibers or of PCs activated by climbing fibers. The first option is inconsistent with guinea pig Cb optical recordings to WM stimulation in which patches attributed to mossy fibers occurred after very short latencies (Rokni et al. 2007). On the other hand, there are several lines of evidence that suggest that the source for WM responses is from PC membrane depolarization due to activation by climbing fibers. First, WM responses have a long-latency synchronous response similar to that of IO responses (Fig. 7). Also, the sagittal response topographies of WM and IO are similar (Figs. 3 and 4). Finally, similar studies in sagittal turtle Cb slices show that responses to WM microstimulation are observed in the PC and molecular layers caudal to the site of stimulation (Brown and Ariel 2007).
Optical signals originating in the ML may be measuring the PC postsynaptic membrane because that membrane's area is much larger than that of parallel fibers or ML interneurons. Another large source of ML membrane may be glial cells, which are now known to respond to ectopic vesicular glutamate release or spillover from climbing fiber synapses (Matsui and Jahr 2003, 2004). For neural membrane in the ML, the PC dendritic area is much larger than the PC soma area. Moreover, fast Na+ spikes in turtle PCs are generated only in the soma, whereas slow Ca2+ spikes occur throughout the dendrites (Hounsgaard and Midtgaard 1988). These regenerative Ca2+ spikes spread rapidly through the spiny dendrites, the proximal dendrites, and the cell body in response to climbing fiber stimulation (Chan et al. 1989). The same response spread was observed in optical recordings from single PC dendrites filled with a Ca2+-sensitive dye in a slice of guinea pig (Ross et al. 1990).
These optical responses may also be using different mechanisms following IO, WM, and ML stimulation. The pharmacology of turtle PCs indicates that slow excitatory postsynaptic potentials (EPSPs) evoked by ML stimulation were blocked by one glutamate receptor antagonist, whereas slow EPSPs evoked by climbing fibers persisted (Gabbiani et al. 1994; Larson-Prior and Slater 1989). The present study shows differences in onset latency: responses to ML stimuli were immediate, whereas responses to WM stimuli were significantly delayed. If this delayed response is mediated by climbing fibers onto PC dendrites, it may be mediated by slower metabotropic glutamate receptors and not by ionotropic receptors (Dzubay and Otis 2002). Alternatively, climbing fibers might cause a metabotropic glutamate receptor release of endocannabinoids that in turn mediate a decrease in γ-aminobutyric acid onto PCs (Duguid et al. 2007).
Delayed optical responses after WM and IO stimulation may also involve a coupled neuronal network that contributes to sagittal response synchronization. Electrical coupling between Purkinje cells has not been observed (Pakhotin and Verkhratsky 2005), even though Sotelo and Llinás (1972) first reported gap junctions in the molecular layer of Cb many years ago. Recently, however, physiological evidence indicates that electrical coupling synchronizes activity in ML interneurons (Mann-Metzer and Yarom 2000) and anatomical studies show that ML interneurons are restricted to single sagittal bands (Sillitoe et al. 2008). A sagittal interneuronal network may therefore contribute to a synchronization observed in WM and IO responses in this study.
In the present study, optical recording techniques have served as a useful tool to reveal the normal spatial and temporal features of responses of the entire Cb. However, to understand the underlying mechanisms of synchronous responses to IO stimulation, modification of the Cb network by selective drug application may reveal the underlying mechanisms of response timing in the cerebellar cortex.
GRANTS
This study was supported by National Institute of Neurological Disorders and Stroke Grant NS-46499.
Supplementary Material
Acknowledgments
We thank M. B. Johny for development of the software and M. S. Jones for comments on the manuscript.
The costs of publication of this article were defrayed in part by the payment of page charges. The article must therefore be hereby marked “advertisement” in accordance with 18 U.S.C. Section 1734 solely to indicate this fact.
Footnotes
The online version of this article contains supplemental data.
REFERENCES
- Aggelopulos et al. 1995.Aggelopulos N, Duke C, Edgley S. Non-uniform conduction time in the olivocerebellar pathway in the anaesthetized cat [Erratum in J Physiol 1995 Nov 1;488:841]. J Physiol 486: 763–768, 1995. [DOI] [PMC free article] [PubMed] [Google Scholar]
- Arata and Ito 2004.Arata A, Ito M. Purkinje cell functions in the in vitro cerebellum isolated from neonatal rats in a block with the pons and medulla. Neurosci Res 50: 361–367, 2004. [DOI] [PubMed] [Google Scholar]
- Ariel 2005.Ariel M Latencies of climbing fiber inputs to turtle cerebellar cortex. J Neurophysiol 93: 1042–1054, 2005. [DOI] [PubMed] [Google Scholar]
- Ariel and Fan 1993.Ariel M, Fan TX. Electrophysiological evidence for a bisynaptic retinocerebellar pathway. J Neurophysiol 69: 1323–1330, 1993. [DOI] [PubMed] [Google Scholar]
- Ariel et al. 2005.Ariel M, Ward KC, Tolbert DL. Anatomical study of Purkinje cells and other calbindin-immunoreactive cells within the turtle cerebellum. Soc Neurosci Abstr 29: 755.4, 2005.
- Baker et al. 2005.Baker BJ, Kosmidis EK, Vucinic D, Falk CX, Cohen LB, Djurisic M, Zecevic D. Imaging brain activity with voltage- and calcium-sensitive dyes. Cell Mol Neurobiol 25: 245–282, 2005. [DOI] [PMC free article] [PubMed] [Google Scholar]
- Baker and Edgley 2006a.Baker MR, Edgley SA. Non-uniform olivocerebellar conduction time in the vermis of the rat cerebellum. J Physiol 570: 501–506, 2006a. [DOI] [PMC free article] [PubMed] [Google Scholar]
- Baker and Edgley 2006b.Baker MR, Edgley SA. Reply from M. R. Baker and S. A. Edgley. J Physiol 573: 281–282, 2006b. [Google Scholar]
- Bantli 1972.Bantli H Multi-electrode analysis of field potentials in the turtle cerebellum: an electrophysiological method for monitoring continuous spatial parameters. Brain Res 44: 676–679, 1972. [DOI] [PubMed] [Google Scholar]
- Bantli 1974.Bantli H Analysis of difference between potentials evoked by climbing fibers in cerebellum of cat and turtle. J Neurophysiol 37: 573–593, 1974. [DOI] [PubMed] [Google Scholar]
- Bower and Devor 2003.Bower JM, Devor A. Mapping of the hemodynamic response in the cerebellum with intrinsic optical imaging: beams vs. patches. Soc Neurosci Abstr 27: 75.3, 2003.
- Bower and Woolston 1983.Bower JM, Woolston DC. Congruence of spatial organization of tactile projections to granule cell and Purkinje cell layers of cerebellar hemispheres of the albino rat: vertical organization of cerebellar cortex. J Neurophysiol 49: 745–766, 1983. [DOI] [PubMed] [Google Scholar]
- Brown and Ariel 2007.Brown ME, Ariel M. Voltage sensitive optical responses of thick cerebellar sagittal slices are asymmetric and synchronous. Soc Neurosci Abstr 31: 339.7, 2007.
- Chan et al. 1989.Chan CY, Hounsgaard J, Midtgaard J. Excitatory synaptic responses in turtle cerebellar Purkinje cells. J Physiol 409: 143–156, 1989. [DOI] [PMC free article] [PubMed] [Google Scholar]
- Chen et al. 1996.Chen G, Hanson CL, Ebner TJ. Functional parasagittal compartments in the rat cerebellar cortex: an in vivo optical imaging study using neutral red. J Neurophysiol 76: 4169–4174, 1996. [DOI] [PubMed] [Google Scholar]
- Chen et al. 1998.Chen G, Hanson CL, Ebner TJ. Optical responses evoked by cerebellar surface stimulation in vivo using neutral red. Neuroscience 84: 645–668, 1998. [DOI] [PubMed] [Google Scholar]
- Chorev et al. 2007.Chorev E, Yarom Y, Lampl I. Rhythmic episodes of subthreshold membrane potential oscillations in the rat inferior olive nuclei in vivo. J Neurosci 27: 5043–5052, 2007. [DOI] [PMC free article] [PubMed] [Google Scholar]
- Cohen and Yarom 1998.Cohen D, Yarom Y. Patches of synchronized activity in the cerebellar cortex evoked by mossy-fiber stimulation: questioning the role of parallel fibers. Proc Natl Acad Sci USA 95: 15032–15036, 1998. [DOI] [PMC free article] [PubMed] [Google Scholar]
- Cohen and Yarom 1999.Cohen D, Yarom Y. Optical measurements of synchronized activity in isolated mammalian cerebellum. Neuroscience 94: 859–866, 1999. [DOI] [PubMed] [Google Scholar]
- Cohen and Yarom 2000a.Cohen D, Yarom Y. Cerebellar on-beam and lateral inhibition: two functionally distinct circuits. J Neurophysiol 83: 1932–1940, 2000a. [DOI] [PubMed] [Google Scholar]
- Cohen and Yarom 2000b.Cohen D, Yarom Y. Unravelling cerebellar circuitry: an optical imaging study. Prog Brain Res 124: 107–114, 2000b. [DOI] [PubMed] [Google Scholar]
- Devor and Yarom 2002.Devor A, Yarom Y. Electrotonic coupling in the inferior olivary nucleus revealed by simultaneous double patch recordings. J Neurophysiol 87: 3048–3058, 2002. [DOI] [PubMed] [Google Scholar]
- Dow 1942.Dow RS The evolution and anatomy of the cerebellum. Biol Rev 17: 179–220, 1942. [Google Scholar]
- Duguid et al. 2007.Duguid IC, Pankratov Y, Moss GWJ, Smart TG. Somatodendritic release of glutamate regulates synaptic inhibition in cerebellar Purkinje cells via autocrine mGluR1 activation. J Neurosci 27: 12464–12474, 2007. [DOI] [PMC free article] [PubMed] [Google Scholar]
- Dzubay and Otis 2002.Dzubay JA, Otis TS. Climbing fiber activation of metabotropic glutamate receptors on cerebellar Purkinje neurons. Neuron 36: 1159–1167, 2002. [DOI] [PubMed] [Google Scholar]
- Ebner and Chen 1995.Ebner TJ, Chen G. Use of voltage sensitive dyes and optical recordings in the central nervous system. Prog Neurobiol 46: 463–506, 1995. [DOI] [PubMed] [Google Scholar]
- Eccles et al. 1966a.Eccles JC, Llinás R, Sasaki K. The excitatory synaptic action of climbing fibres on the Purkinje cells of the cerebellum. J Physiol 182: 268–296, 1966a. [DOI] [PMC free article] [PubMed] [Google Scholar]
- Eccles et al. 1966b.Eccles JC, Llinás R, Sasaki K. Parallel fibre stimulation and the responses induced thereby in the Purkinje cells of the cerebellum. Exp Brain Res 1: 17–39, 1966b. [DOI] [PubMed] [Google Scholar]
- Fan et al. 1993.Fan TX, Rosenberg AF, Ariel M. Visual-response properties of units in the turtle cerebellar granular layer in vitro. J Neurophysiol 69: 1314–1322, 1993. [DOI] [PubMed] [Google Scholar]
- Fan et al. 1997.Fan TX, Scudder C, Ariel M. Neuronal responses to turtle head rotation in vitro. J Neurobiol 33: 99–117, 1997. [PubMed] [Google Scholar]
- Fukuda et al. 2001.Fukuda M, Yamamoto T, Llinás R. The isochronic band hypothesis and climbing fibre regulation of motricity: an experimental study. Eur J Neurosci 13: 315–326, 2001. [DOI] [PubMed] [Google Scholar]
- Gabbiani et al. 1994.Gabbiani F, Midtgaard J, Knöpfel T. Synaptic integration in a model of cerebellar granule cells [Erratum in J Neurophysiol 1996 Jun;75(6):followi.]. J Neurophysiol 72: 999–1009, 1994. [DOI] [PubMed] [Google Scholar]
- Gao et al. 2006.Gao W, Chen G, Reinert KC, Ebner TJ. Cerebellar cortical molecular layer inhibition is organized in parasagittal zones. J Neurosci 26: 8377–8387, 2006. [DOI] [PMC free article] [PubMed] [Google Scholar]
- Hanson et al. 2000.Hanson CL, Chen G, Ebner TJ. Role of climbing fibers in determining the spatial patterns of activation in the cerebellar cortex to peripheral stimulation: an optical imaging study. Neuroscience 96: 317–331, 2000. [DOI] [PubMed] [Google Scholar]
- Hounsgaard and Midtgaard 1988.Hounsgaard J, Midtgaard J. Intrinsic determinants of firing pattern in Purkinje cells of the turtle cerebellum in vitro. J Physiol 402: 731–749, 1988. [DOI] [PMC free article] [PubMed] [Google Scholar]
- Huang et al. 2006.Huang CM, Wang L, Huang RH. Cerebellar granule cell: ascending axon and parallel fiber. Eur J Neurosci 23: 1731–1737, 2006. [DOI] [PubMed] [Google Scholar]
- Isope and Barbour 2002.Isope P, Barbour B. Properties of unitary granule cell → Purkinje cell synapses in adult rat cerebellar slices. J Neurosci 22: 9668–9678, 2002. [DOI] [PMC free article] [PubMed] [Google Scholar]
- Jones and Ariel 2008.Jones MS, Ariel M. Morphology, intrinsic membrane properties, and rotation-evoked responses of trochlear motoneurons in the turtle. J Neurophysiol 99: 1187–1200, 2008. [DOI] [PubMed] [Google Scholar]
- Kim et al. 1989.Kim JH, Dunn MB, Hua Y, Rydberg J, Yae H, Elias SA, Ebner TJ. Imaging of cerebellar surface activation in vivo using voltage sensitive dyes. Neuroscience 31: 613–623, 1989. [DOI] [PubMed] [Google Scholar]
- Kistler et al. 2000.Kistler WM, van Hemmen JL, De Zeeuw CI. Time window control: a model for cerebellar function based on synchronization, reverberation, and time slicing. Prog Brain Res 124: 275–297, 2000. [DOI] [PubMed] [Google Scholar]
- Kitazawa and Wolpert 2005.Kitazawa S, Wolpert DM. Rhythmicity, randomness and synchrony in climbing fiber signals. Trends Neurosci 28: 611–619, 2005. [DOI] [PubMed] [Google Scholar]
- Konnerth et al. 1987.Konnerth A, Obaid A, Salzberg B. Optical recording of electrical activity from parallel fibres and other cell types in skate cerebellar slices in vitro. J Physiol 393: 681–702, 1987. [DOI] [PMC free article] [PubMed] [Google Scholar]
- Lang et al. 2006.Lang EJ, Llinás R, Sugihara I. Isochrony in the olivocerebellar system underlies complex spike synchrony. J Physiol 573: 277–279, 2006. [DOI] [PMC free article] [PubMed] [Google Scholar]
- Lang and Rosenbluth 2003.Lang EJ, Rosenbluth J. Role of myelination in the development of a uniform olivocerebellar conduction time. J Neurophysiol 89: 2259–2270, 2003. [DOI] [PubMed] [Google Scholar]
- Larsell 1932.Larsell O The cerebellum of reptiles: chelonians and alligator. J Comp Neurol 41: 59–94, 1932. [Google Scholar]
- Larsell 1967.Larsell O The Comparative Anatomy and Histology of the Cerebellum from Myxinoids through Birds. Minneapolis, MN: Univ. of Minnesota Press, 1967, p. 175–195.
- Larson-Prior and Slater 1989.Larson-Prior LJ, Slater NT. Excitatory amino acid receptors mediate slow synaptic transmission in turtle cerebellum. Neurosci Lett 104: 286–291, 1989. [DOI] [PubMed] [Google Scholar]
- Leznik and Llinás 2005.Leznik E, Llinás R. Role of gap junctions in synchronized neuronal oscillations in the inferior olive. J Neurophysiol 94: 2447–2456, 2005. [DOI] [PubMed] [Google Scholar]
- Llinás et al. 1974.Llinás R, Baker R, Sotelo C. Electrotonic coupling between neurons in cat inferior olive. J Neurophysiol 37: 560–571, 1974. [DOI] [PubMed] [Google Scholar]
- Llinás et al. 1968.Llinás R, Nicholson C, Freeman J, Hillman D. Dendritic spikes and their inhibition in alligator Purkinje cells. Science 160: 1132–1135, 1968. [DOI] [PubMed] [Google Scholar]
- Long et al. 2002.Long MA, Deans MR, Paul DL, Connors BW. Rhythmicity without synchrony in the electrically uncoupled inferior olive. J Neurosci 22: 10898–10905, 2002. [DOI] [PMC free article] [PubMed] [Google Scholar]
- Lu et al. 2005.Lu H, Hartmann MJ, Bower JM. Correlations between Purkinje cell single-unit activity and simultaneously recorded field potentials in the immediately underlying granule cell layer. J Neurophysiol 94: 1849–1860, 2005. [DOI] [PubMed] [Google Scholar]
- Lu et al. 2003.Lu H, Robbins KA, Bower JM, Senseman DM. Concurrent VSD imaging and intracellular microelectrode recording from turtle cerebellum: contribution of Purkinje cells to VSD signal. Soc Neurosci Abstr 27: 75.2, 2003.
- Mann-Metzer and Yarom 2000.Mann-Metzer P, Yarom Y. Electrotonic coupling synchronizes interneuron activity in the cerebellar cortex. Prog Brain Res 124: 115–122, 2000. [DOI] [PubMed] [Google Scholar]
- Matsui and Jahr 2003.Matsui K, Jahr CE. Ectopic release of synaptic vesicles. Neuron 40: 1173–1183, 2003. [DOI] [PubMed] [Google Scholar]
- Matsui and Jahr 2004.Matsui K, Jahr CE. Differential control of synaptic and ectopic vesicular release of glutamate. J Neurosci 24: 8932–8939, 2004. [DOI] [PMC free article] [PubMed] [Google Scholar]
- Midtgaard 1992a.Midtgaard J Membrane properties and synaptic responses of Golgi cells and stellate cells in the turtle cerebellum in vitro. J Physiol 457: 329–354, 1992a. [DOI] [PMC free article] [PubMed] [Google Scholar]
- Midtgaard 1992b.Midtgaard J Stellate cell inhibition of Purkinje cells in the turtle cerebellum in vitro. J Physiol 457: 355–367, 1992b. [DOI] [PMC free article] [PubMed] [Google Scholar]
- Mittmann et al. 2005.Mittmann W, Koch U, Hausser M. Feed-forward inhibition shapes the spike output of cerebellar Purkinje cells. J Physiol 563: 369–378, 2005. [DOI] [PMC free article] [PubMed] [Google Scholar]
- Pakhotin and Verkhratsky 2005.Pakhotin P, Verkhratsky A. Electrical synapses between Bergmann glial cells and Purkinje neurones in rat cerebellar slices. Mol Cell Neurosci 28: 79–84, 2005. [DOI] [PubMed] [Google Scholar]
- Placantonakis et al. 2004.Placantonakis DG, Bukovsky AA, Zeng XH, Kiem H-P, Welsh JP. Fundamental role of inferior olive connexin 36 in muscle coherence during tremor. Proc Natl Acad Sci USA 101: 7164–7169, 2004. [DOI] [PMC free article] [PubMed] [Google Scholar]
- Reinert et al. 2004.Reinert KC, Dunbar RL, Gao W, Chen G, Ebner TJ. Flavoprotein autofluorescence imaging of neuronal activation in the cerebellar cortex in vivo. J Neurophysiol 92: 199–211, 2004. [DOI] [PubMed] [Google Scholar]
- Rokni et al. 2007.Rokni D, Llinás R, Yarom Y. Stars and stripes in the cerebellar cortex: a voltage sensitive dye study. Front Syst Neurosci 1: 1–9, 2007. [DOI] [PMC free article] [PubMed] [Google Scholar]
- Rosenberg and Ariel 1990.Rosenberg AF, Ariel M. Visual-response properties of neurons in turtle basal optic nucleus in vitro. J Neurophysiol 63: 1033–1045, 1990. [DOI] [PubMed] [Google Scholar]
- Ross et al. 1990.Ross WN, Lasser-Ross N, Werman R. Spatial and temporal analysis of calcium-dependent electrical activity in guinea pig Purkinje cell dendrites. Proc R Soc Lond B Biol Sci 240: 173–185, 1990. [DOI] [PubMed] [Google Scholar]
- Salami et al. 2003.Salami M, Itami C, Tsumoto T, Kimura F. Change of conduction velocity by regional myelination yields constant latency irrespective of distance between thalamus and cortex. Proc Natl Acad Sci USA 100: 6174–6179, 2003. [DOI] [PMC free article] [PubMed] [Google Scholar]
- Salzberg et al. 1977.Salzberg BM, Grinvald A, Cohen LB, Davila HV, Ross WN. Optical recording of neuronal activity in an invertebrate central nervous system: simultaneous monitoring of several neurons. J Neurophysiol 40: 1281–1291, 1977. [DOI] [PubMed] [Google Scholar]
- Santamaria et al. 2007.Santamaria F, Tripp PG, Bower J. Feed-forward inhibition controls the spread of granule cell induced Purkinje cell activity in the cerebellar cortex. J Neurophysiol 97: 248–263, 2007. [DOI] [PubMed] [Google Scholar]
- Sasaki et al. 1989.Sasaki K, Bower JM, Llinás R. Multiple Purkinje cell recording in rodent cerebellar cortex. Eur J Neurosci 1: 571–586, 1989. [DOI] [PubMed] [Google Scholar]
- Sillitoe et al. 2008.Sillitoe RV, Chung S-H, Fritschy J-M, Hoy M, Hawkes R. Golgi cell dendrites are restricted by Purkinje cell stripe boundaries in the adult mouse cerebellar cortex. J Neurosci 28: 2820–2826, 2008. [DOI] [PMC free article] [PubMed] [Google Scholar]
- Sotelo and Llinás 1972.Sotelo C, Llinás R. Specialized membrane junctions between neurons in the vertebrate cerebellar cortex. J Cell Biol 53: 271–289, 1972. [DOI] [PMC free article] [PubMed] [Google Scholar]
- Sotelo et al. 1974.Sotelo C, Llinás R, Baker R. Structural study of inferior olivary nucleus of the cat: morphological correlates of electrotonic coupling. J Neurophysiol 37: 541–559, 1974. [DOI] [PubMed] [Google Scholar]
- Straka and Dieringer 1992.Straka H, Dieringer N. Chemical identification and morphological characterization of the inferior olive in the frog. Neurosci Lett 140: 67–70, 1992. [DOI] [PubMed] [Google Scholar]
- Sugihara et al. 1993.Sugihara I, Lang EJ, Llinás R. Uniform olivocerebellar conduction time underlies Purkinje cell complex spike synchronicity in the rat cerebellum. J Physiol 470: 243–271, 1993. [DOI] [PMC free article] [PubMed] [Google Scholar]
- Tolbert et al. 2004.Tolbert DL, Conoyer B, Ariel M. Quantitative analysis of granule cell axons and climbing fiber afferents in the turtle cerebellar cortex. Anat Embryol 209: 49–58, 2004. [DOI] [PMC free article] [PubMed] [Google Scholar]
- Walsh et al. 1972.Walsh JV, Houk JC, Atluri RL, Mugnaini E. Synaptic transmission at single glomeruli in the turtle cerebellum. Science 178: 881–883, 1972. [DOI] [PubMed] [Google Scholar]
- Welsh et al. 1995.Welsh JP, Lang EJ, Suglhara I, Llinás R. Dynamic organization of motor control within the olivocerebellar system. Nature 374: 453–457, 1995. [DOI] [PubMed] [Google Scholar]
- Wu et al. 1998.Wu JY, Lam YW, Falk CX, Cohen LB, Fang J, Loew L, Prechtl JC, Kleinfeld D, Tsau Y. Voltage-sensitive dyes for monitoring multineuronal activity in the intact central nervous system. Histochem J 30: 169–187, 1998. [DOI] [PubMed] [Google Scholar]
- Wyatt et al. 2005.Wyatt KD, Tanapat P, Wang SS-H. Speed limits in the cerebellum: constraints from myelinated and unmyelinated parallel fibers. Eur J Neurosci 21: 2285–2290, 2005. [DOI] [PMC free article] [PubMed] [Google Scholar]
- Wylie et al. 1995.Wylie DR, De Zeeuw CI, Simpson JI. Temporal relations of the complex spike activity of Purkinje cell pairs in the vestibulocerebellum of rabbits. J Neurosci 15: 2875–2887, 1995. [DOI] [PMC free article] [PubMed] [Google Scholar]
- Xu et al. 2006.Xu D, Liu T, Ashe J, Bushara KO. Role of the olivo-cerebellar system in timing. J Neurosci 26: 5990–5995, 2006. [DOI] [PMC free article] [PubMed] [Google Scholar]
- Yarom and Cohen 2002.Yarom Y, Cohen D. The olivocerebellar system as a generator of temporal patterns. Ann NY Acad Sci 978: 122–134, 2002. [DOI] [PubMed] [Google Scholar]
Associated Data
This section collects any data citations, data availability statements, or supplementary materials included in this article.