

Abstract
Study Objectives:
Obstructive sleep apnea (OSA) is associated with cognitive impairments in working memory (WM). Neuronal activation during WM tasks can be indirectly assessed by blood oxygen level-dependent functional magnetic resonance imaging (BOLD-fMRI). The purpose of this study was to describe BOLD-fMRI responses during 2 separate working memory tasks and a finger tapping task in men with OSA. A secondary aim was to explore the possible relation between OSA severity (apnea/hypopnea index) and BOLD-fMRI signal patterns.
Methods:
Nine treatment-naïve men (mean age [± SD] of 45.7 [± 6.6] years) with OSA underwent BOLD fMRI testing on a research-dedicated university-based MRI scanner. During BOLD-fMRI subjects performed a Paced Auditory Serial Addition task (PASAT), an auditory N-Back task (2-BACK) task, and an alternating finger tapping.
Results:
PASAT and 2-BACK tasks produced similar patterns of increased bilateral activation in posterior parietal, prefrontal and cerebellar regions. BOLD signal deactivations were observed within posterior cingulate, retrosplenial and inferior frontal regions during PASAT and 2-BACK, but not during tapping. With increased disease severity, BOLD activation patterns were increased in the right parietal lobe, but decreased in the cerebellar vermis.
Conclusions:
These preliminary findings suggest that the severity of OSA may correlate with neural activation during tasks of working memory, potentially reflecting compensatory neural responses in severe disease.
Citation:
Archbold KH; Borghesani PR; Mahurin RK; Kapur VK; Landis CA. Neural activation patterns during working memory tasks and osa disease severity: preliminary findings. J Clin Sleep Med 2009;5(1):21–27.
Keywords: fMRI, obstructive sleep apnea, working memory
Sleep disordered breathing (SDB) encompasses a spectrum of disorders that are defined by difficulty breathing and sleeping at the same time.1 Obstructive sleep apnea (OSA) is the most common type of SDB and is characterized by intermittent partial (hypopnea) or complete collapse (apnea) of the upper airway during sleep. From a clinical perspective, the long-term effects of intermittent hypoxemia, which is associated with the severity of OSA, on cortical function are unclear. In some studies, OSA has been associated with impaired working memory (WM),1,2 a limited capacity system that facilitates the maintenance and subsequent manipulation of perceptual information “online” to inform and guide behavior.3 A better understanding of the brain's response to cognitive challenge in OSA patients would contribute to our understanding of whether OSA affects the brain and may clarify the importance, from a neuronal perspective, of treating OSA. Furthermore, neuroimaging could potentially be used to assess the severity of OSA related cerebral dysfunction and monitor cortical response to treatment.
Evidence from neuroimaging studies suggests that cortical volume loss4–6 and metabolic damage7,8 in brain regions that support cognitive processes including WM9 may contribute to impaired cognition in patients with OSA. Specifically, volume loss in the cerebellar, prefrontal and posterior parietal cortices has been observed,4–6 while the presence of metabolites associated with neuronal loss have been noted in the parietal-occipital cortex in OSA patients.7,8 Together or independently these abnormalities could negatively impact WM in OSA.
Two tasks used to study neuronal activation via blood-oxygen level dependant (BOLD) functional magnetic resonance imaging (fMRI) are the N-Back10 and the Paced Auditory Serial Addition Task (PASAT).11 Both the N-Back and PASAT tasks challenge WM and attention while the PASAT adds an additional cognitive component, mathematical manipulation,10,11 and thus could induce different, perhaps greater, BOLD responses than the N-Back task. In healthy individuals the N-Back task has been associated with increased BOLD signal in the dorsolateral and inferior prefrontal, supplementary motor, premotor and parietal cortices,9 while the PASAT task has been associated with increased BOLD signal in the inferior, anterior and middle frontal cortex, the superior parietal lobule, insula, basal ganglia and lobules VI and VII of cerebellar cortex.12 Increased BOLD signal is thought to reflect increased neuronal activity and metabolic demand in a given brain area that is “active” during a particular cognitive task13 and as WM “load” (i.e., task difficulty) increases, so does BOLD signal in these brain areas.9,13
Despite the common observation of cognitive impairments in OSA1,2 there are relatively few reports describing cortical activation during tests of cognition in patients with OSA.14,15 In a recent fMRI study of WM in patients with OSA reduced BOLD signal changes, as compared to normal controls, were found in areas associated with WM during the performance of an N-Back task.15 In a separate study, Ayalon and colleagues14 reported an increase in BOLD signal intensity during a verbal learning task in OSA. Although these results are seemingly contradictory, they can be explained as reflecting compensatory activation during verbal learning, thought to be largely preserved in OSA, and deficient neuronal activation during working memory, which is thought to be impaired in OSA.16
The purpose of this study was to describe and quantify BOLD signal activation and deactivation patterns in OSA during 2 separate tests of working memory and a control task of alternate finger tapping. Two specific aims were (1) to compare BOLD signal activation and deactivation patterns between 2 WM tests and a finger tapping task, and (2) to explore relations between BOLD signal activation and OSA severity as measured by apnea hypopnea index (AHI).
METHODS
Participants
Eleven subjects with OSA were initially enrolled in the study. Two pre-CPAP data sets were discarded secondary to uncorrectable scanner artifact. This report provides results from 9 treatment-naïve, right-handed men (8 Caucasian and 1 African American) with OSA studied prior to the initiation of CPAP. Potential subjects with a suspected diagnosis of OSA were referred to the study by the nurse practitioner or board-certified sleep physician at a University-based Clinical Sleep Center and assessed for eligibility. Inclusion criteria were body weight < 300 pounds, witnessed apneic episodes during sleep, chronic snoring, and Epworth Sleepiness Scale scores of > 11. Exclusion criteria included claustrophobia, girth > 55 cm, weight > 300 pounds, a chronic neurological disorder, chronic renal failure, hypertension, diabetes, rheumatoid arthritis, or other chronic inflammatory condition. Additional exclusion criteria were self-reported current or past psychiatric diagnosis, psychoactive medication use and metal implants that would interfere with MRI testing procedures. Weight and height were obtained in pounds and inches on the same calibrated beam scale in the laboratory and BMI was calculated with the formula: weight (lb) / [height (in)]2 × 703.
General Procedures
Subjects arrived at the imaging facility between 08:00 and 09:00, signed an IRB-approved informed consent, and were oriented to the MRI environment. All MRI sessions were scheduled to start before 10:00 to control for potential circadian rhythm effects in brain signal strength. Prior to the MRI scan, subjects completed a 10-min cognitive test training session to insure that their performance on the cognitive tests was ≥ 80% correct.
Immediately before and after the scanning session, subjects completed a Stanford Sleepiness Scale (SSS).17 During the 50-min scanning session, subjects performed three separate auditory tasks, an N-Back task,10 a PASAT,11 and an alternate finger tapping task. After a 30-minute break, subjects completed a third SSS, the Epworth Sleepiness Scale (ESS), and the Wechsler Abbreviated Scale of Intelligence (WASI). Subjects' body weight and height were measured with a calibrated beam scale on the day of imaging.
Subjective Sleepiness
The Stanford Sleepiness Scale (SSS)17 is a self-administered questionnaire with 8 statements that describe levels of alertness from “1 = feeling active and vital; alert; wide awake” to “7 = almost in reverie; sleep onset soon; lost struggle to stay awake.” The SSS is a time-sensitive prospective measure of sleepiness and considered valid in the context of performance on mental tasks.17 The Epworth Sleepiness Scale (ESS)18 is a self-administered questionnaire that contains 8 separate situations and subjects rate each situation from “0 = no chance of falling asleep” to “3 = high likelihood of falling asleep.” Ratings are summed to yield a total ESS score; a score > 10 has been shown to distinguish good sleepers from those with pathological daytime sleepiness at a score of ≥ 10.19 Given that the SSS and ESS instruments measure levels of sleepiness in different time frames, both measures were used. The SSS was administered to measure current levels of sleepiness immediately before and after the fMRI study. The ESS was administered to assess base-line/chronic self-reported levels of global sleepiness encompassing the weeks prior to fMRI and intelligence testing.
Intelligence Testing
The Wechsler Abbreviated Scale of Intelligence (WASI) is a standardized intelligence test with 4 subscales; 2 verbal (Vocabulary and Similarities) and 2 non-verbal (Block Design and Matrix Reasoning) subscales which comprise the Full Scale Intelligence Quotient (IQ) score. The WASI has good reliability and validity among subjects aged 6 to 89 years. Administration time ranges from 20-40 minutes, depending on the ability of the subject.20 The WASI was administered based on previous reports that showed a significant relationship between high levels of nonverbal intelligence and increased levels of cortical activity during WM tests.21
Polysomnography
All participants underwent standard clinical diagnostic polysomnography (PSG) conducted within a 2-week period after the fMRI testing session. The PSG recordings of sleep state parameters (4-lead electroencephalogram [EEG], bilateral electro-oculogram, and submental and bilateral leg electromyogram), airflow (nasal pressure transducer and oral thermistor) and respiratory movements (thoracic and abdominal excursion by strain gauge), oximetry, and electrocardiogram were obtained on a computer data acquisition system (Sandman, v 7.01, Nellcor Puritan Bennett [Melville] Ltd., Kanata, ON). All PSG recordings were manually scored by trained technicians and reviewed by an AASM board certified sleep physician. Sleep stages were scored according to the standard criteria.22 Arousals were identified according to published recommendations23 and expressed as an index per hour of total sleep time. An apnea was defined as a ≥ 75% decrease in airflow lasting ≥ 10 sec. A hypopnea was defined as a 50% to 75% reduction in airflow lasting ≥ 10 sec. Scoring of these respiratory events did not require the presence of oxygen desaturation or an EEG arousal.24 Apnea hypopnea index (AHI) was calculated based on the average number of apneas and hypopneas per hour of total sleep time.
FMRI Protocol
FMRI Data Acquisition
All subjects were scanned on a General Electric 1.5 Tesla Signa Horizon scanner at the University of Washington Health Sciences Center. A 20-slice axial anatomical scan (TR/TE 200/2.2 ms, 7 mm thick slices) was collected and used for standard space registration. An echo-planar imaging/BOLD (EPI/BOLD) sequence with a TR/TE of 3000/50 msec and 90 degree flip angle was used for BOLD-fMRI. Each individual cognitive paradigm was 312 seconds long comprising of 104 volumes of 20 axial slices (7 mm thick) with no gap and a final resolution of 3.75 × 3.75 × 6 mm (64 × 64 × 20 image matrix).
Each subject completed the 3 auditory tasks in the same order (i.e., N-Back, PASAT, tapping). All tasks employed a box-car design. For each task, 30-sec of the “active” task was alternated with a 30-sec of the “baseline” control condition for a total of 10 blocks and thus a total scan acquisition time of 5 min and 12 sec. The first 12 sec of each scan with the subject lying quietly were not analyzed to allow for homeostatic adaptation to the scanner environment and magnetic scanner calibration. Subjects were inside of the bore of the magnet for approximately 50 min overall while the testing protocol was completed.
Tasks
Subjects performed an auditory N-Back task that consisted of a WM component (2-back) and a control component (0-back). During the 2-back component of the task, subjects were required to push a button when they heard a letter that was the same as the one presented two stimuli previously (i.e. M-Q-M, not M-Q-L-M). Letters were presented every 3 seconds. The control task (0-Back portion) consisted of pressing the button each time the letter “X” was presented in the series of numbers. During the modified auditory PASAT, a series of single digits ranging between 1 and 9 were presented at a rate of 1 digit per second. The subject was instructed to press a response button whenever 2 consecutive digits summed to the number 10, but to not respond at any other time. The control task consisted of pressing the button each time the number “7” was presented in the series of numbers. Theoretically, N-Back tasks can have varying levels of difficulty; 1-Back, 2-Back, 3-Back, etc. However, we have not observed robust activation in 0-Back vs. 1-Back contrasts (Mahurin, unpublished) while the 3-Back condition is generally too difficult for subjects (see also Thomas et al15). We hypothesized that the PASAT would induce greater cortical activation reflecting its additional executive function component.11
The finger tapping task consisted of blocks of alternating left/right flexion and extension of the index fingers for 30 seconds 30-sec rest blocks. Tapping rate was externally paced by a 1 Hz auditory metronome-like beep delivered through headphones.
For both N-Back and PASAT tasks, subject accuracy was recorded. The N-Back required correct identification of 15 total targets in the 2-Back WM component and 15 total targets in the 0-Back component. PASAT required a similar identification of 15 target-pairs in the WM component and 15 targets during the control component.
Data Analysis
Questionnaire data were analyzed with nonparametric procedures (i.e., Wilcoxon signed rank tests) to determine pre- and post-fMRI scan differences. Bivariate correlation analysis was performed to examine if AHI was correlated with pre- and post-SSS scores and Full Scale WASI score, and significance level was set at p ≤ 0.05
Functional Imaging Analysis
Functional data were processed using tools from the FMRIB Software Library version 3.4 (www.fmrib.ox.ac.uk25). Prior to automated procedures each functional series was manually reviewed for extreme motion (> 1 mm translocations) or extensive N/2 ghosting. Absolute motion in the sample varied with absolute motion < 0.3 mm and relative spikes < 0.1 mm. Motion correction,26 spatial smoothing with a 7 mm at half-maximum Gaussian kernel and low pass and high pass (sigma = 75 s) filters were applied. The initial 4 volumes of each functional series were discarded to allow T1 equilibrium and statistical analysis was carried out using a general linear model (GLM). A single explanatory variable (EV) was used to model the level of task-associated activation defined as the difference between the BOLD signal during the task (2-BACK, PASAT and tapping) and non-task (active comparison). Non-orthogonalized motion parameters were included as confounds of no interest in the GLM.
Within-task comparisons were obtained by mapping each subjects functional images onto their high-resolution structural images using 7 degrees of freedom (DoF) and into standard space (Montreal Neurological Institute 152 brain) with a 12 DoF affine transformation.26 Registration was confirmed by visual inspection and manually realigned as appropriate. Group task associated activation was assessed for each task in a group ANOVA that included all paradigms and subjects (3 paradigms: 2-BACK; PASAT and tapping, 9 subjects; 26 inputs total [one subject's tapping data was excluded due to excessive motion]). This allowed us to determine the pattern of BOLD-fMRI changes for each task separately while using group mixed-effects analysis.25 This approach is based on random field theory and cluster analysis, which corrects for multiple comparisons (FLAME) in an effort to reduce type I error. Log transformed AHI values were included in the model to assess the relation between disease severity and BOLD activation. Log transformed data was used due to the non-uniform distribution of AHI values (AHI scores for all subjects: 17, 17, 18, 23, 29, 32, 42, 75, 96). Two functionally defined regions of interest (fROIs) were defined by significant clusters found during the 2-BACK-to-AHI correlation, (1) a right parietal ROI and (2) a rostral cerebellar ROI. Average task associated activation (z-score) were independently determined within these ROIs for each subject and for each paradigm. ANOVAs with a Scheffé correction for multiple comparisons were used to determine if average Z-scores or signal change differed between tasks.
RESULTS
Sleep and Clinical Characteristics
The average age and BMI of our subjects was 45.7 ± 6.6 years and 26.5 ± 1.5, respectively. Results from clinical polysomnography are displayed in Table 1. The level of sleep apnea in the group could be characterized as moderate to severe with a mean AHI of 40.1 ± 28.1. The average WASI Full Scale IQ was 103.9 ± 7.8. WASI Full Scale IQ did not significantly correlate with AHI (data not shown). Subjects did not differ significantly between pre- and post-scan SSS scores (3.6 ± 2.4 vs 2.8 ±1.1, respectively. Z = − 0.106, Wilcoxon Signed Ranks = 0.916) and AHI was not significantly correlated with either SSS measurement (Pearson R = 0.48, p = 0.18 pre-fMRI and R = 0.15, p = 0.70 post-fMRI). Thirty minutes after the fMRI session and prior to beginning the WASI, average SSS score was 2.5 ±1.2 and average ESS score was 12.9 ±3.5. Accuracy during 2-BACK was 82% for the WM component, and 99% for the 0-Back control portion. Accuracy for PASAT was 99% for both the WM and control portions of the task.
Table 1.
Polysomnography Variables
| PSG variable | Average ± SD | Range low–high |
|---|---|---|
| Total Sleep Time (min) | 336.4 ± 69.9 | 212.5–412.5 |
| Stage 1 (min) | 59.4 | – |
| Stage 2 (min) | 17.5 | – |
| Stages 3 – 4 (min) | 43.7 | – |
| REM (min) | 52.6 | – |
| Arousal Index | 37.1 ± 16.1 | 15–75 |
| Apnea Hypopnea Index | 40.1 ± 28.1 | 16.5–96 |
| Oxygen Saturation Nadir % | 91.0 ± 5.1 | 80–96 |
| Sleep Latency (min) | 10.4 ± 8.1 | 3.5–24 |
| REM Latency (min) | 125.7 ± 97.8 | 25–373.5 |
Cortical Activation
Task-Associated Activation
Activation patterns were analyzed for all 3 functional tasks (2-Back, PASAT, tapping). Compared to simple letter or number identification, performing the 2-Back or PASAT task increased the BOLD signal in a diffuse network that included prefrontal cortex, parietal lobe, anterior cingulate gyrus, thalamus, basal ganglia, lateral temporal lobes, cerebellum and brain stem. Deactivations were found in the posterior cingulate, retrosplenial and medial frontal regions (Figures, top and middle). The tapping task was associated with BOLD signal increases in the pre- and post-central gyri, along with regions of the basal ganglia, thalamus and cerebellum; no deactivations were detected for this task (Figure 1 bottom). Direct comparisons using a full ANOVA group design revealed activation differences between tapping and 2-Back/PASAT (data not shown) but, contrary to our initial hypotheses, no significant BOLD signal differences were found between 2-Back and PASAT.
Figure 1.

Cortical activation during tapping and working memory tasks (PASAT and 2-Back) in subjects with OSA. A diffuse network is activated (red-yellow) during WM tasks while deactivations are seen in the posterior cingulate, retrosplenial and medial frontal regions (blue). Tapping produced a distinct pattern with prominent activation of motor cortex. Images produced using FSL 3.3 with cluster analysis and a z-threshold = 2.5 and p < 0.01. All significant clusters shown.
Disease Severity Correlations with Bold Signal Changes
In a group mixed-effects model that included log transformed AHI scores as a covariate of interest BOLD signal changes in the right superior parietal lobe and rostral cerebellar vermis correlated with the AHI (disease severity) during 2-Back but not during tapping or PASAT (Table 2 and Figures 2–3). Within the parietal fROI there was greater activation during the 2-Back than PASAT task (average z-score across subjects for 2-Back, PASAT, tapping: 2.4 ± 1.9, 1.4 ± 1.2, 0.1 ± 0.9, respectively, ANOVA F2,23 = 6.1 p < 0.01, 2-Back-to-PASAT paired t-test p < 0.05). Individual subject's z-scores correlated with the log of their AHI score during the 2-Back, but not during PASAT (Figure 2). Within the cerebellar fROI there was no difference in overall activation between the 3 tasks (average z-score across subjects 2-Back, PASAT, tapping: 1.5 ± 2.5, 1.2 ± 1.0, 1.8 ± 1.6, respectively, all paired t-test p > 0.1), but a significant inverse correlation was observed between AHI and individual subject's z-scores during the 2-Back task (Figure 3). Both activation-to-AHI correlations remained significant for both the parietal and cerebellar ROI during the 2-Back task and insignificant for the PASAT and Tapping tasks if any single subject was omitted from the analysis (data not shown).
Table 2.
AHI Correlated Activation During 2-Back
| Brain region | p-Value | Area in cm3 | Local z-maximum | MNI coordinates of z-max |
|---|---|---|---|---|
| Right parietal | < 0.001 | 17.3 | 5.86 | 32, −48, 30 |
| 5.41 | 44, −50, 32 | |||
| 4.74 | 40, −54, 30 | |||
| Rostral cerebellar vermis | 0.044 | 6.7 | −3.98 | −6, −70, −16 |
| −3.87 | 2, −72, −20 | |||
| −3.74 | 8, −64, −16 |
MNI: Montreal Neurological Institute
Figure 2.

Activity within the right parietal lobe positively correlated with AHI during 2-Back (top panel, p < 0.001 for cluster, z threshold = 2.5 and p < 0.01 for cluster significance, mixed-effects GLM). Average z-scores within the, parietal fROI correlated with AHI scores during 2-Back (F1,7 = 20.2, P < 0.01, adj R2 = 0.71) while the association was nonsignificant during PASAT (F1,7 = 2.7, p = 0.14). Each point represents data from a single subject for the specified task.
Figure 3.
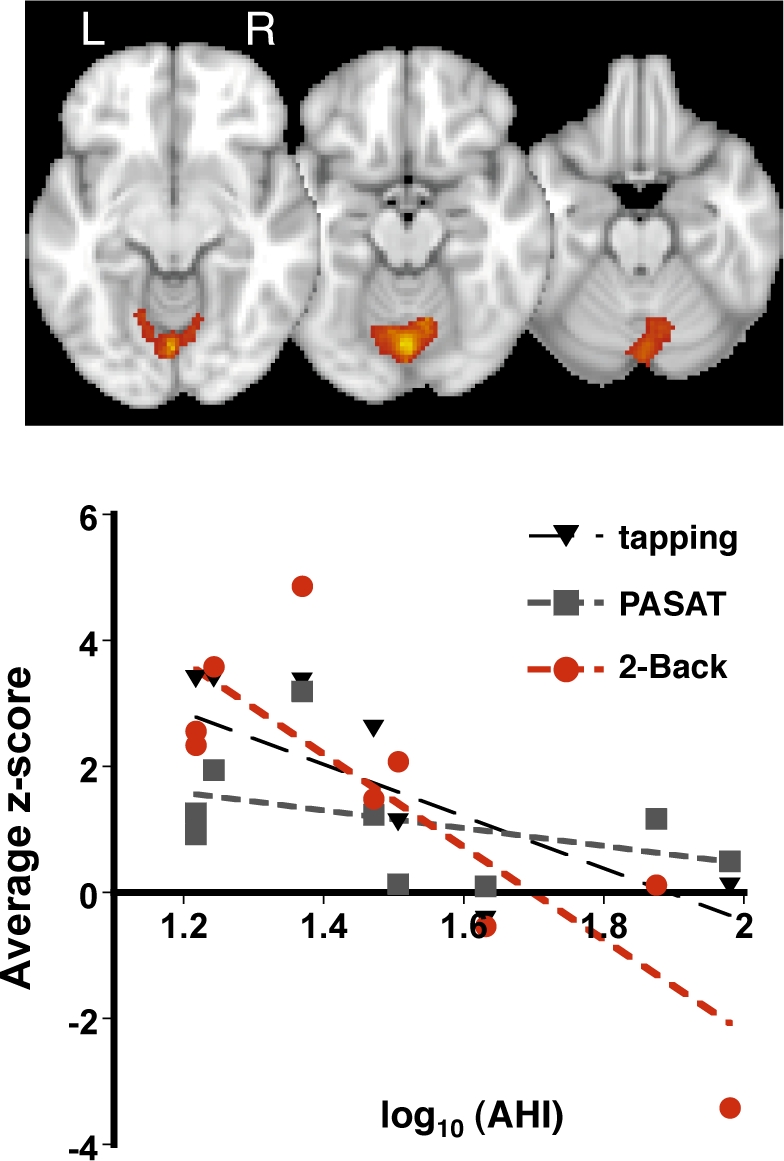
Activity within the rostral cerebellar vermis negatively correlated with AHI during 2-Back (top panel, p < 0.001 for cluster, z threshold = 2.5 and p < 0.01 for cluster significance, mixed-effects GLM). Average z-scores within the cerebellar fROI correlated with AHI scores during 2-Back (F1,7 = 17.5, p < 0.005, adj R2 = 0.67). No significant trend was found between z-scores and AHI during PASAT or tapping. Each point represents data from a single subject for the specified task.
DISCUSSION
This preliminary study reports brain activation in 9 treatment-naïve subjects with OSA and explored the relation between activation and disease severity. We found that BOLD signal changes in OSA patients performing auditory working memory (WM) or tapping tasks were highly consistent with previous reports in the literature of normal adult subjects performing similar tasks.13,27 Activation of frontal-parietal attention networks was observed during both WM tasks, whereas BOLD signal changes were observed in the pre- and post-central gyrus during finger tapping. Moreover, BOLD signal changes in the right parietal lobe and the superior cerebellar vermis correlated with AHI-indicated disease severity. Within the right parietal lobe greater activation was associated with more severe disease and 2-BACK induced greater signal changes than PASAT. In contrast, more severe OSA was associated with less activation in rostral cerebellum. Thus, in treatment-naïve individual subjects, parietal and cerebellar activation were inversely related which suggests that increased parietal activation may be a compensatory neuronal response for reduced cerebellar activation in more severe cases of OSA.
In this study, the BOLD signal in a circumscribed region of the right parietal lobe correlated with disease severity during the 2-BACK task, and BOLD signal activation within this region was significantly greater during 2-BACK than PASAT. Generally, greater BOLD signals have been associated with more complex cognitive tasks. Moreover, the superior parietal cortex (SPC), described as a mediator of attention, is engaged more frequently as difficulty of the cognitive task increases.9 Damage to the parietal cortex is associated with impaired phonological storage processes3 while the SPC is consistently activated during tests of WM regardless of cognitive (i.e., object, verbal, spatial) or presentation modality (auditory versus visual).28 Based on accuracy alone, 2-BACK (82% accuracy in our sample) appeared more demanding than PASAT (99% accuracy). Thus, task complexity could explain the greater activation of the right parietal lobe during 2-BACK. However, in our whole brain analysis which is corrected for multiple comparisons (ie; not the parietal fROI), there was no difference in amplitude of BOLD signal changes during 2-BACK and PASAT, and thus the greater activation within this right parietal fROI must be interpreted cautiously.
The parietal-activation/disease-severity association during 2-BACK but not PASAT or tapping could reflect several factors. First, the right parietal lobe was not activated or deactivated during tapping and thus a AHI-to-BOLD correlation with this test was impossible. Second, although a significant AHI-to-BOLD correlation was not found during PASAT there was a statistical trend in the data and with a greater sample size an association might be found. However, less activation of this region during PASAT (discussed above) would also decrease power to find an association. The AHI-to-BOLD correlation during 2-BACK in the parietal lobe could reflect (1) an altered cognitive strategy, and/or (2) disorganized cortical function, and/or (3) altered neurovascular coupling in more diseased OSA patients. Given the regional localization of this association, altered global neurovascular coupling seems unlikely. Likewise, if cortical function were globally dysregulated we would not expect individuals with high AHI values to perform the same on the task or have generally the same BOLD activation patterns.
A direct comparison of our results to those of Thomas et al and Ayalon et al is difficult.14,15 Thomas et al used a similar 2-Back protocol and found decreased activation in OSA patients as compared to controls and, reduced activation in patients with nocturnal hypoxia as compared to those patients without nocturnal hypoxia. In contrast, Ayalon et al reported greater activation in multiple brain regions in patients with OSA during a verbal learning task. Patient groups and/or task design could account for these differences. Similar to Thomas, we did not require desaturations during respiratory events in our definition of AHI. Thus the patients in Ayalon's study and Thomas' hypoxic subgroup of patients were likely more severely affected than ours. Therefore, our subjects may most closely resemble Thomas' non-hypoxic subgroup of OSA patients. For example, Thomas15 reported non-significant %BOLD changes in the posterior parietal cortex consistent with this region being more activated in OSA patients without nocturnal hypoxia than in those OSA patients with nocturnal hypoxia (0.76 ± 0.29 vs. 0.59 ± 0.29, in the non-hypoxic and hypoxic groups, respectively p = 0.25, see Table 115) although this is not what was found in the group fixed-effects analysis (see Figure 315). Additionally, Thomas' 2-Back task was 13.5 minutes in duration as compared to the 5-min tasks in both our and Ayalon's studies. This raises the possibility OSA patients, and their neural responses, quickly fatigue. Ayalon's findings of greater activation in OSA patients, our findings of greater activation in more severely affected patients and Thomas' finding of less activation over an extended task could then reflect an adaptive hyper-response in OSA patients that quickly fatigues. Together these results suggest that cortical activity in OSA patients depends on the task, the extent of disease, and specific definitions of disease severity. Future studies should be designed to account for the effects of these variables.
The BOLD signal patterns within the cerebellum during both WM tasks and tapping warrant discussion. Cerebellar functions extend beyond motor control contributing significantly to higher cognitive processes such as affect regulation and attention.29 Indeed, the cerebellum has been described as a neural input “transformer station,” which ultimately modulates and maintains function and behavior in multiple domains.29 Cerebellar activation and deactivation is commonly reported in imaging studies of WM29 including the N-Back task.10 We observed diffuse bilateral activation of the rostral-ventral cerebellum during tapping, while there was diffuse bilateral activation of caudal-dorsal cerebellar regions during both WM tasks. These areas of activation are consistent with reports that describe the anterior regions of the cerebellum as devoted to sensorimotor input and behavior12 and the posterior regions as primarily regulating cognition and affect.29 In addition, we found an inverse correlation between the AHI and the BOLD signal strength in the rostral cerebellum during the 2-BACK task. Thus, our findings that individuals with a higher AHI showed greater parietal activation and lower cerebellar activation suggests that cortical regions (specifically the parietal lobe) may compensate for dysregulated cerebellar activation during WM tasks in severely affected OSA patients. This is consistent with existing data that both brain regions are used during WM tasks in healthy controls.10,28 Future imaging research should not be limited to prefrontal and parietal lobe BOLD signal patterns but include information about the cerebellar activation observed.
This study has several limitations. These results must be regarded as preliminary given the small sample size and lack of a healthy comparison group. Our sample was comprised of only men weighing < 300 lb and with a girth of < 55 cm given the restriction of the bore of the MRI scanner. How these findings generalize to women and more obese patients, who frequently suffer from OSA, is unknown and could be addressed in future studies. For example, BMI may moderate the effects of CPAP on insulin sensitivity30 and thus obesity and its associated medical morbidities could worsen, or attenuate, the association between OSA and cortical function. Although the BOLD patterns induced during our WM tasks and tapping appeared similar to those reported for normal controls10,13 we cannot describe the activation patterns in our group as “normal”. Our tasks were performed in the same order: PASAT, 2-BACK then tapping, and thus order effects could account for the AHI: BOLD association during 2-BACK, but not PASAT. In addition, excessive daytime sleepiness, common in OSA, could be contributing to our findings. However, in our sample, sleepiness scores did not change significantly before and after the fMRI testing session; subjects reported slightly greater alertness after, compared to before, the scan. Finally, both the PASAT and 2-Back tasks are dependent on attention and thus altered BOLD responses may reflect altered attentional processes rather than WM dysfunction. By using tasks with varying difficulties and designs, future studies could attempt to separate attentional difficulties from WM deficits.
In conclusion, we have described BOLD signal activation patterns during two WM tasks and one finger-tapping task in a small preliminary study of patients with moderate to severe OSA. A relationship between BOLD signal strength in the parietal lobe and cerebellum and OSA disease severity suggests there is regional compensation whereby the parietal cortex increases activation as cerebellar vermial regions decrease activation during working memory tasks. The more severe the OSA, the more evident this compensatory pattern of activation may become.
ABBREVIATIONS
- 2-BACK
working memory component of N-Back working memory test
- AHI
apnea/hypopnea index
- BOLD
Blood oxygen level dependent
- ESS
Epworth sleepiness scale
- EV
explanatory variable
- fMRI
functional magnetic resonance imaging
- GLM
general linear model
- PASAT
Paced Auditory Serial Addition Task
- PSG
polysomnography
- ROI
region of interest
- SSS
Stanford sleepiness scale
- WASI
Wechsler Abbreviated Scale of Intelligence
- WM
working memory
DISCLOSURE STATEMENT
This was not an industry supported study. The authors have indicated no financial conflicts of interest.
ACKNOWLEDGMENTS
This study was supported by University of Washington Research Royalty Fund (CAL), and the Center for Women's Health and Gender Research, National Institute of Nursing Research, NR04011. PRB is funded by 1KL2RR025015-01 from the National Center for Research Resources and NIH Roadmap for Medical Research.
REFERENCES
- 1.Adams N, Strauss ME, Schluchter M, Redline S. Relation of measures of sleep-disordered breathing to neuropsychological functioning. Am J Respir Crit Care Med. 2001;163:1626–31. doi: 10.1164/ajrccm.163.7.2004014. [DOI] [PubMed] [Google Scholar]
- 2.Naëgelé B, Launois SH, Mazza S, Feuerstein C, Pépin JL, Lévy P. Which memory processes are affected in patients with obstructive sleep apnea? An evaluation of 3 types of memory. Sleep. 2006;29:533–44. doi: 10.1093/sleep/29.4.533. [DOI] [PubMed] [Google Scholar]
- 3.Baddeley AD. The episodic buffer: a new component of working memory? Trend Cogn Sci. 2000;4:417–23. doi: 10.1016/s1364-6613(00)01538-2. [DOI] [PubMed] [Google Scholar]
- 4.Macey PM, Henderson LA, Macey KE, et al. Brain morphology associated with obstructive sleep apnea. Am J Respir Crit Care Med. 2002;166:1382–7. doi: 10.1164/rccm.200201-050OC. [DOI] [PubMed] [Google Scholar]
- 5.O'Donoghue FJ, Briellmann RS, Rochford PD, et al. Cerebral structural changes in severe obstructive sleep apnea. Am J Respir Crit Care Med. 2005;171:1185–90. doi: 10.1164/rccm.200406-738OC. [DOI] [PubMed] [Google Scholar]
- 6.Morrell MJ, McRobbie DW, Quest RA, Cummin AR, Ghiassi R, Corfield DR. Changes in brain morphology associated with obstructive sleep apnea. Sleep Med. 2003;4:451–4. doi: 10.1016/s1389-9457(03)00159-x. [DOI] [PubMed] [Google Scholar]
- 7.Halbower AC, Degaonkar M, Barker PB, et al. Childhood obstructive sleep apnea associates with neuropsychological deficits and neuronal brain injury. PLoS Med. 2006;3:1391–402. doi: 10.1371/journal.pmed.0030301. [DOI] [PMC free article] [PubMed] [Google Scholar]
- 8.Tonon C, Vetrugno R, Lodi R, et al. Proton magnetic resonance spectroscopy study of brain metabolism in obstructive sleep apnoea syndrome before and after continuous positive airway pressure treatment. Sleep. 2007;30:305–11. doi: 10.1093/sleep/30.3.305. [DOI] [PubMed] [Google Scholar]
- 9.Wager T, Smith EE. Neuroimaging studies of working memory: a meta-analysis. Cogn Affect Behav Neurosci. 2003;3:255–274. doi: 10.3758/cabn.3.4.255. [DOI] [PubMed] [Google Scholar]
- 10.Cohen JD, Perlstein WM, Braver TS, et al. Temporal dynamics of brain activation during a working memory task. Nature. 1997;386:604–8. doi: 10.1038/386604a0. [DOI] [PubMed] [Google Scholar]
- 11.Gronwall DMA. Paced auditory serial-addition task: a measure of recovery from concussion. Percept Mot Skills. 1977;44:367–73. doi: 10.2466/pms.1977.44.2.367. [DOI] [PubMed] [Google Scholar]
- 12.Riecker A, Wildgruber D, Mathiak K, Grodd W, Ackermann H. Parametric analysis of rate-dependent hemodynamic response functions of cortical and subcortical brain structures during auditorily cued finger tapping: a fMRI study. Neuroimage. 2003;18:731–9. doi: 10.1016/s1053-8119(03)00003-x. [DOI] [PubMed] [Google Scholar]
- 13.Tomasi D, Chang L, Caparelli EC, Ernst T. Different activation patterns for working memory load and visual attention load. Brain Res. 2007;1132:158–65. doi: 10.1016/j.brainres.2006.11.030. [DOI] [PMC free article] [PubMed] [Google Scholar]
- 14.Ayalon L, Ancoli-Israel S, Klemfuss Z, Shalauta MD, Drummond SPA. Increased brain activation during verbal learning in obstructive sleep apnea. Neuroimage. 2006;31:1817–25. doi: 10.1016/j.neuroimage.2006.02.042. [DOI] [PubMed] [Google Scholar]
- 15.Thomas RJ, Rosen BR, Stern CE, Weiss JW, Kwong KK. Functional imaging of working memory in obstructive sleep-disordered breathing. J Appl Physiol. 2005;98:2226–34. doi: 10.1152/japplphysiol.01225.2004. [DOI] [PubMed] [Google Scholar]
- 16.Ayalon L, Peterson S. Functional central nervous system imaging in the investigation of obstructive sleep apnea. Curr Opin Pulm Med. 2007;13:479–83. doi: 10.1097/MCP.0b013e3282f0e9fb. [DOI] [PubMed] [Google Scholar]
- 17.Hoddes E, Zarcone V, Smythe H, Phillips R, Dement WC. Quantification of sleepiness: A new approach. Psychophysiology. 1973;10:431–6. doi: 10.1111/j.1469-8986.1973.tb00801.x. [DOI] [PubMed] [Google Scholar]
- 18.Johns MW. Reliability and factor analysis of the Epworth Sleepiness Scale. Sleep. 1992;15:376–81. doi: 10.1093/sleep/15.4.376. [DOI] [PubMed] [Google Scholar]
- 19.Punjabi NM, Bandeen-Roche K, Young T. Predictors of objective sleep tendency in the general population. Sleep. 2003;26:678–83. doi: 10.1093/sleep/26.6.678. [DOI] [PubMed] [Google Scholar]
- 20.Wechsler D. San Antonio, TX: The Psychological Corporation: Harcourt Brace & Company; 1999. Weschler Abbreviated Scale of Intelligence: Manual. [Google Scholar]
- 21.Gray JR, Chabris CF, Braver TS. Neural mechanisms of general fluid intelligence. Nat Neurosci. 2003;6:316–22. doi: 10.1038/nn1014. [DOI] [PubMed] [Google Scholar]
- 22.Rechtschaffen A, Kales A. Los Angeles: Brain Information Service/Brain Research Institute, UCLA; 1968. A manual of standardized terminology, techniques and scoring system for sleep stages of human subjects. [Google Scholar]
- 23.ASDA EEG arousals: scoring rules and examples: a preliminary report from the Sleep Disorders Atlas Task Force of the American Sleep Disorders Association. Sleep. 1992;15:173–84. [PubMed] [Google Scholar]
- 24.Flemons WW, Buysse D, Redline S, et al. Sleep-related breathing disorders in adults: Recommendations for syndromes and measurement techniques in clinical research. Sleep. 1999;22:667–89. [PubMed] [Google Scholar]
- 25.Smith SM, Jenkinson M, Woolrich MW, et al. Advances in functional and structural MR image analysis and implementation as FSL. Neuroimage. 2004;23:S208–S219. doi: 10.1016/j.neuroimage.2004.07.051. [DOI] [PubMed] [Google Scholar]
- 26.Jenkinson M, Bannister P, Brady M, Smith S. Improved optimization for the robust and accurate linear registration and motion correction of brain images. Neuroimage. 2002;17:825–41. doi: 10.1016/s1053-8119(02)91132-8. [DOI] [PubMed] [Google Scholar]
- 27.Linden DE. The working memory networks of the human brain. Neuroscientist. 2007;13:257–67. doi: 10.1177/1073858406298480. [DOI] [PubMed] [Google Scholar]
- 28.Simon O, Kherif F, Flandin G, et al. Automatized clustering and functional geometry of human parietofrontal networks for language, space, and number. Neuroimage. 2004;23:1192–202. doi: 10.1016/j.neuroimage.2004.09.023. [DOI] [PubMed] [Google Scholar]
- 29.Schmahmann JD. Disorders of the cerebellum: ataxia, dysmetria of thought, and the cerebellar cognitive affective syndrome. J Neuropsychiatry Clin Neurosci. 2004;16:367–78. doi: 10.1176/jnp.16.3.367. [DOI] [PubMed] [Google Scholar]
- 30.Harsch IA, Schahin SP, Br̈ckner K, et al. The effect of continuous positive airway pressure treatment on insulin sensitivity in patients with obstructive sleep apnoea syndrome and type 2 diabetes. Respiration. 2004;71:252–9. doi: 10.1159/000077423. [DOI] [PubMed] [Google Scholar]