

Abstract
Background
An adequate intake of 550 mg choline/d was established for the prevention of liver dysfunction in men, as assessed by measuring serum alanine aminotransferase concentrations.
Objective
This controlled feeding study investigated the influence of choline intakes ranging from 300 to 2200 mg/d on biomarkers of choline status. The effect of the methylenetetrahydrofolate reductase (MTHFR) C677T genotype on choline status was also examined.
Design
Mexican American men (n = 60) with different MTHFR C677T genotypes (29 677TT, 31 677CC) consumed a diet providing 300 mg choline/d plus supplemental choline intakes of 0, 250, 800, or 1900 mg/d for total choline intakes of 300, 550, 1100, or 2200 mg/d, respectively, for 12 wk; 400 μg/d as dietary folate equivalents and 173 mg betaine/d were consumed throughout the study.
Results
Choline intake affected the response of plasma free choline and betaine (time × choline, P < 0.001); the highest concentrations were observed in the 2200 mg/d group. Phosphatidylcholine (P = 0.026) and total cholesterol (P = 0.002) were also influenced by choline intake; diminished concentrations were observed in the 300 mg/d group. Phosphatidylcholine was modified by MTHFR genotype (P = 0.035; 677TT < 677CC). After a methionine load (100 mg/kg body wt), choline intakes of 1100 and 2200 mg/d attenuated (P = 0.016) the rise in plasma homocysteine, as did the MTHFR 677TT genotype (P < 0.001). Serum alanine aminotransferase was not influenced by the choline intakes administered in this study.
Conclusions
These data suggest that 550 mg choline/d is sufficient for preventing elevations in serum markers of liver dysfunction in this population under the conditions of this study; higher intakes may be needed to optimize other endpoints.
INTRODUCTION
Although the importance of choline in human health was documented over 70 y ago (1), its essentiality was only recently acknowledged with the establishment of an adequate intake (AI) of 425 and 550 mg/d for women and men, respectively (2). Choline, a methyl-rich nutrient, exists in a variety of forms and is required for many metabolic pathways with diverse outcomes, including neurotransmitter formation, phospholipid biosynthesis, and methyl group metabolism (3). Although choline deficiency is linked to numerous metabolic aberrations (4-9), the choline AI is based primarily on the amount of choline estimated to prevent liver dysfunction (2, 4).
Ascertainment of a dietary requirement for choline is complicated by several factors. Choline, specifically phosphatidylcholine, may be synthesized de novo through the phosphatidylethanolamine N-methyltransferase (PEMT) pathway, which provides an estimated one-third of the choline requirement (10). As a major consumer of methyl groups derived from S-adenosylmethionine, the PEMT pathway is also a major producer of homocysteine (11)—a sulfur-containing amino acid linked to many adverse health outcomes. The entwinement of choline metabolism with the metabolic pathways of folate further complicates choline requirements (12).
We recently reported that supplemental choline, with intakes up to 2200 mg/d, was ineffective in preventing a rise in fasting plasma total homocysteine (tHcy) in Mexican American men under conditions of suboptimal folate intake (13). The folaterelated rise in plasma tHcy was particularly marked (ie, 10-31 μmol/L) in those with a common genetic variant, cytosine (C) to thymine (T) transition at nucleotide 677, in the methylenetetrahydrofolate reductase (MTHFR) gene (13). The MTHFR 677C→T genetic variant impairs the conversion of 5,10-methylenetetrahydrofolate to 5-methyltetrahydrofolate and may increase requirements for choline as a one-carbon donor (14).
As an extension of this work (13), the present 12-wk study sought to investigate the effects of controlled choline intakes (300, 550, 1100, and 2200 mg/d) on plasma biomarkers of choline status, postmethionine load homocysteine, liver function, and urinary excretion of choline and betaine. In doing so, the adequacy of the choline AI, 550 mg/d, in Mexican American men with different MTHFR C677T genotypes was evaluated. Men of Mexican descent were chosen as the study population because of the high prevalence (≈20%) of the MTHFR 677TT genotype in this ethnic group (15). All study participants consumed unlabeled choline for the first 9 wk of the 12-wk study; thereafter, a subsample consumed 15% of their total choline as D9-choline to enable exploration of choline flux as a function of choline intake, MTHFR C677T genotype, or both. This article presents data on choline and its derivatives (ie, betaine, phosphatidylcholine, and sphingomyelin) for the first 9 wk of this study. Data on the isotopic enrichment of choline and its derivatives during weeks 10-12 will be presented in a separate publication.
SUBJECTS AND METHODS
Subjects
The subjects were 60 healthy Mexican American men (defined as having 2 Mexican parents) residing in Southern California, aged 18 -55 y, and preselected for the MTHFR 677CC or TT genotype. Entry into the study was contingent on good health status assessed primarily via a blood chemistry profile and complete blood count. Approximately 18% of the subjects had blood lipid concentrations that were not in the normal range but were deemed not to be of clinical importance by the study physician. Additional inclusion criteria have been detailed elsewhere (13). The study was approved by the Cal Poly Pomona Institutional Review Board for human subjects, and informed consent was obtained from all study participants.
Study design, diet, and supplements
This was a 12-wk controlled feeding study providing the Recommended Dietary Allowance (RDA) of folate (ie, 438 μg dietary folate equivalents (DFE)/d) and choline intakes of 300, 550, 1100, or 2200 mg/d. The 5-d diet (13) provided 319 μg/d as DFE measured microbiologically after trienzyme treatment and extraction (16, 17), 300 mg choline/d, and 173 mg betaine/d measured by liquid chromatography-mass spectrometry after phenol chloroform extraction (18, 19), and 2570 kcal/d derived from carbohydrate (57%), fat (30%), and protein (13%) estimated by using the ESHA Food Processor Nutrient Data Base (version 7.81; ESHA Research Salem, OR). In addition, the subjects were given 70 μg supplemental folic acid/d (119 μg DFE) prepared from commercially available folic acid (Sigma Chemical, St Louis, MO) (13) for total folate intakes of 438 μg DFE/d; 0, 250, 800, and 1900 mg supplemental choline/d prepared from commercially available choline chloride (BCP Ingredients Inc, Verona, MO) for total choline intakes of 300, 550, 1100, and 2200 mg/d, respectively; as well as a multimineral (Trader Joe’s, Monrovia, CA) given daily, vitamin K (Solgar Vitamin and Herb, Leonia, NJ) given daily, vitamins A and D (Target Corporation, Minneapolis, MN) given every fourth day, and iron (Nature Made Nutritional Products, Mission Hills, CA) given as needed (based on weekly hematocrit readings). The diet plus supplements provided ≥90% of the dietary reference intakes (2, 20-22) or the 1989 RDA for potassium (23).
The subjects were randomly assigned to the choline treatment group at baseline (week 0) and were provided all of their meals (n = 3/d) and snacks (n = 1/d) throughout the 12-wk study. The subjects were required to consume a minimum of one meal per day in the metabolic kitchen housed within the Human Nutrition and Food Science Department at Cal Poly Pomona University; other meals and snacks were provided as takeaways and were consumed off-site. The subjects were instructed to consume all of the food and beverages that were provided and not to consume any foods or beverages (except water) outside of these allocations. The supplements were taken with breakfast; the choline supplement was also consumed at lunch and dinner for the 1100 and 2200 mg choline/d intake groups as previously detailed (13). Weight was monitored weekly, and any deviation of ± 5% from baseline was addressed by modifying energy intake with folate- and choline-free items (13). Daily contact with the Principal Investigator and/or trained graduate students during breakfast and/or dinner helped ensure subject compliance with the study protocol.
At weeks 0 and 12, a methionine load was administered to the subjects. On the day of the methionine load, a fasting blood sample was collected from each subject. After the blood draw, all subjects consumed breakfast consisting of a whole wheat bagel, cream cheese, and apple juice. Immediately after breakfast, subjects consumed 100 mg l-methionine/kg body wt (Mallinckrodt Baker Inc, Phillipsburg, NJ). The methionine load was prepared by weighing the appropriate amount in 50-mL conical tubes and dissolving it in ≈45 mL apple juice. A second blood sample was collected 4 h after the methionine load. The subjects refrained from consuming lunch or snacks until after the second blood draw.
During the last 3 wk of the study (weeks 10, 11, and 12), subjects in the 550 and 1100 mg/d (10 CC and 10 TT) groups consumed 15% of their total choline intake as D9-choline (Cambridge Isotope Laboratories Inc, Andover, MA) as previously described (13). These data will be presented separately.
Sample collection and blood processing
Baseline and weekly fasting (10 h) venous blood samples were collected from subjects into serum separator gel and clotactivator tubes (Vacutainer; Becton Dickinson, Rutherford, NJ) and EDTA-coated tubes (Vacutainer), processed, and stored at -80 °C as previously detailed (24). Urine samples (24 h) were collected at baseline (week 0), week 6, and week 12 of the study into 2-L brown plastic bottles containing 3 g sodium ascorbate, processed, and stored at -20 °C as described previously (24).
Analytic methods
Folate and choline contents of the diet
The folate and choline contents of the diet were determined before the study started and twice during the study. Each meal (ie, breakfast, lunch and snack, or dinner), including beverages, was blended with 150 mL cold 0.1 mol potassium phosphate buffer/L (pH 6.3) containing 57 mmol ascorbic acid/L, dispensed into 50-mL conical tubes, and stored at -20 °C. Food folate was determined by the method of Tamura et al (16) with double extraction (17) as previously detailed (13). The total folate content of the 3 replicates measured microbiologically (25) was 319 ± 8 μg/d. Total choline and betaine contents were determined by the method developed by Koc et al (18), with modifications based on our instrumentation (19). Total choline and betaine contents of the 3 replicates were 300 ± 5.5 and 173 ± 6 mg/d, respectively.
MTHFR C677T genotype
DNA for genotyping was extracted from leukocytes by using a commercially available kit (DNeasy Tissue Kit; Qiagen Science, Valencia, CA). Determination of the MTHFR C677T genotype involved polymerase chain reaction (PCR) and Hinf1 restriction enzyme digestion (26). PCR products were separated by gel electrophoresis on a 2.0% agarose gel and viewed under ultraviolet light.
Plasma and urinary measurements of choline and its derivatives
The aqueous (free choline and betaine) and organic (ie, phosphatidylcholine and sphingomyelin) plasma metabolites were measured at weeks 0, 3, 6, and 9 by the methods of Innis and Hasman (27) and Koc et al (18), respectively, with modifications based on our instrumentation (19). Urinary free choline and betaine were measured by using the method of Innis and Hasman (27) at weeks 0 and 6. Because of the large sample number, the samples were run in batches. Each batch contained all 4 dietary treatments; both MTHFR 677C→T genotypes; weeks 0, 3, 6, and 9 for each subject (or weeks 0 and 6 for urine); and a positive control (ie, pooled human plasma). All samples were run in duplicate. The intra- and interassay CVs for each analyte measured were ≤10% based on the pooled plasma control.
Plasma tHcy
Pre- and postmethionine load plasma tHcy concentrations were measured at weeks 0 and 12 in duplicate by using a modified HPLC method with fluorometric detection (28, 29). Each batch contained all 4 dietary treatments, both MTHFR C677T genotypes, and week 0 and week 12 pre- and postmethionine load samples for each subject. Based on the positive control (ie, pooled plasma), the intra- and interassay CVs were <8%.
Clinical measurements
Serum concentrations of creatinine, blood urea nitrogen (BUN), alkaline phosphatase, γ-glutamyl transferase, alanine aminotransferase (ALT), aspartate aminotransferase (AST), lactate dehydrogenase, total cholesterol, HDL cholesterol, LDL cholesterol, and triglycerides (TG) were measured with routine clinical assays using commercially available kits on an automated analyzer (Roche Hitachi pModular, Tokyo, Japan) at Cedars-Sinai Medical Center, Department of Pathology and Laboratory Medicine (Los Angeles, CA). Measurements were performed at baseline and biweekly thereafter for each subject.
Statistical analysis
Each dependent variable of interest (ie, plasma phosphatidylcholine) was tested for normality with the Shapiro-Wilks test. Variables that were not normally distributed were log transformed, and transformed values were used in all ANOVA procedures. To test for baseline differences (week 0) in the dependent variables between the MTHFR C677T genotypes and among the various choline intake groups, a 2-factor ANOVA (choline intake and MTHFR C677T genotype) was performed. When a significant difference was detected, multiple comparisons with a Tukey correction were used for mean separation. To assess the effect of choline intake and MTHFR C677T genotype on dependent variables with >2 time points, a repeated-measures ANOVA was performed by using time (weeks 0, 3, 6, and 9 or weeks 0, 2, 4, 6, 8, and 10) as the within-subject factor, and choline intake and MTHFR C677T as the between-subject factors. For plasma phosphatidylcholine and serum total cholesterol, baseline measures were controlled by using time zero as a between-subject factor. All possible interactions were tested in the model. Post hoc analyses with adjustments for multiple comparisons were used for the purposes of mean separation. Pearson correlation coefficients were used to explore the relation between serum total cholesterol and LDL cholesterol, HDL cholesterol, and/or plasma phosphatidylcholine. To assess the effect of choline intake and MTHFR C677T genotype on dependent variables with 2 time points, a general linear model (GLM) was used with the differences between the weeks (ie, week 12 - week 0 or week 6 - week 0) as the response. The independent variables were choline intake, MTHFR C677T genotype, and the baseline measure. All interactions were tested in the model. The GLM procedure was followed by post hoc analyses with adjustments for multiple comparisons. The data were analyzed by using SPSS software (version 15; SPS Inc, Chicago, IL). Differences were considered to be significant at P < 0.05. Data are presented as means ± SEMs (unless noted otherwise) for all dependent variables.
RESULTS
Study participants and baseline characteristics
The final study group comprised 60 men, 29 with the MTHFR 677TT genotype and 31 with the MTHFR 677CC genotype. At baseline, BMI, age, and the clinical features used to ascertain health did not differ between the MTHFR C677T genotypes (data not shown) or among the choline treatment groups (Table 1). Indicators of kidney function (serum creatinine and BUN) and liver function (serum ALT and serum AST) were within normal ranges at baseline and throughout the study duration for all study participants. Subject weights were maintained within 5% of initial values for all but 5 men who experienced weight changes ranging from -8.3% to 6.8%. At baseline, the measured variables (eg, plasma free choline) did not differ (P > 0.05) between the choline treatment groups (Table 1) or between the MTHFR C677T genotypes (data not shown).
TABLE 1.
Baseline measures of clinical and biochemical variables assessed in Mexican American men at the time of random assignment to choline treatment1
| Choline intake |
||||
|---|---|---|---|---|
| Variable | 300 mg/d | 550 mg/d | 1100 mg/d | 2200 mg/d |
| Age (y) | 22 (18-55) | 22 (18-42) | 23 (19-35) | 21 (18-48) |
| BMI (kg/m2) | 25 (23-32) | 27 (20-37) | 26 (20-36) | 26 (20-37) |
| Serum ALT (U/L) | 28.9 ± 3.0 | 21.3 ± 1.8 | 22.1 ± 4.8 | 21.8 ± 2.7 |
| Serum AST (U/L) | 21.4 ± 1.1 | 19.6 ± 1.1 | 18.8 ± 2.1 | 20.3 ± 2.0 |
| Serum ALKP (U/L) | 78.7 ± 6.4 | 74.9 ± 5.2 | 75.9 ± 4.6 | 78.3 ± 7.8 |
| Serum GGT (U/L) | 27.7 ± 5.0 | 22.7 ± 2.1 | 24.3 ± 2.5 | 21.1 ± 1.9 |
| Serum LDH (U/L) | 142 ± 6 | 150 ± 7 | 138 ± 5 | 142 ± 9 |
| Serum creatinine (mg/dL) | 1.01 ± 0.03 | 1.05 ± 0.03 | 1.05 ± 0.03 | 1.02 ± 0.04 |
| Serum BUN (mg/dL) | 13.1 ± 0.6 | 14.3 ± 0.7 | 14.7 ± 1.0 | 15.0 ± 1.0 |
| Serum TC (mg/dL) | 186 ± 9 | 172 ± 7 | 169 ± 6 | 170 ± 8 |
| Serum LDL cholesterol (mg/dL) | 106 ± 8 | 102 ± 6 | 99 ± 5 | 101.5 ± 7 |
| Serum HDL cholesterol (mg/dL) | 47.4 ± 4.0 | 48.2 ± 2.3 | 45.6 ± 2.8 | 48.2 ± 3.4 |
| Serum TG (mg/dL) | 122 ± 17 | 108 ± 16 | 119 ± 24 | 103 ± 11 |
| Plasma free choline (μmol/L) | 6.43 ± 0.47 | 6.79 ± 0.40 | 6.65 ± 0.42 | 6.54 ± 0.30 |
| Plasma betaine (μmol/L) | 36.7 ± 2.8 | 44.1 ± 4.1 | 41.6 ± 3.5 | 38.9 ± 1.7 |
| Plasma PtdCho (μmol/L) | 2060 ± 90 | 1822 ± 48 | 1863 ± 93 | 1772 ± 85 |
| Plasma SM (μmol/L) | 438 ± 21 | 503 ± 32 | 508 ± 35 | 518 ± 33 |
| Urinary free choline (mg/g Cr) | 1.4 ± 0.11 | 1.94 ± 0.35 | 1.51 ± 0.17 | 1.45 ± 0.12 |
| Urinary betaine (mg/g Cr) | 5.55 ± 0.63 | 7.96 ± 1.59 | 6.33 ± 1.15 | 4.71 ± 0.51 |
| PML plasma tHcy (% change) | 183 ± 27 | 225 ± 18 | 206 ± 17 | 201 ± 21 |
| Serum folate (nmol/L) | 27.1 ± 4.0 | 27.6 ± 2.9 | 28.8 ± 2.6 | 22.2 ± 3.4 |
| Plasma tHcy (μmol/L) | 10.0 ± 1.5 | 11.2 ± 1.9 | 11.1 ± 1.4 | 9.8 ± 1.2 |
Data are presented as x̄ ± SEM or median (range); n = 13-17 per group. ALKP, alkaline phosphate; ALT, alanine aminotransferase; AST, aspartate aminotransferase; BUN, blood urea nitrogen; Cr, creatinine; GGT, γ-glutamyl transferase; LDH, lactate dehydrogenase; PML, postmethionine load; PtdCho, phosphatidylcholine; TC, total cholesterol; tHcy, total homocysteine; SM, sphingomyelin; TG, triglyceride. Choline treatment groups and MTHFR C677T genotypes (data not shown) did not differ at baseline, P > 0.05 (2-factor ANOVA).
Plasma free choline
Plasma free choline responses over time differed between the choline intake groups (time × choline; P < 0.001). Specifically, plasma choline increased (P < 0.05) in men who consumed 550, 1100, or 2200 mg/d but did not change (P = 0.35) in men who consumed 300 mg/d. A main effect of choline intake on plasma choline response was also observed (P < 0.001). Post hoc analyses with adjustments for multiple comparisons showed that plasma choline was lowest in the 300 mg/d group, intermediate in the 550 and 1100 mg/d groups, and highest in the 2200 mg/d group (300 < 550 = 1100 < 2200 mg/d). MTHFR C677T genotype did not influence (P = 0.488) plasma free choline concentrations nor did it interact with time (P = 0.441) or choline intake (P = 0.770) to affect plasma free choline concentrations. No 3-factor interactions were detected (P = 0.216).
Plasma betaine
Plasma betaine responses over time differed between the choline intake groups (time × choline; P < 0.001; Figure 1B). Specifically, plasma betaine increased (P < 0.05) in men who consumed 550, 1100, or 2200 mg/d but did not change (P = 0.137) in men who consumed 300 mg/d. A main effect of choline intake on plasma betaine response was also observed (P < 0.001). Post hoc analyses with adjustments for multiple comparisons showed that plasma betaine was highest in the 2200 mg/d group and higher in the 1100 mg/d group than in the 300 mg/d group (Figure 1B). MTHFR C677T genotype did not influence (0.534) plasma betaine nor did it interact with time (P = 0.199) or choline intake (P = 0.506) to affect plasma betaine. No 3-factor interactions were detected (P = 0.585).
FIGURE 1.

Mean (± SEM) concentrations of plasma free choline (A), plasma betaine (B), plasma phosphatidylcholine (C), and serum total cholesterol (D) in Mexican American men [n = 60; 29 with the methylenetetrahydrofolate reductase (MTHFR) 677TT genotype and 31 with the MTHFR 677CC genotype] who consumed 300, 550, 1100, or 2200 mg choline/d. Data were analyzed by using a repeated-measures ANOVA with time as the within-subject factor and MTHFR C677T genotype and choline intake as the between-subject factors. For plasma phosphatidylcholine and serum total cholesterol, baseline measures were controlled by using time zero as a between-subject factor. All possible interactions were included in the model. Post hoc analyses with adjustments for multiple comparisons were used for the purposes of mean separation. n = 13-17 per intake group. The responses of all of the dependent variables shown were influenced by choline intake (time × choline, P ≤ 0.007; choline, P ≤ 0.026). In addition, MTHFR C677T genotype influenced (P = 0.035) the response of plasma phosphatidylcholine (data not shown). However, none of the other variables were influenced by MTHFR C677T genotype, and no interaction of MTHFR C677T genotype with time (P > 0.05) or with choline intake (P > 0.05) was observed to influence the response (data not shown). Lines with different lowercase letters indicate differences (P < 0.05) between choline treatment groups after correction for multiple comparisons.
Plasma phosphatidylcholine
Plasma phosphatidylcholine responses differed between the choline intake groups (P = 0.026); lower concentrations were detected in the 300 mg/d group than in the other groups (Figure 1C). In addition, men with the MTHFR 677TT genotype had lower (P = 0.035) concentrations than did those with the MTHFR 677CC genotype (data not shown). No effect of time (P = 0.120) was observed, and no interactions between the independent variables were detected.
Plasma sphingomyelin
No effect of time (P = 0.145), choline intake (P = 0.545), or MTHFR C677T genotype (P = 0.776) was detected on plasma sphingomyelin, and no 2- (P ≥ 0.324) or 3-factor interactions were detected (P = 0.247).
Serum lipids
Serum total cholesterol responses differed between the choline intake groups (P = 0.0002); lower concentrations were observed in the 300 and 550 mg/d groups than in the 1100 and 2200 mg/d groups (Figure 1D). Serum total cholesterol was positively correlated with plasma phosphatidylcholine (r = 0.418-0.588, P < 0.001) and LDL cholesterol (r = 0.459-0.926, P < 0.001) at every time point (data not shown). Choline intake modified the HDL cholesterol response (time × choline; P = 0.013); however, no clear patterns emerged and no correlations were detected between HDL cholesterol and total cholesterol (data not shown). For all of the lipid variables, no main effect of choline intake or MTHFR C677T was detected nor did MTHFR C677T interact with time or choline intake to modify the response (data not shown). In addition, no 3-factor interactions were detected.
Serum indicators of organ function (data not shown)
For ALT, AST, γ-glutamyl transferase, lactate dehydrogenase, creatinine, and alkaline phosphatase, no effect of time (P > 0.05), choline intake (P > 0.05), or MTHFR C677T genotype (P > 0.05) was detected, and no 2- or 3-factor interactions were detected (P > 0.05). For BUN, no main effects of MTHFR C677T genotype (P = 0.467) or choline intake (P = 0.629) were detected. However, BUN concentrations decreased throughout the study (P < 0.001), which was not influenced by genotype (genotype × time; P = 0.70) or choline (choline × time; P = 0.87).
Urinary free choline
Urinary free choline excretion (ie, week 6 - week 0) differed (P < 0.001) between the choline intake groups; the 2200 mg/d group had the highest excretion (2200 > 1100 > 550 = 300 mg/d; Figure 2). MTHFR C677T genotype did not influence (P = 0.390) urinary free choline excretion nor did it interact (P = 0.772) with choline intake to affect urinary choline excretion (data not shown). Importantly, the amount of free choline excreted in the urine was <1% of the total intake regardless of the choline dose (data not shown).
FIGURE 2.

Mean (± SEM) urinary excretion of free choline and betaine at weeks 0 and 6 in Mexican American men [n = 60; 29 with the methylenetetrahydrofolate reductase (MTHFR) 677TT genotype and 31 with the MTHFR 677CC genotype] who consumed 300, 550, 1100, or 2200 mg choline/d. The data were analyzed by using the GLM procedure, with the difference between weeks 0 and 6 as the response variable. The independent variables included choline intake, MTHFR C677T genotype, and baseline measures. All possible interactions were included in the model, and post hoc analyses with adjustments for multiple comparisons were used for the purposes of mean separation. n = 13-17 per intake group. MTHFR C677T genotype did not affect (P > 0.05) any of the measured variables (data not shown). Choline intake affected urinary free choline (P < 0.001) and betaine (P = 0.021) excretion, as did baseline measures (P < 0.001). No interactions (P > 0.05) between the independent variables were detected. Bars with different lowercase letters indicate differences (P < 0.05) between treatment groups with regard to the change (week 6 - week 0) in urinary excretion.
Urinary betaine
Urinary betaine excretion (ie, week 6 - week 0) differed (P = 0.023) between the choline intake groups; the 2200 and 1100 mg/d groups excreted more betaine than did the 300 and 550 mg/d groups (Figure 2). MTHFR C677T genotype did not influence (P = 0.066) urinary betaine excretion nor did it interact (P = 0.204) with choline intake to affect urinary betaine excretion (data not shown).
Postmethionine load plasma tHcy
The percentage change in postmethionine load plasma tHcy (ie, week 12 - week 0) differed between the choline intake groups (P = 0.016) and between the MTHFR C677T genotypes (P < 0.001). Specifically, the rise in plasma tHcy after the methionine load at week 12 was attenuated by choline intakes of 1100 or 2200 mg/d relative to 300 or 550 mg/d (Figure 3). The rise in plasma tHcy after the methionine load at week 12 was also less in men with the MTHFR 677TT genotype than in those with the 677CC genotype (data not shown). No interactions were detected between the independent variables (P > 0.05).
FIGURE 3.
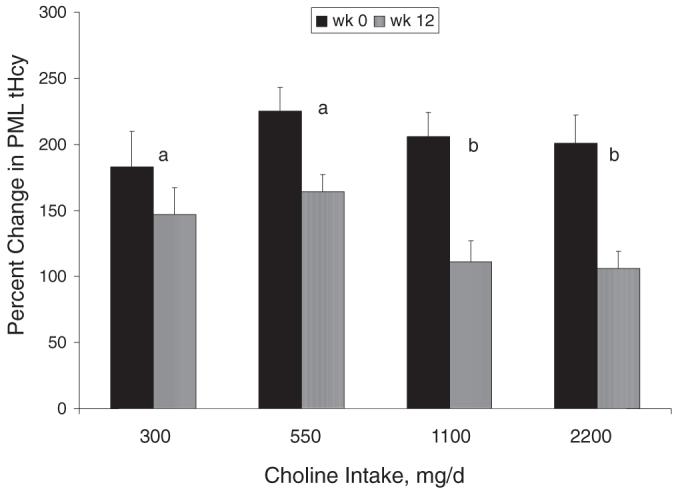
Mean (± SEM) percentage changes in postmethionine load (PML) plasma total homocysteine (tHcy) concentrations (PML tHcy - premethionine load tHcy)/premethionine load tHcy × 100) at weeks 0 and 12 in Mexican American men [n = 60; 29 with the methylenetetrahydrofolate reductase (MTHFR) 677TT genotype and 31 with the MTHFR 677CC genotype] who consumed 300, 550, 1100, or 2200 mg choline/d. The data were analyzed by using the GLM procedure, with the difference between weeks 0 and 12 as the response variable. The independent variables included choline intake, MTHFR C677T genotype, and baseline measures. All possible interactions were included in the model, and post hoc analyses with adjustments for multiple comparisons were used for the purposes of mean separation. n = 13-17 per intake group. Choline intake (P = 0.016), MTHFR C677T genotype (P < 0.001; data not shown), and baseline measures (P < 0.001; data not shown) affected the percentage change in PML plasma tHcy. No interactions (P > 0.05) between the independent variables were observed. Bars with different lowercase letters indicate differences (P < 0.05) between treatment groups in the response (week 12 - week 0) of the percentage change in PML tHcy.
DISCUSSION
This study investigated the effects of a broad range of choline intakes (300-2200 mg/d) on biomarkers of choline status and liver function. The influence of the MTHFR C677T genotype on choline status was also investigated because the 677TT genotype is a strong modifier of one-carbon metabolism and may increase the requirements for choline. Adherence to the study protocol was suggested by the response of serum folate to the dietary protocol, as previously described (13), and by the response of plasma free choline to choline supplementation described herein.
The primary criterion used to estimate the AI for choline was the prevention of liver damage as assessed by serum ALT (2). In the present study, 300 mg choline/d was sufficient in preventingelevations in serum markers of liver dysfunction (ie, ALT and AST). However, it was insufficient in preventing a decrease in plasma phosphatidylcholine and serum cholesterol, both of which are constituents of LDL (derived from VLDL) and HDL. The decrease in serum cholesterol appeared to be due to a lowering of LDL, which is consistent with previous work conducted in men consuming choline-deficient diets (4). Given that choline deficiency leads to fatty liver and liver dysfunction, the decrease in serum cholesterol (although atheroprotective) may be indicative of impaired VLDL biosynthesis (and triglyceride removal), which over time may lead to fatty liver with possible progression to cell necrosis, fibrosis, and cirrhosis of the liver (30).
It is important to recognize that the requirement for choline may be affected by the dietary consumption of folate. Previous studies have reported decreased plasma phosphatidylcholine concentrations in response to folate restriction and restoration when folate, in the absence of choline, was repleted (19, 31). Thus, under conditions of suboptimal folate intake, folatedependent methylation of phosphatidylethanolamine to phosphatidylcholine is impaired (31). In the present study, folate status decreased in all study participants (particularly among those with the MTHFR 677TT genotype), despite consumption of the RDA for folate (13). In turn, the diminished availability of folate may have impaired the de novo synthesis of phosphatidylcholine through the PEMT pathway and increased the requirements of choline for use in the cytidine 5-diphosphocholine-choline pathway. The lower concentration of plasma phosphatidylcholine in men with the MTHFR 677TT genotype (relative to those with the 677CC genotype), regardless of choline intake, suggests that the cytidine 5-diphosphocholine-choline pathway cannot fully compensate for diminished PEMT activity.
Betaine intake may also affect the dietary requirement for choline. In the present study, betaine consumption was relatively low at 173 mg/d. However, it was 3 times the amount used in another controlled feeding study in which consumption of the choline AI (550 mg/d) led to organ dysfunction in 6 of 26 male subjects (32). Although betaine cannot serve as a substitute for choline, it may spare choline for phospholipid biosynthesis and thereby decrease choline requirements, as was recently shown in an animal model (33).
We previously reported a lack of effect of choline intake on fasting plasma tHcy concentrations in this group of Mexican American men (13). Data from the present study suggest that this ineffectiveness was not due to impaired choline oxidation to betaine, a fungible source of methyl groups for conversion of homocysteine to methionine through hepatic betainehomocysteine S-methyltransferase, or excessive urinary excretion of either choline or betaine (ie, <0.5% of choline was excreted in urine on the 2200 mg/d dose). These data suggest that choline is not an important source of one-carbon units for total body remethylation of homocysteine in the fasted state and are consistent with data derived from a human tracer study, showing that folate-dependent homocysteine remethylation, for which serine is the original source of one-carbon units, contributed ≈100% of the methyl groups used for total body homocysteine remethylation (34). Nonetheless, and consistent with prior reports (35, 36), choline intake modified postmethionine load plasma tHcy concentrations. In this regard, the percentage change in plasma tHcy concentrations after the methionine load was attenuated in the 1100 and 2200 mg/d groups relative to the 300 and 550 mg/d groups. Taken together these data suggest that choline availability may play a greater role in postprandial homocysteine metabolism (ie, after a high-protein diet) and is consistent with rat data showing increased betaine-homocysteine S-methyltransferase activity (≈30-40%) in response to supplemental methionine (37). However, because the amount of methionine administered in the present study (≈7 g methionine in one dose) exceeds amounts provided by a high-protein diet (≈4.5 g methionine/d) (38), the public health relevance of these findings awaits future studies examining the potential tempering effect of choline and betaine on postprandial plasma tHcy after a high-protein diet.
The graded effect of supplemental choline intake on plasma free choline suggests that plasma free choline is a specific and relatively sensitive marker of supplemental choline intake; in contrast, plasma phosphatidylcholine and sphingomyelin are not. Less is known about the relation between dietary choline intake (for which phosphatidylcholine represents a major form of choline) and status indicators. Preliminary data from our laboratory suggest that biomarkers of choline status (including plasma choline) are poor predictors of moderate changes in dietary choline consumption (39). The recent interest in assessing the relation between dietary choline intake and disease risk underscores the importance of identifying a biomarker that is predictive of dietary intake.
A potential limitation of the present study is that it was conducted in one ethnic group and in male subjects only. Thus, it is possible that different results may be obtained from studies conducted in women or different ethnic-racial groups. In this regard, it is notable that the mean fasting plasma choline concentration (ie, 6.6 ± 0.2 μmol/L) of the Mexican American men that participated in this study was slightly below the normal range of 7 to 20μmol/L (2). Another limitation was the inability to completely rule out the possibility that food and beverages other than those provided were consumed because the men were not housed in a metabolic unit.
In summary, choline intakes of 550 mg/d were sufficient in preventing elevations in serum markers of liver dysfunction among Mexican American men under the conditions of this study. However, intakes of ≥550 mg/d were required to maintain plasma phosphatidylcholine concentrations and to enhance homocysteine metabolism after a methionine load. Future studies are needed to investigate the role of choline in postprandial homocysteine metabolism and to assess the pertinence of these findings to other populations.
Acknowledgments
We thank Alexandre Ivanov for the MTHFR C677T genotyping, Sally Tran for measuring urinary creatinine, and the men who participated in this study.
Footnotes
Supported by grant S06GM053933 from the National Institute of Health and by funds from the California Agricultural Research Initiative.
REFERENCES
- 1.Best CH, Huntsman ME. The effects of the components of lecithine upon deposition of fat in the liver. J Physiol. 1932;75:405–12. doi: 10.1113/jphysiol.1932.sp002899. [DOI] [PMC free article] [PubMed] [Google Scholar]
- 2.Institute of Medicine. National Academy of Sciences . Dietary reference intakes for thiamin, riboflavin, niacin, vitamin B6, folate, vitamin B12, pantothenic acid, biotin and choline. National Academy Press; Washington, DC: 1998. [PubMed] [Google Scholar]
- 3.Zeisel SH. Dietary choline: biochemistry, physiology, and pharmacology. Annu Rev Nutr. 1981;1:95–121. doi: 10.1146/annurev.nu.01.070181.000523. [DOI] [PubMed] [Google Scholar]
- 4.Zeisel SH, Da Costa KA, Franklin PD, et al. Choline, an essential nutrient for humans. FASEB J. 1991;5:2093–8. [PubMed] [Google Scholar]
- 5.da Costa KA, Badea M, Fischer LM, Zeisel SH. Elevated serum creatine phosphokinase in choline-deficient humans: mechanistic studies in C2C12 mouse myoblasts. Am J Clin Nutr. 2004;80:163–70. doi: 10.1093/ajcn/80.1.163. [DOI] [PubMed] [Google Scholar]
- 6.Collinsova M, Strakova J, Jiracek J, Garrow TA. Inhibition of betaine-homocysteine S-methyltransferase causes hyperhomocysteinemia in mice. J Nutr. 2006;136:1493–7. doi: 10.1093/jn/136.6.1493. [DOI] [PubMed] [Google Scholar]
- 7.da Costa KA, Niculescu MD, Craciunescu CN, Fischer LM, Zeisel SH. Choline deficiency increases lymphocyte apoptosis and DNA damage in humans. Am J Clin Nutr. 2006;84:88–94. doi: 10.1093/ajcn/84.1.88. [DOI] [PMC free article] [PubMed] [Google Scholar]
- 8.Niculescu MD, Craciunescu CN, Zeisel SH. Dietary choline deficiency alters global and gene-specific DNA methylation in the developing hippocampus of mouse fetal brains. FASEB J. 2006;20:43–9. doi: 10.1096/fj.05-4707com. [DOI] [PMC free article] [PubMed] [Google Scholar]
- 9.Shaw GM, Carmichael SL, Yang W, Selvin S, Schaffer DM. Periconceptional dietary intake of choline and betaine and neural tube defects in offspring. Am J Epidemiol. 2004;160:102–9. doi: 10.1093/aje/kwh187. [DOI] [PubMed] [Google Scholar]
- 10.Reo NV, Adinehzadeh M, Foy BD. Kinetic analyses of liver phosphatidylcholine and phosphatidylethanolamine biosynthesis using (13)C NMR spectroscopy. Biochim Biophys Acta. 2002;1580:171–88. doi: 10.1016/s1388-1981(01)00202-5. [DOI] [PubMed] [Google Scholar]
- 11.Stead LM, Brosnan JT, Brosnan ME, Vance DE, Jacobs RL. Is it time to reevaluate methyl balance in humans? Am J Clin Nutr. 2006;83:5–10. doi: 10.1093/ajcn/83.1.5. [DOI] [PubMed] [Google Scholar]
- 12.Cook R. Folate metabolism. In: Carmel RJD, editor. Homocysteine in health and disease. Cambridge University Press; New York, NY: 2001. pp. 113–34. [Google Scholar]
- 13.Solis C, Veenema K, Ivanov AA, et al. Folate intake at RDA levels is inadequate for Mexican American men with the methylenetetrahydrofolate reductase 677TT genotype. J Nutr. 2008;138:67–72. doi: 10.1093/jn/138.1.67. [DOI] [PMC free article] [PubMed] [Google Scholar]
- 14.Schwahn BC, Chen Z, Laryea MD, et al. Homocysteine-betaine interactions in a murine model of 5,10-methylenetetrahydrofolate reductase deficiency. FASEB J. 2003;17:512–4. doi: 10.1096/fj.02-0456fje. [DOI] [PubMed] [Google Scholar]
- 15.Esfahani ST, Cogger EA, Caudill MA. Heterogeneity in the prevalence of methylenetetrahydrofolate reductase gene polymorphisms in women of different ethnic groups. J Am Diet Assoc. 2003;103:200–7. doi: 10.1053/jada.2003.50030. [DOI] [PubMed] [Google Scholar]
- 16.Tamura T, Mizuno Y, Johnston KE, Jacob RA. Food folate assay with protease, alpha amylase, and folate conjugase treatments. J Agric Food Chem. 1997;45:135–9. [Google Scholar]
- 17.Gregory J, Engelhardt R, Bhandari SD, Bustafson SK. Adequacy of extraction techniques for determination of folates in foods and other biological materials. J Food Compos Anal. 1990;3:134–44. [Google Scholar]
- 18.Koc H, Mar MH, Ranasinghe A, Swenberg JA, Zeisel SH. Quantitation of choline and its metabolites in tissues and foods by liquid chromatography/electrospray ionization-isotope dilution mass spectrometry. Anal Chem. 2002;74:4734–40. doi: 10.1021/ac025624x. [DOI] [PubMed] [Google Scholar]
- 19.Abratte CM, Wang W, Li R, Moriarty DJ, Caudill MA. Folate intake and the MTHFR C677T genotype influence choline status in young Mexican American women. J Nutr Biochem. 2008;19:158–65. doi: 10.1016/j.jnutbio.2007.02.004. [DOI] [PMC free article] [PubMed] [Google Scholar]
- 20.Institute of Medicine. National Academy of Sciences . Dietary reference intakes for calcium, phosphorus, magnesium, vitamin D, and fluoride. National Academy Press; Washington, DC: 1997. [PubMed] [Google Scholar]
- 21.Institute of Medicine. National Academy of Sciences . Dietary reference intakes for vitamin C, vitamin E, selenium, and carotenoids. National Academy Press; Washington, DC: 2000. [PubMed] [Google Scholar]
- 22.Institute of Medicine. National Academy of Sciences . Dietary reference intakes for vitamin A, vitamin K, arsenic, boron, chromium, copper, iodine, iron, manganese, molybdenum, nickel, silicon, vanadium, zinc. National Academy Press; Washington, DC: 2001. [PubMed] [Google Scholar]
- 23.Food and Nutrition Board . Recommended Dietary Allowances. 10th ed. National Academy of Sciences; Washington, DC: 1989. [Google Scholar]
- 24.Guinotte CL, Burns MG, Axume JA, et al. Methylenetetrahydrofolate reductase 677C→T variant modulates folate status response to controlled folate intakes in young women. J Nutr. 2003;133:1272–80. doi: 10.1093/jn/133.5.1272. [DOI] [PubMed] [Google Scholar]
- 25.Tamura T. Microbiological assay of folates. In: Picciano M, Stokstad ELR, Gregory JF, editors. Folic acid metabolism in health and disease. Wiley & Sons; New York, NY: 1990. pp. 121–37. [Google Scholar]
- 26.Frosst P, Blom HJ, Milos R, et al. A candidate genetic risk factor for vascular disease: a common mutation in methylenetetrahydrofolate reductase. Nat Genet. 1995;10:111–3. doi: 10.1038/ng0595-111. [DOI] [PubMed] [Google Scholar]
- 27.Innis SM, Hasman D. Evidence of choline depletion and reduced betaine and dimethylglycine with increased homocysteine in plasma of children with cystic fibrosis. J Nutr. 2006;136:2226–31. doi: 10.1093/jn/136.8.2226. [DOI] [PubMed] [Google Scholar]
- 28.Vester B, Rasmussen K. High performance liquid chromatography method for rapid and accurate determination of homocysteine in plasma and serum. Eur J Clin Chem Clin Biochem. 1991;29:549–54. doi: 10.1515/cclm.1991.29.9.549. [DOI] [PubMed] [Google Scholar]
- 29.Pfeiffer CM, Huff DL, Gunter EW. Rapid and accurate HPLC assay for plasma total homocysteine and cysteine in a clinical laboratory setting. Clin Chem. 1999;45:290–2. [PubMed] [Google Scholar]
- 30.Browning JD, Horton JD. Molecular mediators of hepatic steatosis and liver injury. J Clin Invest. 2004;114:147–52. doi: 10.1172/JCI22422. [DOI] [PMC free article] [PubMed] [Google Scholar]
- 31.Jacob RA, Jenden DJ, Allman-Farinelli MA, Swendseid ME. Folate nutriture alters choline status of women and men fed low choline diets. J Nutr. 1999;129:712–7. doi: 10.1093/jn/129.3.712. [DOI] [PubMed] [Google Scholar]
- 32.Fischer LM, daCosta KA, Kwock L, et al. Sex and menopausal status influence human dietary requirements for the nutrient choline. Am J Clin Nutr. 2007;85:1275–85. doi: 10.1093/ajcn/85.5.1275. [DOI] [PMC free article] [PubMed] [Google Scholar]
- 33.Dilger RN, Garrow TA, Baker DH. Betaine can partially spare choline in chicks but only when added to diets containing a minimal level of choline. J Nutr. 2007;137:2224–8. doi: 10.1093/jn/137.10.2224. [DOI] [PubMed] [Google Scholar]
- 34.Davis SR, Stacpoole PW, Williamson J, et al. Tracer-derived total and folate-dependent homocysteine remethylation and synthesis rates in humans indicate that serine is the main one-carbon donor. Am J Physiol Endocrinol Metab. 2004;286:E272–9. doi: 10.1152/ajpendo.00351.2003. [DOI] [PubMed] [Google Scholar]
- 35.Holm PI, Bleie O, Ueland PM, et al. Betaine as a determinant of postmethionine load total plasma homocysteine before and after B-vitamin supplementation. Arterioscler Thromb Vasc Biol. 2004;24:301–7. doi: 10.1161/01.ATV.0000114569.54976.31. [DOI] [PubMed] [Google Scholar]
- 36.da Costa KA, Gaffney CE, Fischer LM, Zeisel SH. Choline deficiency in mice and humans is associated with increased plasma homocysteine concentration after a methionine load. Am J Clin Nutr. 2005;81:440–4. doi: 10.1093/ajcn.81.2.440. [DOI] [PMC free article] [PubMed] [Google Scholar]
- 37.Slow S, Garrow TA. Liver choline dehydrogenase and kidney betaine-homocysteine methyltransferase expression are not affected by methionine or choline intake in growing rats. J Nutr. 2006;136:2279–83. doi: 10.1093/jn/136.9.2279. [DOI] [PubMed] [Google Scholar]
- 38.Verhoef P, van Vliet T, Olthof MR, Katan MB. A high-protein diet increases postprandial but not fasting plasma total homocysteine concentrations: a dietary controlled, crossover trial in healthy volunteers. Am J Clin Nutr. 2005;82:553–8. doi: 10.1093/ajcn.82.3.553. [DOI] [PubMed] [Google Scholar]
- 39.Abratte CM, Wang W, Li R, Axume J, Moriarty DJ, Caudill MA. Choline status is not a reliable indicator of moderate changes in dietary choline consumption in premenopausal women. J Nutr Biochem. doi: 10.1016/j.jnutbio.2007.12.002. Epub ahead of print 19 May 2008. [DOI] [PubMed] [Google Scholar]