Abstract
Reductions in gamma band phase synchrony and evoked power have been reported in schizophrenic subjects in response to auditory stimuli. These results have been observed in the EEG at one or two electrode sites. We wished to extend these results using magnetic field data to estimate the responses at the neural generators themselves in each hemisphere. Whole head magnetoencephalographic (MEG) recordings were used to estimate the phase and amplitude behavior of sources in primary auditory cortex in both hemispheres of schizophrenic and comparison subjects. Both ipsi- and contra-lateral cases were evaluated using a driving (40 Hz modulated 1 kHz carrier) and a non-driving (1 kHz tone) stimulus. We used source space projection (SSP) to collapse the magnetic field data into estimates of the time course of source strengths in individual trials. Complex wavelet based time-frequency decomposition was used to compute inter-trial phase locking factor (PLF), and mean evoked and induced amplitude for each cortical generator. Schizophrenic subjects showed reduced SSP PLF and evoked source strength for contra-lateral generators responding to the driving stimulus in both hemispheres. For the pure tone stimulus, only the left hemisphere PLF’s in the transient window were reduced. In contrast, subjects with schizophrenia exhibited higher induced 40 Hz power to both stimulus types, consistent with the reduced PLF findings. The method of SSP combined with wavelet based complex demodulation produces a significant improvement in signal-to-noise ratio, and directly estimates the activity of the cortical generators responsible for gamma band auditory MEG evoked fields. Schizophrenic subjects exhibit significant impairment of generation and phase locking of this activity in auditory cortex, suggesting an impairment of GABA-ergic inhibitory interneuronal modulation of pyramidal cell activity.
Introduction
Oscillatory neuronal electrical activity centered near 40 Hz has been hypothesized to be involved in feature binding or inter-regional communication within the brain (e.g., Freeman, 1991, Engel et al, 1997, Llinas et al, 1998). Magnetic field measurements of this activity probably reflect the behavior of excitatory pyramidal cell dendrites (Williamson and Kaufman, 1981, Murakami and Okada, 2006). The activation of these cortical cells is thought to be under the control of GABA-mediated inhibitory interneurons, possibly parvalbumin containing chandelier cells (Lewis et al, 2005). These interneurons are responsible for the timing of excitation of the pyramidal cells and hence the consequent frequency of gamma band (roughly 30 – 80 Hz) oscillation. Theories which attempt to explain the mechanisms underlying schizophrenia suggest integrative failure (e.g., Lee et al, 2003), disturbed timing (e.g., Andreasen et al, 1999), and/or a disruption of inhibition (e.g. McCarley et al, 1999). If in fact the gamma band oscillations are representative of perceptual binding then aspects of all of these processes could be measured at the macroscopic level by considering the amplitude and phase behavior of electrophysiological measures of gamma activity in response to various forms of stimulation.
Evidence for a reduction in phase synchrony and/or evoked amplitudes in auditory gamma band responses in patients with schizophrenia has been presented in a number of publications over the last decade. Kwon et al (1999) report reduced steady state response (SSR) power in response to 40 Hz click train auditory stimuli and a delayed phase onset and offset in patients relative to controls. Decreased midline EEG power was described by Brenner et al (2003) in patients with schizophrenia in response to amplitude modulated carrier tones (42 Hz modulation, 1 kHz carrier). Evoked response potentials to an auditory oddball paradigm resulted in a decrease in both frontal and left hemisphere phase synchrony in both early (−150 to 150 ms) and late (200 – 550 ms) gamma (37–41 Hz) responses in patients with schizophrenia as reported by Lee et al (2003). A similar experiment (Gallinat et al, 2004) using an auditory oddball stimulus failed to produce this result in the early (defined to be 20 – 100 ms post-stimulus) but did find a reduction in response amplitude in the late (defined as 220 – 350ms) window, and in this case the finding was specific to the right frontal region and all of the patients were un-medicated. Hong et al (2004) demonstrated a similar reduction in evoked potential amplitude to click trains (476 ms length) in un-medicated first degree relatives of schizophrenic patients, but failed to replicate the reduction in the medicated patients themselves. Most recently, Light et al (2006) report a reduction in 40 Hz evoked power and inter-trial phase coherence at electrode site Fz in patients with schizophrenia using a 500 ms click train stimulus similar to that of Kwon and colleagues.
All of the auditory studies to date have utilized EEG and have typically evaluated the gamma band activity at a limited number of electrode sites. Given the relatively small amplitude of even the SSR it is perhaps not surprising that some of the studies have produced different results. In the present study using MEG data from a whole head array we have elected to unite a complex wavelet based time-frequency decomposition with the method of source space projection (SSP), (sometimes called signal space or subspace projection , Ilmoniemi et al, 1987, Tesche et al, 1995, and “Lead Field Synthesis”, by Robinson, 1989). The use of these methods produces a significant improvement in signal-to-noise ratio in both amplitude and phase measures. In addition, these two techniques combine to yield an estimate of the electrical behavior of the neuronal sources themselves; the amplitude and phase characteristics of a single ‘virtual sensor’ (Robinson, 1989), as if one had inserted a depth electrode into the region of Heschl’s gyrus in both left and right hemispheres. The present study also used monaural presentation with both a driving (40 Hz, amplitude-modulated 1 kHz carrier) and non-driving (1 kHz pure tone) stimulus to allow both contra and ipsi-lateral cortical generators to be evaluated, in both conditions. Unlike many MEG source reconstruction efforts the SSR is the result of two reasonably focal sources, albeit one in each hemisphere, that are well modeled by single equivalent current dipoles (ECD) (Hari and Makela, 1987, Pantev, et al, 1995, Ross, et al, 2000, Teale, et al, 2003). Some sort of a-priori information about the source(s) location and orientation is required for the SSP procedure and for the SSR this is nicely satisfied using the ECD results estimated from the band-passed average of the data.
We hypothesized, based on previous reports in the EEG literature, that MEG measures of amplitude and phase-locking of 40 Hz gamma-band responses would be significantly reduced in subjects with schizophrenia when conducting the analysis in brain space. Since conducting the analysis in source space allowed us to separate left and right hemisphere generators, we also predicted that the left hemisphere gamma-band measures would indicate relatively greater dysfunction in the schizophrenia group than the right hemisphere measures, based upon previous studies suggesting disturbed left hemisphere function in schizophrenia.
Methods
Subjects
We studied 15 patients with schizophrenia (mean duration of illness 12.6 ± 7.6 years, 13 male, mean age 37.9 ± 9.3) and 15 comparison subjects (12 male, mean age 34.8 ± 8.0). Age was not significantly different between the groups, a fact that is important as we have previously reported an increase in steady state auditory evoked field amplitudes with increasing age (Rojas et al, 2004). Diagnosis was determined using a combination of information from medical records and the use of the Structured Clinical Interview for DSM-IV (SCID) (First et al, 1995). Symptom severity in the schizophrenia group was assessed using the Brief Psychiatric Rating Scale, 24 item version (BPRS-24, Ventura et al, 2000). The mean total BPRS-24 was 34.23 (+/− 7.8).
Subjects were excluded if they had any history of neurological disorders, head trauma, current substance abuse, or central nervous system dysfunction. Comparison subjects also were required to have no history of Axis I disorder and no first-degree relatives with an Axis I disorder. All patients were medicated with antipsychotic agents. All people in the schizophrenia group were taking at least one atypical antipsychotic medication, three were taking a typical antipsychotic as well, and nine were also taking antidepressants. Mean chlorpromazine equivalent dose for those medications for which this estimate is available was 499 mg. Two of the comparison subjects and two of the patients were primarily left-handed as determined by the Annett Handedness Scale (Annett, 1985). Following a full explanation of the experimental procedures, written informed consent was obtained from all subjects in accordance with the guidelines of the Colorado Multiple Institutional Review Board. Immediately prior to the start of MEG recording a hearing threshold test was administered to each subject to determine the individual 1 kHz amplitude detection thresholds for each ear.
Stimuli
Two different stimuli were employed, one to drive the auditory system to entrain and accentuate the gamma band response and a second to produce what has been termed a ‘transient’ gamma band response which is thought to accompany most auditory responses. In the first case we used a 1 kHz sine wave, amplitude modulated (100%) at 40 Hz with a 500 ms duration. The formula f(t) = A sin(2 π(1000)t) [1 − cos(2 π(40)t + π/2)], was used to generate WAV format sound files with 16 bit quantization. The second stimulus was produced using f(t) = A sin(2 π(1000)t), thus generating a pure non-modulated 1 kHz sine wave. In both experiments the sounds were reproduced every 3.5 seconds for a total of 200 plus trials. Sound amplitudes were set to 60 db Hearing Level using the thresholds measured at the start of the session. Stimuli were presented monaurally using a Creative Labs Sound Blaster AWE64 sound card with EAR Tone 3A transducers (Cabot Safety Systems, Indianapolis) and about 6.25 m of polyurethane tubing (4.75 mm id) with foam insert earpieces. Triggers for MEG data acquisition were delayed to coincide with the arrival of sound at the earpiece.
MEG Recording
Magnetic field data were recorded using a whole head array of 248 axial gradiometers with 1.8 cm diameter coils on 5 cm baselines (Magnes 3600 WH Biomagnetometer, 4-D Neuroimaging, San Diego). Subjects were recorded in a supine position while watching a silent video throughout the session to insure a reasonable state of alertness. MEG data was acquired in 800 ms epochs, sampled at 678.17 Hz, with a 200 ms pre-stimulus baseline. The initial bandwidth was 0.1 to 200 Hz.
Data Analysis
Minimal noise, artifact free epochs from the driving condition were averaged, band-pass filtered from 35 to 45 Hz (4th order Butterworth, forward and backward filter), and DC offset corrected relative to the mean of the pre-stimulus data in each channel. A single moving current dipole was employed to model the band-passed, average data for each hemisphere for both contra-lateral and ipsi-lateral stimulation conditions across the post-stimulus time window (250 – 500 ms). Dipole fits in each hemisphere were computed using 37 channels clustered around the midpoint of a line connecting those channels with the minimum and maximum field amplitudes. Best fit sphere center coordinates were determined by fitting a sphere to the projection of these same 37 channels to the digitized head shape surface.
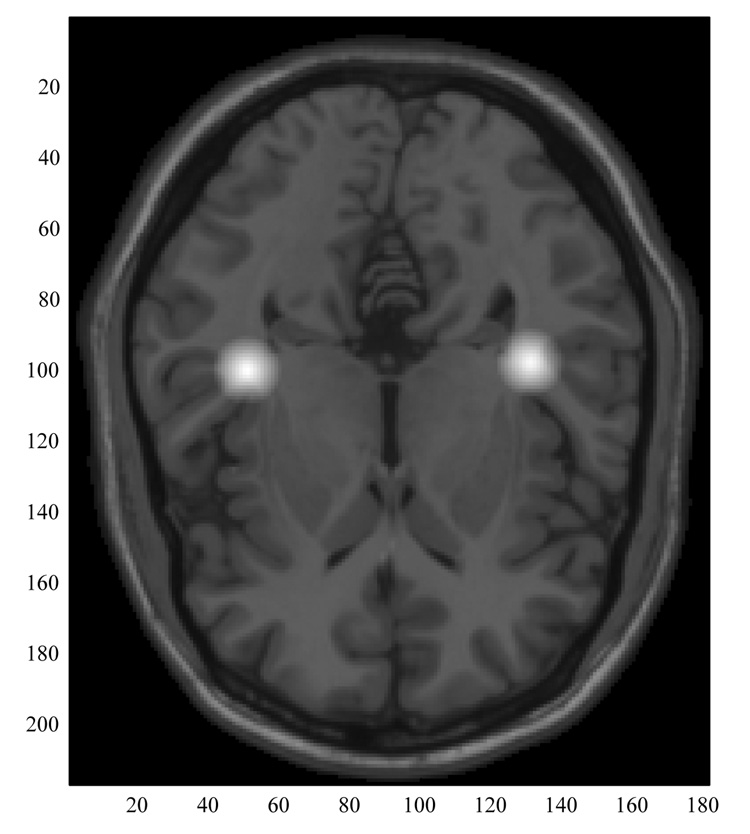
A search was then made through each of the resulting parameter sets to identify sources that best modeled the auditory steady state response by averaging those dipole parameters for which the following criteria were met: in a 25 ms window the RMS field amplitude was the largest, and for that same time point, the x coordinate was within ± 5 cm, the y coordinate had an absolute value between 2 and 7 cm, the z coordinate was between 2 and 7 cm, and the goodness-of-fit was greater than 0.9. This process effectively detects the peak responding dipoles with one peak for each maxima (or minima) in the stimulus modulation sine wave. Thus there would be a maximum of 20 dipoles in the 250 ms window. In fact the average number selected was 17 ± 4.7. The means of the parameters (x,y,z, qx, qy, qz) for each peak dipole were then used to create an ‘average’ dipole for the SSR generator. Figure one shows these dipoles (contralateral sources) averaged across all 30 subjects, superimposed on the correct axial slice taken from the Montreal Neurological Institute’s average MRI.
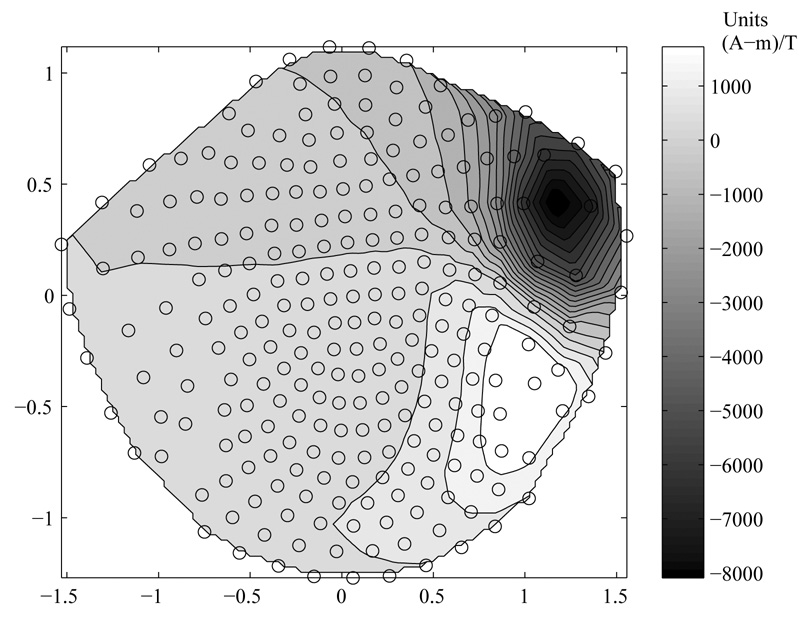
The magnetic field data B(r) produced by the SSR generator(s) (where r is the position vector for the sensor coils) is well modeled by a single current dipole in each hemisphere. Hence it is well suited to the method of source space projection wherein a known dipole located at rq, with strength vector, q(rq) is used along with the pseudo inverse of the lead field matrix for the sensor array L(rq, r) to create a single waveform q(t) = B(r,t) • L−1 (rq, r) • (q(rq) /| q(rq) |) (see Ross, et al 2000 for this nomenclature). This waveform is an estimate of the magnitude of the current flow x dipole length versus time at the generator location, i.e., the source strength over time. There are several advantages to this procedure; 1) all of the MEG sensors can be used as the resulting spatial filter will down-weight the contributions of sensors far from the source, 2) the resulting q(t) waveforms are independent of the coordinate system and hence lend themselves to group averaging/comparisons, 3) there is a gain in signal-to-noise ratio (Ross et al reported a factor of ~2 when comparing q(t) to the peak field channel, Ross et al, 2000) as the contribution of all weighted sensor outputs is summed together and unrelated (noise) activity is down-weighted. In this study we used the averaged dipole data as described above to estimate the source location rq and the source strength, q(rq), and then computed the q(t) time series for each epoch. This was done for both conditions, i.e., for both the driven (modulated carrier) and the pure tone stimuli, using the dipole estimates for the SSR generators. An example of this spatial filter application is shown below in figure two. Here the topography of the ‘weight vector’ coefficients has been reproduced in a top down view. These multipliers are applied to each channel in the q(t) computation above as the dot product of B and W, with W = L−1 (rq, r) • (q(rq) / |q(rq)|).
The source strength estimates, q(t), for each epoch, were then convolved with complex Morlet’s wavelets, with wave number = 7, (w# = f / σf and σf = 1 / (2 πσt) ), and f = 40 Hz (Talon-Baudry et al, 1996). These values produced a bandwidth of 11.4 Hz and wavelet duration of 55.7 ms. The modulus of the mean across trials of the convolution normalized by its modulus produces a single number ranging from 0 to 1 which Tallon-Baudry et al, have named the phase locking factor (PLF) as:
If there were no consistency across trials the PLF would approach 0 whereas if every trial produced q(t)’s that were identical, the PLF would be 1.0. We have simulated data with ~200 trials of random phase and calculated PLFs of about 0.08. This method results in a PLF for each time point and has several benefits; 1.) data are normalized which makes group averaging/comparing possible, 2.) it is independent of response amplitude, and 3.) it is relatively unaffected by most artifacts. If one computes the modulus of the mean of the convolutions across trials the result is the envelope of the evoked amplitude of the response at that frequency as:
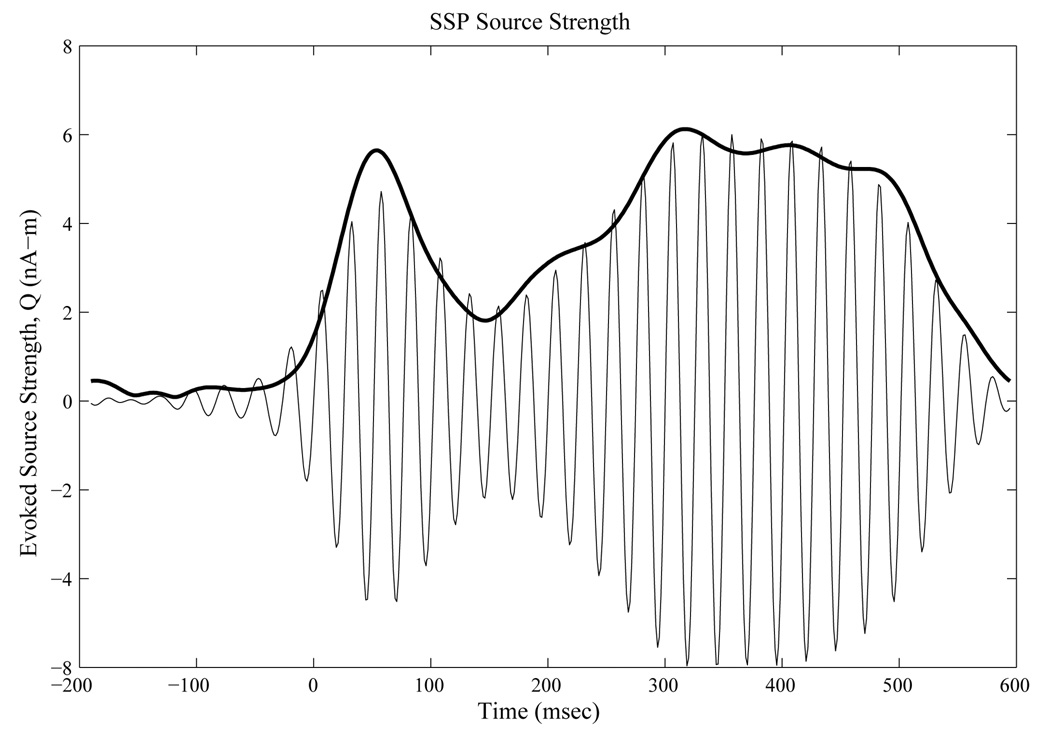
A representative subject’s evoked mean q(t) and the envelope at 40 Hz are shown in figure three below.
The total spectral source strength envelope can be estimated by computing the mean of the individual trial magnitudes of the convolutions as:
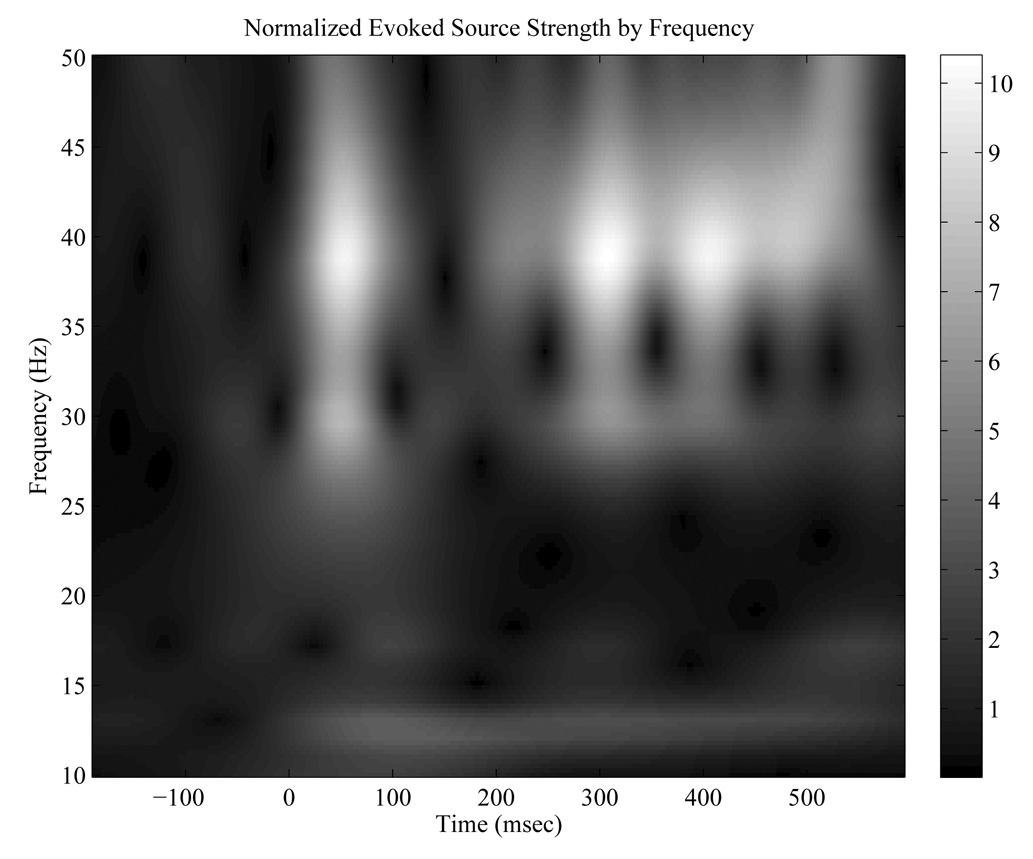
The difference (total – evoked) of these two quantities is sometimes called the induced amplitude, and is a measure of time-locked, but not phase-locked, activity. Using these methods phase locking factor, normalized evoked and induced source strength amplitudes over time were computed for both ipsi-lateral and contra-lateral hemispheres for both SSR and pure tone conditions. Evoked and induced source strengths were normalized by dividing the q(t,f) data by the mean q(t,f) across time in the pre-stimulus baseline. We divided the response window into two different regions; 1.) the transient gamma band from 20 to 100 ms post-stimulus, and 2.) the SSR interval from 200 to 500 ms post-stimulus. Means for the two variables were computed in each of these windows and used for statistical comparisons. All computations with regard to source space projection (q(t)’s), phase locking factor, and evoked and induced q(t,f)’s were made using our own software in MATLAB (the MathWorks, Inc., Natick, Mass). Figure 4 shows a representative subject’s normalized evoked q(t,f)’s at frequencies from 10 to 50 Hz resulting from the steady state response
Figure 4.
Time-Frequency Transform from 10 to 50 Hz of a representative subject’s SSP evoked source strength, Q(t), steady state stimulation, ~ 200 trials, normalized to the pre-stimulus baseline (−200 to 0 ms) mean for each frequency.
Results
Steady-State Stimulation
For the amplitude-modulated stimulus, it was expected that both a transient and steady-state gamma-band response would be present. A 2 × 2 × 2 × 2 mixed design ANOVA (group by type of gamma by ear by hemisphere) was evaluated separately for evoked source strength, induced source strength and for PLF.
For evoked source strength, all of the main effects were significant. First, a significant main effect of diagnosis (F(1,28)=7.20, p<.02) indicated that the control group had higher gamma source strengths than the schizophrenia group. There was also a significant hemisphere main effect, F(1,28)=8.21, p < .01, indicating greater strength in the right hemisphere than the left. A significant main effect of ear of stimulation demonstrated that the left ear produced greater evoked source strength than right ear stimulation, F( 1,28)=8.84, p=.006. Finally, there was a main effect of gamma type, F(1,28)=21.37, p < .001, indicating that steady state gamma responses were larger than transient responses. Several interaction terms were significant, however, warranting caution in a straightforward interpretation of the main effects. First, a significant ear of stimulation by hemisphere interaction was noted, F(1,28)=18.70, p<.001, suggesting that although contralateral stimulation led to greater normalized source strength in the right hemisphere compared to right ear stimulation, there was little, if any, difference for the left hemisphere between ipsilateral and contralateral stimuli. Further, there was a significant ear of stimulation by hemisphere by type of gamma interaction, indicating that the previous effect was driven primarily by the steady state gamma, F(1,28)=20.03, p<.001. There were no significant interactions for the group factor at .05 alpha.
For induced source strength, there were significant main effects of diagnosis (F(1,28)=7.01, p <.02), gamma type (F(1,28)=28.80, p<.001) and hemisphere (F(1,28)=9.88, p=.004), indicating greater induced power in the schizophrenia group than in controls, in the transient window relative to the steady state window, and in the left compared to right hemispheres. Induced power appeared to be higher for ipsilateral than contralateral responses, as indicated by a significant ear by hemisphere interaction, F(1,28)=58.85, p<.001. The diagnosis by ear by hemisphere term was not significant, F(1,28)=3.81,p=.06, but might suggest that the ipsilateral dominance of induced power was primarily seen in control subjects. Finally, a significant gamma type by hemisphere term (F(1,28)=31.15, p<.001) indicated that greater induced power in the left hemisphere was observed only during the steady state window.
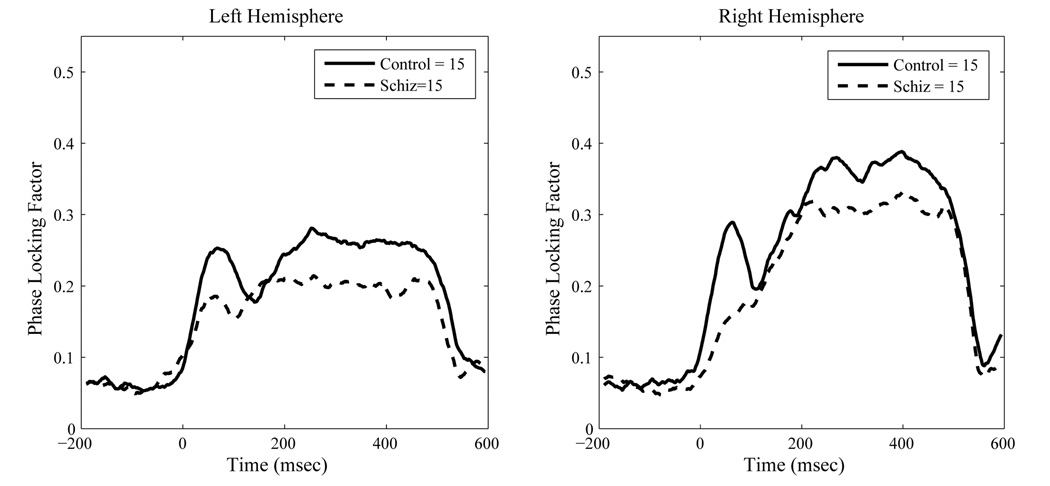
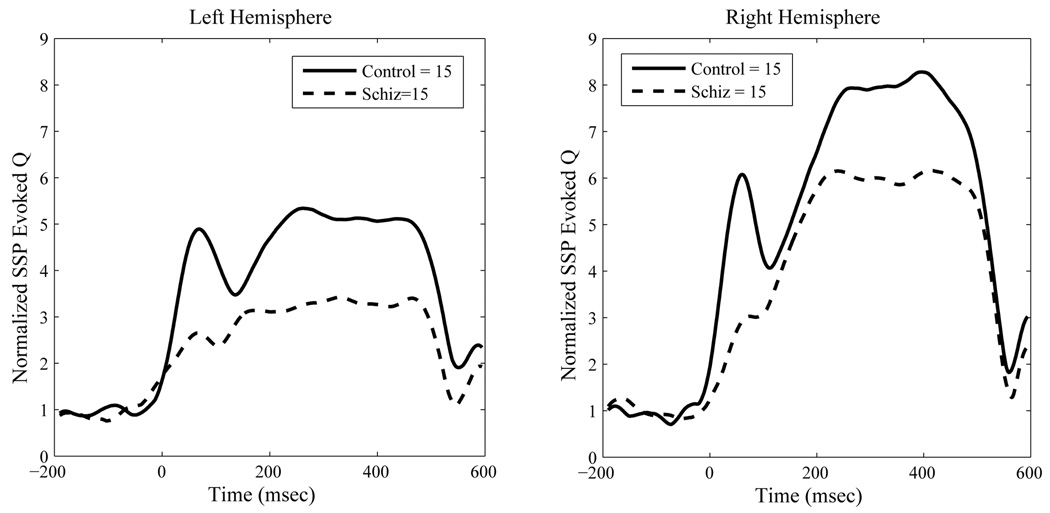
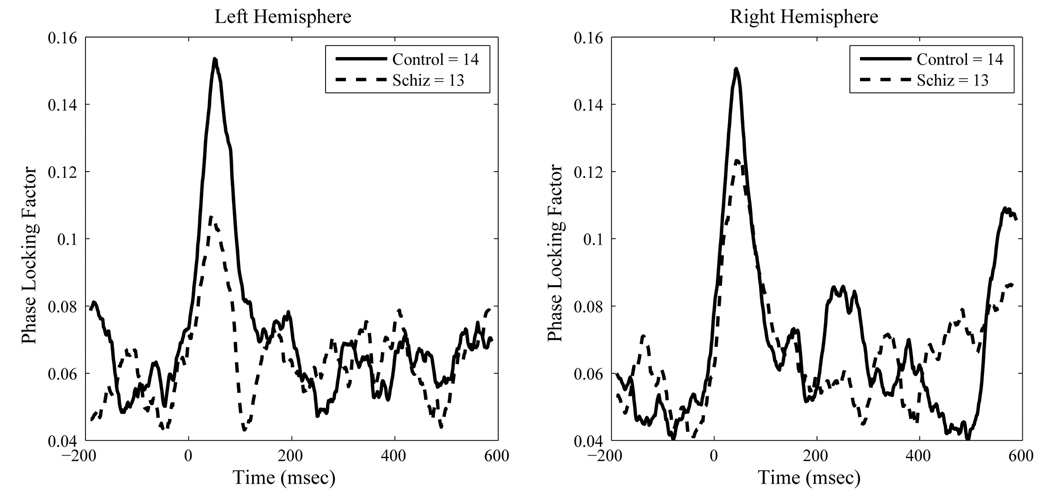
For PLF the schizophrenia group had significantly reduced values relative to controls, F(1, 28)=6.56, p < .02. As with source strength, we observed a significant effect of hemisphere on PLF, F(1,28)= 13.73, p < .001, indicating greater right than left hemisphere phase-locking. A significant ear by hemisphere effect, F(1,28)=86.57, p < .0001, indicated greater phase-locking in the hemisphere contralateral to ear of stimulation, relative to ipsilateral stimulation. A significant diagnosis by hemisphere by ear effect, F(1,28) = 6.09, p < .02, indicated that the contralateral ear advantage was reduced in the schizophrenia group, however. A significant main effect of gamma type indicated that the steady-state gamma PLF was stronger than the transient PLF, F(1,28)=28.88, p < .0001. However, a significant hemisphere by type interaction, F(1,28)=26.31, p<.0001, indicated that this hemisphere difference was significantly more pronounced for the steady-state PLF region than the transient region. Finally, a significant ear by gamma type interaction, F(1,28)=4.39, p < .05, combined with a significant 3-way interaction between ear, hemisphere and gamma-type (F(1,28)=14.99, p < .001), indicated that the differences between left and right hemispheres were restricted to the steady-state PLF region and most pronounced for right ear stimulation. Figure 5 and Figure 6 show the group mean contra-lateral PLF and evoked source strength waveforms across time for both hemispheres.
Figure 5.
Contralateral Source Space Projected Inter-trial Phase Locking Factors at 40 Hertz to Steady State Stimulation. Data are group means.
Figure 6.
Contralateral Source Space Projected Evoked Source Strength at 40 Hertz to Steady State Stimulation. Data are group means.
Pure Tone Stimuli
A 2×2×2 mixed design ANOVA (group by ear by hemisphere) was evaluated separately for the transient gamma band evoked source strength and PLF. A significant ear by hemisphere effect, F(1,25) = 7.93, p < .01, suggested that contralateral ear stimulation produced higher evoked amplitudes than ipsilateral stimulation. No other significant effects were noted for source strength. Note that due to either poor data quality or subject dropout the number of subjects in the schizophrenia group was reduced by two, and the number of controls reduced by one, for the pure tone condition.
For the pure tone induced power data, no significant main effects were observed (all p>.15). A significant diagnosis by hemisphere interaction was noted, F(1,25)=4.71, p<.05, indicating that while there were no differences in induced power between the two hemispheres for control subjects, induced power was higher in the left than right hemisphere in the schizophrenia group. In addition, there was a significant ear by hemisphere term, F(1,25)=8.17, p<.01, indicating that ipsilateral induced response power was higher than contralateral induced response power.
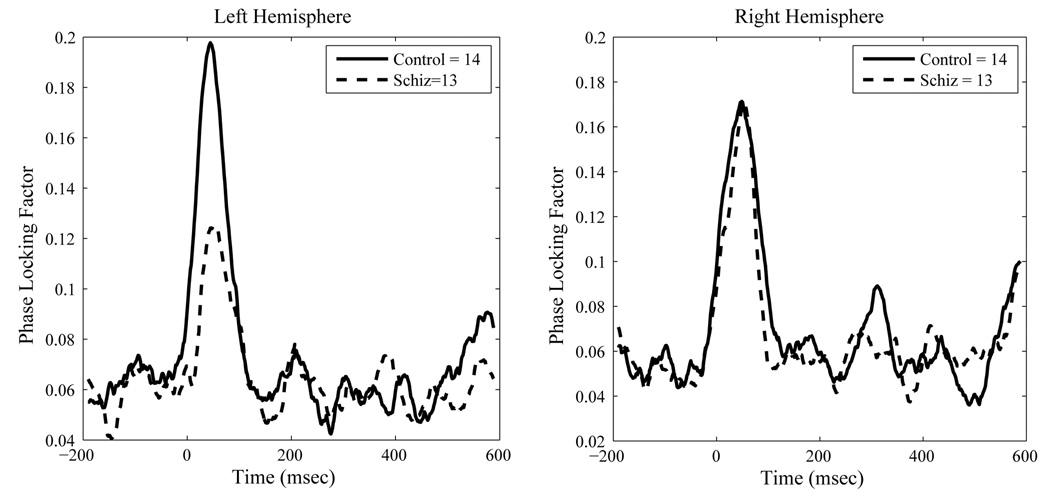
For the pure tone transient PLF, a significant interaction effect for ear by hemisphere was also noted, F(1, 25)=6.90, p < .02, indicating a contralateral ear of stimulation advantage. A strong trend for a significant diagnosis by hemisphere term was also observed, F(1,25) = 4.13, p < .06, suggesting the possibility of a reduction in PLF in the left, but not right, hemisphere for the schizophrenia group. No other effects reached significance at .05 alpha. Figure 7 and Figure 8 show the group mean PLF data for the pure tone contra and ipsi-lateral sources.
Figure 7.
Contralateral Source Space Projected Inter-trial Phase Locking Factors at 40 Hz to Pure Tone Stimulation. Data are group means.
Figure 8.
Ipsilateral Source Space Projected Inter-trial Phase Locking Factors at 40 Hz to Pure Tone Stimulation. Data are group means.
There were no significant correlations between the BPRS-24 total scores or chlorpromazine equivalents and any of the 40 Hz measures for the AM stimulus or pure tone stimulus after Bonferoni correction for multiple comparisons. Further, no significant correlations, before or after Bonferoni correction, were present for smoking pack-years and any of the 40 Hz measures.
Discussion
The results of this study indicate a dysfunction in the production and/or regulation of gamma band activity generated in AI cortex by auditory stimulation in patients with schizophrenia. We found the patients with schizophrenia to have deficits in both source strength and phase locking of evoked gamma activity produced by auditory stimulation that may be more pronounced in the left hemisphere. These deficits may reflect impairment of GABA-ergic inhibitory interneuron regulation of cortical pyramidal cell activity, and /or reductions in either or both cell types. Interestingly, induced gamma (non-phase-locked) power was increased in schizophrenia, suggesting that the generation of 40Hz signals may not be impaired in schizophrenia, but perhaps it may be the timing of cortical gamma band activity with respect to external stimulation that is impaired.
The search for objective physiological differences between schizophrenic and control populations has always been complicated by the heterogeneity of the syndrome and more recently by the somewhat more successful pharmacological treatments which may tend to normalize such differences. We believe that the combination of SSP and wavelet based complex demodulation yields a major improvement in statistical consistency and signal-to-noise ratio for estimating the gamma band behavior of the cortical sources responsible for auditory evoked fields and would therefore be more likely to reveal group differences if they exist. Furthermore, by having used monaural stimuli we were able to evaluate both contra and ipsi-lateral generators. It seems intuitively reasonable that the driving stimulus would evoke a larger cortical response, most likely exciting a larger group of neurons, and maintaining that response over a longer interval. As a consequence it might be expected to be more revealing of possible differences between subject groups. In this case there were decreases in both phase locking factor and evoked source strength for both the transient and SSR time windows in the subjects with schizophrenia for the contra-lateral generators. Both left and right hemispheres were affected. It is interesting that the pure tone experiment produced no significant group differences but a strong trend suggested a left hemisphere deficit for the patient group. Furthermore this potential finding was specific to the inter-trial PLF and induced strength, and did not manifest in the evoked strength. We might speculate that this situation is more characteristic of the typical case (i.e., we were not stimulating at the preferential ‘resonant’ rate) wherein a burst of gamma band dendritic current may serve as an information carrier for other cortical regions (Freeman, 1991).
All of our patients were medicated and all but one were taking at least one atypical antipsychotic. The role of specific medications in influencing MEG based metrics of this type is unknown, although current thinking supports the concept that antipsychotic medications may serve to normalize otherwise disturbed function. Of note is the publication by Hong et al. (2004) which reported significantly higher 40 Hz EEG power in their atypically medicated schizophrenic subjects compared to those taking conventional antipsychotics. If these findings can be extrapolated to MEG it would suggest that, if anything, the effects of atypical antipsychotic medication would be to reduce differences we observed between the groups.
Left ear stimulation gave rise to the largest normalized evoked source strength in the right hemisphere for both groups for the SSR generator. This finding represents a replication of the work reported by Ross and colleagues (Ross, et al, 2005) in normal control subjects. We have expanded previous work in the field to demonstrate that in general, there is a contralateral dominance for evoked, or phase-locked responses, and ipsilateral dominance for induced, or non-phase-locked responses. This suggests a direct trade-off of the two forms of stimulus driven power in auditory experiments, perhaps reflecting the relatively greater contralateral dominance of afferents to the auditory cortex.
Progress has been made recently in attributing gamma-band electrophysiology to distinct cortical mechanisms. Pyramidal cell glutamatergic input to inhibitory interneurons, particularly those expressing the calcium-binding protein parvalbumin (PV), results in the recurrent and phasic inhibitory modulation of those same pyramidal cells (Bartos et al, 2007, Gloveli et al, 2005, Hajos et al, 2004, Whittington et al, 1995). PV expressing interneurons, particularly the basket cells, appear to play a critical role in this inhibitory modulation via GABAA-receptor mediated neurotransmission (reviewed by Bartos et al, 2007). The timing of the inhibitory modulation that results in gamma-band frequency output from the principal cells is thought to partly result from the inhibitory synaptic conductances of the interneuron-principal cell synapses (Brunel and Wang, 2003). Recent evidence suggests that autaptic synapses from PV-staining interneurons regulates the spike timing of both the interneurons themselves and the pyramidal cells they synapse with (Bacci and Huguenard, 2006). Indeed, GABAA-receptor mediated hyperpolarization is known to phase-reset principal neuron oscillations, which would have the precise effect of increasing phase-locking to stimuli (e.g., see Mann and Paulsen, 2007).
Given the findings discussed above it is interesting to note the work reported by Pierri and colleagues (Pierri, 1999), wherein they analyzed the density of chandelier neuron axon terminals in specimens obtained during autopsies of schizophrenic and control subjects. They found decreased chandelier cell densities in dorsolateral prefrontal cortex (DLPFC) in the left hemisphere (the right hemisphere was not used) in the patient group. In a second study using the same specimens Konopaske et al examined the left auditory association cortex (area 42) (Konopaske et al, 2006) and found a non-significant reduction in chandelier neuron axes in the disease group. However the density reduction (~ 10 % lower than the controls) was comparable to the finding in DLPFC and the authors concluded that the effect might not be limited to a single cortical region. Although the primary auditory cortex was not examined in this study we could speculate that a similar decrement in that area would account for the decreased phase locking that we observed.
Recently, using postmortem tissue samples from the left hemisphere, Sweet and colleagues (Sweet, et al, 2007) have reported reduced pyramidal cell somal volumes in the auditory cortices of schizophrenic subjects. They speculate that this finding may be reflective of a reduced population of excitatory thalamocortical and intrinsic axon terminals and might explain some of the known auditory problems experienced by schizophrenics. Such a reduction could certainly account for the differences reported here, especially with respect to reduced cortical source strength. Even more recently this same group has reported a reduction in dendritic spine density in both primary and associative auditory cortices (Sweet, et al, 2008) in the same group of subjects. The SSR has been postulated to represent the activation of a resonant loop between the auditory cortex and the thalamus (e.g., Ribary et al, 1991), and hence a deficit in the pyramidal cell, and/or dendritic spine density, should result in smaller evoked cortical strength estimates as observed here. On the other hand, induced power was observed to be higher in the schizophrenia group, suggesting that the generation of 40 Hz signals is not impaired per se, in schizophrenia; rather, it is the timing of cortical gamma-band activity to external stimulation that is impaired. This type of timing disruption is predicted from inhibitory interneuronal deficits in schizophrenia. In a recent computational paper, Vierling-Claasen et al, (2008) provided network modeling evidence that extended inhibitory signal decay times alter the frequency of pyramidal cell output, reducing gamma-band frequencies.
Schizophrenia may in part be a consequence of dysfunctional inhibitory mechanisms, inability to integrate information, some form of timing dysregulation, or all, or some of these together. We believe that groups of cortical pyramidal cells produce the magnetic fields measured in MEG, and that these cells are themselves involved in a feedback loop with inhibitory interneurons (McCarley et al, 1999, Lewis et al, 2005). The gamma band MEG is likely the result of the alternating excitation/inhibition interaction of these cell types. If there were a malfunction in this feedback loop we would expect a reduction in both gamma band amplitude and inter-trial phase synchrony such as that which we have reported here.
Figure 1.
Steady State Response Dipoles (all 30 subjects’ contralateral source locations averaged) superimposed on the appropriate axial MRI slice taken from the Montreal Neurological Institute’s average brain (Montreal Neurological Institute, Montreal, Quebec, Canada). The contralateral average dipole coordinates (in mm) were for the left hemisphere: −40, −29, 6 in the MNI system (−2.6, 38.7, 52.9 in the MEG system, x positive through the left pre-auricular, y positive anterior) with average direction cosines of .71, .03, .70, and for the right hemisphere: 40, −32, 7 (− 1.3, −42.4, 51.4 MEG) with average direction cosines of .64, .12, .76.
Figure 2.
Source Space Projection Weight Vector (W) Topography (Open Circles are MEG sensor coils). Units are A-m/T. W is the dot product of the pseudo inverse lead field matrix (L−1) and the orientation of the equivalent current dipole source (the strength vector q divided by its magnitude).
Figure 3.
Source Space Projected Band-Passed (35–45Hz) Evoked Source Strength Q(t) in blue. Demodulated envelope of Evoked Q(t) at 40 Hz in red.
Acknowledgements
This research was supported by National Institute of Mental Health grant no. MH47476
Footnotes
Publisher's Disclaimer: This is a PDF file of an unedited manuscript that has been accepted for publication. As a service to our customers we are providing this early version of the manuscript. The manuscript will undergo copyediting, typesetting, and review of the resulting proof before it is published in its final citable form. Please note that during the production process errors may be discovered which could affect the content, and all legal disclaimers that apply to the journal pertain.
References
- Andreasen NC, Nopoulos P, O’Leary DS, Miller DD, Wassink T, Flaum M. Defining the phenotype of schizophrenia: cognitive dysmetria and its neural mechanisms. Biol. Psychiatry. 1999;46:908–920. doi: 10.1016/s0006-3223(99)00152-3. [DOI] [PubMed] [Google Scholar]
- Annett M. Left, Right, hand and brain: The right shift theory. Hillsdale NJ: Lawrence Erlbaum Associates; 1985. [Google Scholar]
- Bacci A, Huguenard JR. Enhancement of spike-timing precision by autaptic transmission in neocortical inhibitory interneurons. Neuron. 2006;49(1):119–130. doi: 10.1016/j.neuron.2005.12.014. [DOI] [PubMed] [Google Scholar]
- Bartos M, Vida I, Jonas P. Synaptic mechanisms of synchronized gamma oscillations in inhibitory interneuron networks, Nature Reviews. Neuroscience. 2007;Vol 8 doi: 10.1038/nrn2044. [DOI] [PubMed] [Google Scholar]
- Brenner CA, Sporn O, Lysaker PH, O’Donnell BF. EEG Synchronization to Modulated Auditory Tones in Schizophrenia, Schizoaffective Disorder, and Schizotypal Personality Disorder. Am J Psychiatry. 2003;160:2238–2240. doi: 10.1176/appi.ajp.160.12.2238. [DOI] [PubMed] [Google Scholar]
- Engel AK, Roelfsema PR, Fries P, Brecht M, Singer W. Role of the temporal domain for response selection and perceptual binding. Cereb. Cortex. 1997;7:571–582. doi: 10.1093/cercor/7.6.571. [DOI] [PubMed] [Google Scholar]
- First MB, Spitzer RL, Gibbon M, Williams JBW. Structured Clinical Interview for DSM-IV Axis I Disorders, Patient Edition (SCID-P), version 2. NY: New York State Psychiatric Institute, Biometrics Research; 1995. [Google Scholar]
- Freeman WJ. The Physiology of Perception. Scientific American. 1991;264(2):78–85. doi: 10.1038/scientificamerican0291-78. [DOI] [PubMed] [Google Scholar]
- Gallinat J, Winterer G, Herrmann CS, Senkowski D. Reduced Oscillatory gamma-band responses in unmedicated schizophrenic patients indicate impaired frontal network processing. Clin Neurophysiology. 2004;115:1863–1874. doi: 10.1016/j.clinph.2004.03.013. [DOI] [PubMed] [Google Scholar]
- Gloveli T, Dugladze T, Saha S, Monyer H, Heinemann U, Traub RD, Whittington MA, Buhl EH. Differential involvement of oriens/pyramidale interneurons in hippocampal network oscillations in vitro. J. Physiol. 2005;562.1:131–147. doi: 10.1113/jphysiol.2004.073007. [DOI] [PMC free article] [PubMed] [Google Scholar]
- Hajos N, Palhalmi J, Mann EO, Nemeth B, Paulsen O, Freund TF. Spike timing of distinct types of GABAergic interneuron during hippocampal gamma oscillations in vitro. The Journal of Neuroscience. 2004;24(41):9127–9137. doi: 10.1523/JNEUROSCI.2113-04.2004. [DOI] [PMC free article] [PubMed] [Google Scholar]
- Hari R, Makela JP. Evoked Potentials III. Boston: Butterworths; 1987. Neuromagnetic studies of the human auditory cortex; pp. 130–135. [Google Scholar]
- Hong LE, Summerfelt A, McMahon R, Adami H, Francis G, Elliot A, Buchanan RW, Thaker GK. Evoked gamma band synchronization and the liability for schizophrenia. Schizophrenia Research. 2004;70:293–302. doi: 10.1016/j.schres.2003.12.011. [DOI] [PubMed] [Google Scholar]
- Ilmoniemi RJ, Williamson SJ, Hostetler WE. Biomagnetism ’87. Tokyo Denki University Press; 1987. New method for the study of spontaneous brain activity; pp. 182–185. [Google Scholar]
- Konopaske GT, Sweet RA, Wu Q, Sampson A, Lewis DA. Regional specificity of chandelier neuron axon terminal alterations in schizophrenia. Neuroscience. 2006;138:189–196. doi: 10.1016/j.neuroscience.2005.10.070. [DOI] [PubMed] [Google Scholar]
- Kwon JS, O’Donnell BF, Wallenstein GV, Greene RW, Hirayasu Y, Nestor PG, Hasselmo ME, Potts GF, Shenton ME, McCarley RW. Gamma Frequency-Range Abnormalities to Auditory Stimulation in Schizophrenia. Arch Gen Psychiatry. 1999;56:1001–1005. doi: 10.1001/archpsyc.56.11.1001. [DOI] [PMC free article] [PubMed] [Google Scholar]
- Lee KH, Williams LM, Breakspear M, Gordon E. Synchronous Gamma activity: a review and contribution to an integrative neuroscience model of schizophrenia. Brain Research Reviews. 2003;41:57–78. doi: 10.1016/s0165-0173(02)00220-5. [DOI] [PubMed] [Google Scholar]
- Lee KH, Williams LM, Haig A, Gordon E. “Gamma (40Hz) phase synchronicity” and symptom dimensions in schizophrenia. Cog Neuropsychiatry. 2003;8(1):57–71. doi: 10.1080/713752240. [DOI] [PubMed] [Google Scholar]
- Lewis DA, Hashimoto T, Volk DW. Cortical Inhibitory Neurons and Schizophrenia. Nature Reviews. 2005;6:312–324. doi: 10.1038/nrn1648. [DOI] [PubMed] [Google Scholar]
- Light GA, Hsu JL, Hsieh MH, Geyer-Gomes K, Sprock J, Swerdlow NR, Braff DL. Gamma Band Oscillations Reveal Neural Network Cortical Coherence Dysfunction in Schizophrenic Patients. Biol. Psychiatry. 2006;60:1231–1240. doi: 10.1016/j.biopsych.2006.03.055. [DOI] [PubMed] [Google Scholar]
- Llinas R, Ribary U, Contreras D, Pedroarena C. The neuronal basis for consciousness. Phil. Trans. R. Soc. Lond. B. 1998;353:1841–1849. doi: 10.1098/rstb.1998.0336. [DOI] [PMC free article] [PubMed] [Google Scholar]
- Mann EO, Paulsen O. Role of GABAergic inhibition in hippocampal network oscillations. Trends Neurosci. 2007;30(7):343–349. doi: 10.1016/j.tins.2007.05.003. [DOI] [PubMed] [Google Scholar]
- McCarley RW, Niznikiewicz MA, Salisbury DF, Nestor PG, O’Donnell BF, Hirayasu Y, Grunze H, Greene RW, Shenton ME. Cognitive dysfunction in schizophrenia: unifying basic research and clinical aspects. Eur. Arch. Psychiatry Clin Neurosci. 1999;249 Suppl. 4:IV/69–IV/82. doi: 10.1007/pl00014188. [DOI] [PMC free article] [PubMed] [Google Scholar]
- Murakami S, Okada Y. Contributions of principal neocortical neurons to magnetoencephalography and electroencephalography signals. J Physiol. 2006;575.3:925–936. doi: 10.1113/jphysiol.2006.105379. [DOI] [PMC free article] [PubMed] [Google Scholar]
- Pantev C, Bertrand O, Eulitz C, Verkindt C, Hampson S, Schuierer G. Specific tonotopic organizations of different areas of the human auditory cortex revealed by simultaneous magnetic and electric recordings. Electroencephalogr Clin Neurophysiol. 1995;94:26–40. doi: 10.1016/0013-4694(94)00209-4. [DOI] [PubMed] [Google Scholar]
- Pierri JN, Chaudry AS, Woo TW, Lewis DA. Alterations in Chandelier Neuron Axon Terminals in the Prefrontal Cortex of Schizophrenic Subjects. Am J Psychiatry. 1999;156(11):1709–1719. doi: 10.1176/ajp.156.11.1709. [DOI] [PubMed] [Google Scholar]
- Ribary U, Ioannides AA, Singh KD, Hasson R, Bolton JP, Lado F, et al. Magnetic Field Tomography of Coherent Thalamocortical 40-Hz Oscillations in Humans. Proc Natl Acad Sci. 1991;88:11037–11041. doi: 10.1073/pnas.88.24.11037. [DOI] [PMC free article] [PubMed] [Google Scholar]
- Robinson SE. Advances in Biomagnetism. NY: Plenum Press; 1989. Theory and Properties of Lead Field Synthesis Analysis; pp. 599–602. [Google Scholar]
- Rojas DC, Maharajh K, Teale PD, Kleman MR, Benkers TL, Carlson JP, Reite ML. Development of the 40 Hz steady state auditory evoked magnetic field from ages 5 to 52. Clin. Neurophysiology. 2006;117:110–117. doi: 10.1016/j.clinph.2005.08.032. [DOI] [PubMed] [Google Scholar]
- Ross B, Borgmann C, Draganova R, Roberts LE, Pantev C. A high-precision magnetoencephalographic study of human auditory steady-state responses to amplitude-modulated tones. J. Acoust. Soc. Am. 2000;108(2):679–691. doi: 10.1121/1.429600. [DOI] [PubMed] [Google Scholar]
- Sweet RA, Bergen SE, Zhuoxin S, Marcsisin MJ, Sampson AR, Lewis DA. Anatomical Evidence of Impaired Feedforward Auditory Processing in Schizophrenia. Biol. Psychiatry. 2007;61:854–864. doi: 10.1016/j.biopsych.2006.07.033. [DOI] [PubMed] [Google Scholar]
- Sweet RA, Henteleff RA, Zhang W, Sampson AR, Lewis DA. Reduced Dendritic Spine Density in Auditory Cortex of Subjects with Schizophrenia. Neuropsychopharmacology. 2008:1–16. doi: 10.1038/npp.2008.67. [DOI] [PMC free article] [PubMed] [Google Scholar]
- Talon-Baudry C, Bertrand O, Delpuech C, Pernier J. Stimulus Specificity of Phase-Locked and Non-Phase-Locked 40 Hz Visual Responses in Human. Journal of Neuroscience. 1996;16(13):4240–4249. doi: 10.1523/JNEUROSCI.16-13-04240.1996. [DOI] [PMC free article] [PubMed] [Google Scholar]
- Teale P, Carlson J, Rojas D, Reite M. Reduced laterality of the source locations for generators of the auditory steady-state field in schizophrenia. Biol. Psychiatry. 2003;54:1149–1153. doi: 10.1016/s0006-3223(03)00411-6. [DOI] [PubMed] [Google Scholar]
- Tesche CD, Uusitalo MA, Ilmoniemi RJ, Huotilainen M, Kajola M, Salonen O. Signal-space projections of MEG data characterize both distributed and well-localized neuronal sources. Electroenceph. And Clin. Neurophys. 1995;95:189–200. doi: 10.1016/0013-4694(95)00064-6. [DOI] [PubMed] [Google Scholar]
- Ventura J, Nuechterlein KH, Subotnik KL, Gutkind D, Gilbert EA. Symptom dimensions in recent-onset schizophrenia and mania: a principal components analysis of the 24-item Brief Psychiatric Rating Scale. Psychiatry Res. 2000;97(2–3):129–135. doi: 10.1016/s0165-1781(00)00228-6. [DOI] [PubMed] [Google Scholar]
- Vierling-Claassen D, Siekmeier P, Stufflebeam S, Kopell NJ. Modeling GABA alterations in schizophrenia: a link between impaired inhibition and altered gamma and beta range auditory entrainment. J Neurophysiol. 2008 doi: 10.1152/jn.00870.2007. PMID: 18287555. [DOI] [PMC free article] [PubMed] [Google Scholar]
- Whittington MA, Traub RD, Jefferys JGR. Synchronized oscillations in interneuron networks driven by metabotropic glutamate receptor activation. Nature. 1995;373– 16:612–615. doi: 10.1038/373612a0. [DOI] [PubMed] [Google Scholar]
- Williamson SJ, Kaufman L. Magnetic Fields of the Cerebral Cortex. In: Erne SN, Hahlbohm H, Lubbig H, editors. Biomagnetism. New York: Walter de Gruyter; 1981. pp. 353–402. [Google Scholar]


