

SUMMARY
The spread of cancer during metastatic disease requires that tumor cells subvert normal regulatory networks governing cell motility to invade surrounding tissues and migrate toward blood and lymphatic vessels. Enabled (Ena)/vasodilator-stimulated phosphoprotein (VASP) proteins regulate cell motility by controlling the geometry of assembling actin networks. Mena, an Ena/VASP protein, is upregulated in the invasive subpopulation of breast cancer cells. In addition, Mena is alternately spliced to produce an invasion isoform, MenaINV. Here we show that Mena and MenaINV promote carcinoma cell motility and invasiveness in vivo and in vitro, and increase lung metastasis. Mena and MenaINV potentiate epidermal growth factor (EGF)-induced membrane protrusion and increase the matrix degradation activity of tumor cells. Interestingly, MenaINV is significantly more effective than Mena in driving metastases and sensitizing cells to EGF-dependent invasion and protrusion. Upregulation of MenaINV could therefore enable tumor cells to invade in response to otherwise benign EGF stimulus levels.
INTRODUCTION
Metastasis is the primary cause of death for cancer patients. Escape from the primary tumor and invasion into a new tissue depends on the ability of cancer cells to migrate. Breast cancer invasion and metastasis is driven by a paracrine loop between carcinoma cells that secrete colony-stimulating factor (CSF)-1 and tumor-associated macrophages which secrete epidermal growth factor (EGF) (Condeelis and Pollard, 2006). EGF elicits several responses that recruit carcinoma cells into blood vessels, including invadopodium formation, invasion into the surrounding tissue, chemotaxis, and intravasation (Wyckoff et al., 2004, 2007; Yamaguchi et al., 2005). Invasive mammary carcinoma cells acquire a rapid amoeboid migratory phenotype (Sidani et al., 2007; Wang et al., 2002) and exhibit a distinct gene expression profile (“invasion signature”) in which genes associated with proliferation and apoptosis are downregulated, while a set of motility-related genes are coordinately upregulated. This invasion signature includes a network of actin-regulatory proteins, including the Arp2/3 complex and cofilin, that drive formations of membrane protrusions important for invasion, motility, and chemotaxis (Wang et al., 2004, 2006, 2007).
The initial step in carcinoma cell invasion involves tumor cells crossing a basement membrane. Carcinoma cells cultured on top of dense extracellular matrix in vitro form invadopodia, specialized actin-rich structures that protrude into the matrix and secrete proteases focally that degrade the matrix (Condeelis and Segall, 2003; Buccione et al., 2004; Linder, 2007). Invadopodium formation is regulated by EGF signaling through the neural Wiskott-Aldrich syndrome protein (N-WASP)-Arp2/3 pathway, while cofilin is required for invadopodium stabilization and maturation (Yamaguchi et al., 2005). Structures analogous to invadopodia have been proposed to facilitate tumor cell invasion and intravasation in vivo (Yamaguchi et al., 2006).
Another component of the invasion signature of carcinoma cells is Mena, a member of the Enabled (Ena)/vasodilator-stimulated phosphoprotein (VASP) family (Wang et al., 2004, 2007) of actin regulatory proteins involved in the regulation of cell motility (Krause et al., 2003) Vertebrates have three Ena/VASP paralogs: Mena, VASP, and Ena/VASP-like (EVL) (Gertler et al., 1996). Ena/VASP proteins localize to focal adhesions, the leading edge of lamellipodia, and the tips of filopodia (Gertler et al., 1996). Ena/VASP proteins have conserved Ena/VASP homolog (EVH) 1 and EVH2 domains at their amino- and carboxytermini, respectively. The EVH1 domain binds proteins containing an FP4 consensus motif that regulates localization of Ena/VASP proteins and interaction with signaling pathways (Krause et al., 2003). The EVH1 and EVH2 domains flank a low-complexity, proline-rich core that binds to the actin monomer binding protein Profilin (Gertler et al., 1996). The EVH2 domain contains G- and F-actin binding sites and a coiled-coil motif that mediates tetramerization (Bachmann et al., 1999; Huttelmaier et al., 1999). Vertebrate Ena/VASP proteins share one conserved serine phosphorylation site, targeted by PKA and PKC (Butt et al., 1994; Chitaley et al., 2004), which plays a role in regulating Ena/VASP in cell motility and filopodia formation (Applewhite et al., 2007; Loureiro et al., 2002).
Ena/VASP activity regulates the geometry of assembling F-actin networks by capturing filament barbed ends and antagonizing capping of elongating filaments by capping proteins; the mechanism underlying Ena/VASP anti-capping activity involves direct binding to profilin-actin complexes and to G- and F-actin (Bear et al., 2000, 2002; Barzik et al., 2005; Ferron et al., 2007; Pasic et al., 2008). Ena/VASP proteins also bundle actin filaments (Bachmann et al., 1999; Barzik et al., 2005), and are thought to cluster filament barbed ends during filopodial formation and elongation (Applewhite et al., 2007; Svitkina et al., 2003).
Mena is upregulated in several human cancers, including breast cancer and melanoma (Di Modugno et al., 2004). Elevated Mena expression correlates with increased invasiveness of breast tumors (Di Modugno et al., 2006). Mena contains four alternatively included exons, named +, ++, +++, and 11a (Di Modugno et al., 2007; Gertler et al., 1996). Mena+ is preferentially expressed in the nervous system; however, no tissue-specific expression has been identified for Mena++ and Mena+++. Mena 11a is expressed in poorly invasive breast cancer cell lines with epithelial morphology, but not in highly invasive lines with mesenchymal morphology (Di Modugno et al., 2007).
We have shown that Mena is upregulated in the invasive subpopulation of cells in mammary tumors of rats and mice (Wang et al., 2004, 2007). Interestingly, Mena is differentially spliced in vivo in invasive tumor cells as compared with nonmotile resident tumor cells. Invasive tumor cells express Mena mRNA containing the +++ exon, but lack the 11a exon, while noninvasive tumor cells lack +++, but express the Mena11a isoform (Goswami et al., 2008). We have therefore named the Mena isoform containing the +++ exon “INV” for invasive, and refer to Mena variants containing this exon as “MenaINV.” The isoform lacking both the 11a and INV exons is referred to simply as “Mena.”
Here, we address the role of Mena and its invasion-specific splice isoform MenaINV in EGF-dependent carcinoma cell motility, invasion, and metastasis. Mena promotes in vivo and in vitro invasion and increases carcinoma cell motility in vivo. Furthermore, Mena enhances invadopodium matrix degradation activity. Mena promotes lamellipod extension in response to EGF by increasing the amount of barbed-end actin incorporation at the leading edge. Expression of the invasion-specific isoform, MenaINV, further potentiates invasion, motility, EGF sensitivity, and formation of lung metastases. We conclude that increased Mena expression sensitizes carcinoma cells to EGF signals. Our results define roles for Mena in key steps of carcinoma cell invasion and EGF-driven motility.
RESULTS
Previously, we found upregulation of MenaINV in the invasive subpopulation of tumor cells in two different rodent models; in particular, total Mena and MenaINV levels were 3- to 4-fold higher in invasive compared to resident tumor cells (Goswami et al., 2008). The INV exon encodes 19 amino acids that are included in Mena just C terminal to the EVH1 domain. For the analyses described below, we generated stable MTLn3 cells expressing enhanced green fluorescent protein (EGFP)-tagged versions of Mena and MenaINV and selected for cell populations expressing EGFP-Mena or EGFP-MenaINV approximately 4-fold over endogenous levels to mimic the observed changes in Mena expression and splicing in invasive cells. Cells expressing equivalent EGFP levels were used as controls.
MenaINV Localizes to the Leading Edge of Motile Tumor Cells and Promotes Motility In Vivo
We asked whether Mena and/or MenaINV influence carcinoma cell invasion and migration. An initial step in carcinoma cell invasion is dissociation of tumor cells from the primary tumor and migration along extracellular matrix fibers toward blood vessels (Condeelis and Segall, 2003). We used intravital imaging of tumors generated by orthotopic injection of tumor cells into the rat mammary gland to investigate the localization of Mena within tumors in vivo. Within primary tumors, EGFP-Mena localized to cell-cell junctions (Figure 1A), and to rapidly forming protrusions in tumor cells (Figure 1B; see Movie S1 available online). Images of EGFP alone in control cells exhibited no enrichment in protrusions, indicating that EGFP-Mena enrichment in such protrusions was not a result of space filling (data not shown).
Figure 1. MenaINV Promotes Carcinoma Cell Motility In Vivo and Enhances Metastasis to the Lungs.

(A) Intravital imaging of tumors generated by injection of MTLn3 EGFP-Mena cells into rats. Scale bar, 20 μm. Green = EGFP-Mena; purple = collagen second harmonic.
(B) Intravital imaging of tumors generated by injection of MTLn3 EGFP-Mena cells into rats. Scale bar, 20 μm. Green = EGFP-Mena; purple = collagen second harmonic. Protrusion containing Mena is outlined in white.
(C) Table showing the quantification of motile cells in orthotopic breast tumors derived from injection of MTLn3 cells into SCID mice. *p < 0.002, **p < 0.04, unpaired t test with Welch’s correction for unequal variance.
(D) Average weight of primary tumors in xenograft SCID mice derived from injection of each cell type. Error bars indicate SEM.
(E) Spontaneous lung metastases quantified using multiphoton microscopy. Insert depicts picture of lung metastasis from an SCID mouse with a tumor derived from injection of MTLn3-EGFP-MenaINV, taken using multiphoton microscopy. Green = MTLn3-EGFP-MenaINV; purple = collagen second harmonic. Scale bar, 50 μm. Error bars indicate SEM. **p < 0.001; ***p < 0.00001.
(F) Spontaneous lung metastases quantified using H&E stained lung sections. Insert depicts H&E staining of lung section from MTLn3-EGFP-MenaINV-derived xenograft. Dark purple = metastasis. Scale bar, 20 μm. Error bars indicate SEM. ***p < 0.001.
We also investigated the subcellular distribution of Mena in motile cancer cells using intravital imaging of MTLn3 EGFP-Mena tumors. Interestingly, in contrast to cells within the primary tumor, EGFP-Mena occupied the cytoplasm in motile carcinoma cells with enrichment at the leading edge in 15%-20% of motile cells (Figure 1B, Movie S1). We observed a similar distribution of EGFP-Mena within newly forming cell protrusions in motile cells arising from tumors formed in nude mice (Movie S2). An identical pattern of localization was found for EGFP-MenaINV (data not shown). Our observation that Mena preferentially localizes to the leading edge of motile tumor cells in vivo is consistent with a potential role for Mena in cancer cell motility and invasion.
We calculated the fraction of motile carcinoma cells expressing EGFP-Mena or EGFP-MenaINV in vivo by analyzing movies taken by intravital imaging. Expression of EGFP-Mena increased the percentage of motile cells compared with control cells expressing EGFP-Zyxin, which has no effect on carcinoma cell motility in vivo (data not shown). Interestingly, expression of EGFP-MenaINV further increased the percentage of motile cells in vivo (Figure 1C).
Since motility is initiated by the formation of protrusions in the direction of movement, we analyzed the protrusive activity of MTLn3 cells with increased Mena/MenaINV levels. MTLn3 cells expressing EGFP-Mena or EGFP-MenaINV exhibited an increase in membrane protrusion compared with parental MTLn3 cells when plated on a collagen gel (Figure S1).
MenaINV Promotes Metastatic Spread to the Lungs
An important consequence of increased carcinoma cell motility can be increased metastases to secondary organs. We asked whether the enhanced motility observed in Mena and MenaINV cells increased metastasis to the lungs. To investigate metastatic spread, we used xenografts derived from injection of MTLn3-EGFP and MTLn3-EGFP-Mena- and MenaINV-expressing cells into the mammary gland of 5- to 7-wk-old severe combined immune-deficient (SCID) mice (Neri et al., 1982). Following 4 wks of tumor growth, significantly more micrometastases were found in lungs from xenografts derived from EGFP-Mena cells compared to MTLn3-EGFP control cells (Figure 1E) using high-resolution fluorescent microscopy. Lung metastases quantified using H&E staining and lower-resolution light microscopy did not show a significant difference due to the sensitivity of the scoring method (Figure 1F). Interestingly, tumors derived from EGFP-MenaINV cells showed an even more striking increase in lung metastases as judged both by fluorescent microscopy and H&E staining compared with MTLn3-EGFP and EGFP-Mena xenografts (Figure 1E and 1F), suggesting that expression of MenaINV renders cells more metastatic. Measurements of primary tumor growth revealed no significant differences between tumors derived from each cell type, thus the observed phenotype was not due to a growth advantage (Figure 1D).
MenaINV Promotes Macrophage Independent Three Dimensional Invasion of Carcinoma Cells
Since MenaINV is upregulated in the invasive cell population and promoted in vivo motility and metastasis to the lungs, we wondered whether MenaINV affected invasion in vitro. During invasion and metastasis, carcinoma cells migrate along collagen fibers and are attracted by EGF secreted from tumor-associated macrophages (MΦ) (Condeelis and Segall, 2003; Wyckoff et al., 2004). To analyze the invasive potential of MTLn3 cells expressing Mena or MenaINV, we used an in vitro invasion assay that reconstitutes MΦ-dependent invasion of tumor cells in collagen (Goswami et al., 2005). When cultured alone, less than 5% of parental MTLn3 cells invade more than 20 mm into the collagen gel (Goswami et al., 2005). The presence of MΦ increased the number of invasive MTLn3 cells about 5-fold. Surprisingly, MTLn3 cells expressing Mena showed increased invasion in the absence of MΦ (Figure 2A), while MTLn3 cells expressing EGFP behaved like parental MTLn3 cells (data not shown). MTLn3 cells expressing MenaINV, promoted even more invasion than Mena in the absence of MΦ (Figure 2A). In the presence of MΦ, both Mena- and MenaINV-expressing cells exhibited invasion levels similar to controls, potentially because the invasive potential of parental MTLn3 cells is at its maximum with MΦ present. The proinvasive effects of MenaINV likely involves regulation of actin dynamics, since mutation of the F-actin binding site or the proline-rich region (which binds profilin) of MenaINV ablated MΦ-independent carcinoma cell invasion (data not shown). In contrast, the conserved protein kinase (PK) A/PKC phosphorylation site was not required to promote invasion (data not shown).
Figure 2. Mena and MenaINV Promote Carcinoma Cell Invasion into a 3D Matrix and Enhance Stabilization and Degradation at Invadopodia.

(A) 3D Collagen invasion assay using MTLn3 cells expressing Mena or MenaINV in the absence (white bars) and presence (gray bars) of macrophages. Error bars indicate SEM. *p < 0.005 compared to parental MTLn3 cells; ***p < 0.005 compared to MTLn3 Mena cells.
(B) 3D Collagen invasion assay using MTLn3 cells expressing MenaINV in the presence of DMSO or 6 μM AG1478. Error bars indicate SEM.
(C) 3D reconstruction of MTLn3 EGFP-Mena cells transiently transfected with RFP-cortactin invading collagen I. Arrows indicate 3D protrusions (collagen I gel on bottom). Scale bar, 10 μm. Higher magnifications of the protrusion are shown on the bottom right; scale bar, 5 μm.
(D) Schematic diagram of the invadopodium assay. Images in (E) and (G) represent the plane of the matrix in this diagram.
(E) Immunofluorescence of MTLn3 cells using anti-Mena or anti-cortactin antibodies. Arrowheads indicate invadopodia. Scale bar, 10 μm.
(F) Matrix degradation by MTLn3 cells expressing EGFP, EGFP-Mena, or EGFP-MenaINV. Bars represent the mean of two independent experiments and over 40 cells analyzed. Error bars indicate SEM. *p < 0.00005.
(G) Images of Texas Red-fibronectin matrix indicating degradation by invadopodia visible as black holes (arrowheads). Scale bar, 10 μm.
(H) Analysis of invadopodium lifetime of MTLn3 GFP-Actin cells transiently transfected with mCherry-Mena or mCherry-MenaINV. Non-transfected cells on the same dish served as control. Error bars indicate SEM. *p < 0.005.
(I) Histogram showing the distribution of invadopodium lifetimes.
The observation that MenaINV promoted three dimensional (3D) invasion in an MΦ-independent manner suggests that MenaINV can promote invasion without a strong growth factor signal. Since serum-containing medium was present on top of the collagen gel, we reasoned that expression of MenaINV may have rendered MTLn3 cells responsive to small amounts EGF receptor (EGFR) ligands diffusing down from the media in concentrations below the threshold required for invasion of parental MTLn3 cells. To test this hypothesis, we inhibited EGFR signaling by including AG1478, an EGFR inhibitor, in both the gel and the overlaying media. EGFR inhibition reduced the MΦ-independent invasion of MTLn3 cells expressing MenaINV to a level comparable to that of control cells (Figure 2B). Therefore MenaINV expression enables carcinoma cells to respond to lower EGF concentrations.
MenaINV Leads to Enhanced Stabilization and Degradation at Invadopodia
During carcinoma cell invasion, dissociation of tumor cells from the primary tumor and crossing of a basement membrane is facilitated by local activation of proteases. In vitro, protease activation by carcinoma cells occurs at invadopodia (Yamaguchi et al., 2005). We detected EGFP-Mena in protrusions formed by MTLn3 cells invading a collagen I gel (Figure 2C) and found that Mena colocalized with RFP-cortactin in these structures. Since cortactin, an actin binding protein, localizes in invadopodia formed by cultured mammary tumor cells, we hypothesized that the protrusions might represent 3D correlates of invadopodia. When cultured on fibronectin (FN)-gelatin-coated dishes, MTLn3 cells form invadopodia at the ventral cell membrane (Figure 2D) (Yamaguchi et al., 2005). In this assay, endogenous Mena concentrated in invadopodia in MTLn3 cells and colocalized with cortactin and F-actin (Figure 2E and data not shown). In addition, an EGFP-tagged version of Mena or MenaINV localized to nascent and/or mature invadopodia when stably expressed in MTLn3 cells (data not shown). The distribution of Mena, as measured by fluorescence intensity scans throughout invadopodia, showed a pattern comparable to that of cortactin (Figure S2).
Next, we determined whether Mena or MenaINV affected invadopodium formation and/or maturation. We measured the percentage of cells containing invadopodia in MTLn3 cells expressing Mena or MenaINV and found no difference in the number of cells containing invadopodia as compared to EGFP-expressing control cells (data not shown). Similarly, the numbers of invadopodia per cell were not altered compared to control.
We asked whether Mena or MenaINV affected matrix degradation by invadopodia. Interestingly, there was a significant increase in matrix degradation by MTLn3 cells expressing EGFP-Mena or EGFP-MenaINV compared with EGFP-control cells measured as holes in the fluorescently labeled FN matrix (Figures 2F and 2G).
Matrix degradation activity is maximal in mature, long-lived invadopodia (M.O., unpublished data). Therefore, we asked whether Mena promotes invadopodium maturation and/or stabilization using time-lapse fluorescence analysis of MTLn3 cells stably expressing GFP-actin and transiently transfected with mCherry, mCherry-Mena, or mCherry-MenaINV. The resulting movies showed colocalization of GFP-actin and mCherry-Mena to dynamic invadopodia (Movie S3). In addition, the average lifetime of invadopodia was increased by expression of Mena (90 min) or MenaINV (107 min) compared with control cells (60 min) (Figures 2H and 2I). Untransfected cells expressing GFP-actin on the same dish served as controls to confirm that expression of fluorescent proteins did not alter invadopodium lifetime. Invadopodia with a lifetime >70 min have the capacity to degrade matrix (M.O., unpublished data). The percentage of invadopodia with lifetimes >70 min was increased 2-fold in Mena- or MenaINV-expressing cells. The percentage of cells containing invadopodia with lifetimes >200 min was increased 10-fold in the presence of Mena or MenaINV, suggesting that these longer-lived invadopodia account for Mena-dependent increases in matrix degradation. Together, these results indicate that Mena and MenaINV promote invadopodium stabilization and/or maturation, thereby enhancing matrix degradation.
MenaINV Promotes In Vitro Lamellipod Formation and In Vivo Invasion in Response to Low Concentrations of EGF
Response to EGF is a key step during carcinoma cell invasion and has been directly correlated with metastasis (Wyckoff et al., 2004). MTLn3 cells respond to bath applications of EGF by increased actin polymerization that drives circumferential lamellipodial extension (Mouneimne et al., 2004). Analysis of lamellipodial extension of EGFP-Mena- or EGFP-MenaINV-expressing MTLn3 cells indicated no difference in protrusion from control cells following treatment with saturating EGF concentrations (5 nM; data not shown). Since these conditions are optimal for maximal membrane protrusion and cell area increase of parental cells, we speculated that these conditions would not permit additional stimulating effects.
The relationship between EGF concentration and protrusion in MTLn3 cells following stimulation is biphasic, with a maximal response elicited by treatment with 5 nM EGF. Since higher and lower EGF concentrations lead to diminished lamellipod extension (Segall et al., 1996), we analyzed lamellipod protrusion of MTLn3 cells expressing EGFP-MenaINV or EGFP as a function of EGF concentration and found that EGFP-MenaINV cells respond to EGF concentrations as low as 0.025 nM (Figure 3A). In contrast, a concentration of 1 nM was required to observe maximal lamellipodial extension in EGFP-control cells. These results indicate that expression of EGFP-MenaINV sensitizes MTLn3 cells to lower EGF concentrations by 40-fold.
Figure 3. Expression of Mena or MenaINV Promotes Lamellipod Protrusion and In Vivo Invasion in Response to Low EGF Concentrations.

(A) EGF dose-response curve of EGFP- and EGFP-MenaINV-expressing MTLn3 cells. The area of the cells was determined 3 min after stimulation with the indicated EGF concentrations and normalized to the cell area before EGF treatment. Results represent duplicates; over 30 cells analyzed. Error bars indicate SEM.
(B) In vivo invasion assay: EGF dose-response curve of invasive cells collected from EGFP and EGFP-MenaINV tumors. Data normalized to average number of cells in needles containing 0.0 nM EGF for each type of xenograft. Error bars indicate SEM.
(C) Lamellipod protrusion after 0.5 nM EGF stimulation. Results represent triplicates; over 45 cells analyzed. Error bars indicate SEM. Magnification of the boxed area from the left graph is shown on the right.
(D) Lamellipod protrusion after 5 nM EGF stimulation. Results represent triplicates; over 40 cells analyzed. Error bars indicate SEM.
An in vivo invasion assay (Wyckoff et al., 2000b) was used to investigate whether migrating tumor cells are sensitized to EGF in vivo. Tumors were derived from injection of MTLn3-EGFP or EGFP-MenaINV cells into SCID mice. Invasive tumor cells migrate from the primary tumor into catheterized needles containing materials that recapitulate the stromal microenvironment, including EGF, from 0 to 250 nM, used to induce the paracrine loop and determine the concentration at which maximal invasion occurred (Wyckoff et al., 2000b). MTLn3-EGFP control cells exhibited the characteristic biphasic response showing peak invasion toward 25 nM EGF (Figure 3B), the equivalent of 5 nM EGF in vitro (Wyckoff et al., 2004); invasion was increased significantly in 25 nM needles as compared with control/0.0 nM needles collecting EGFP cells (p value = 0.00004). Interestingly, MTLn3-EGFP-MenaINV-expressing cells invaded toward 25-fold lower concentrations of EGF, with peak invasion toward 1 nM EGF (Figure 3B) as compared with EGFP-MenaINV cells invading toward 0.0 nM EGF (p value = 0.001), consistent with the enhanced sensitivity to EGF observed in vitro.
In addition to increased protrusion magnitude in response to low concentrations of EGF in vitro (0.5 nM), MenaINV-expressing cells exhibited lamellipodial protrusion within 10 s after EGF stimulation (Figure 3C, enlargement at the right), while EGFP-Mena and control cells required 30-90 s respectively to initiate significant protrusive responses.
One possible explanation for the enhanced EGF responses of MenaINV- or Mena-expressing MTLn3 cells is increased expression of members of the EGFR family or their ligands. To test whether EGFP-Mena or EGFP-MenaINV induces MTLn3 cells to express EGF, other EGFR ligands, or EGFRs, we compared mRNA levels from different MTLn3 cell lines for the expression of EGF, transforming growth factor-α, heparin binding EGF-like growth factor, amphiregulin, and neuregulin, as well as expression of the known EGFRs, EGFR, ErbB2, -3, and 4. Neither EGFP-Mena nor EGFP-MenaINV expression in MTLn3 cells altered mRNA expression of any of these EGFRs or EGFR ligands (data not shown). Therefore, the increase in MΦ-independent invasion and EGF responsiveness of Mena-expressing MTLn3 cells is not due to induction of an autocrine feedback loop or expression of higher EGFR levels.
We next asked whether Ena/VASP proteins are required for lamellipod protrusion and actin polymerization after EGF stimulation in MTLn3 cells using a well-established strategy to deplete Ena/VASP proteins from their normal sites of function and sequester them on the mitochondria (Bear et al., 2000). The sequestration approach effectively phenocopies Ena/VASP deficiency in a variety of systems, including fibroblasts, neurons, and Drosophila (Dent et al., 2007; Gates et al., 2007). Stable expression of an EGFP-tagged mitochondrial targeting sequence fused to four Ena/VASP binding sites; FP4 motifs in MTLn3 cells (cells referred to as “FP4Mito”) sequestered all Ena/VASP proteins on the mitochondria (Figure S3), thereby neutralizing their activity. In contrast, a control construct containing four mutated Ena/VASP binding sites (“AP4Mito”) did not alter Ena/VASP localization in MTLn3 cells. EGF-induced membrane protrusion was dramatically attenuated in cells expressing the FP4Mito sequestering construct compared with AP4Mito-expressing control cells (Figure 3D). Therefore, Ena/VASP function is required for efficient lamellipodial extension after EGF stimulation in MTLn3 cells.
MenaINV Localization to the Leading Edge Precedes Arp2/3 Recruitment following EGF Stimulation
In breast carcinoma cells, lamellipodial protrusion in response to EGF requires both cofilin-mediated severing and Arp2/3-mediated dendritic nucleation (DesMarais et al., 2004). To determine how Mena and MenaINV potentiate EGF-induced lamellipodial extension, we first examined the kinetics of their recruitment to the nascent protrusion. Endogenous Mena and EGFP-MenaINV localized to the leading edge of MTLn3 cells rapidly after EGF stimulation (Figure 4A). Mena signal was detected at the leading edge as early as 20 s after EGF treatment, where it remained for approximately 2 min (Figures 4B and 4C, Movie S4). Costaining with phalloidin showed Mena localization to the outer edge of the newly formed protrusion, distal to F-actin (Figure 4B).
Figure 4. Mena Localizes to the Leading Edge after EGF Stimulation.

(A) Immunofluorescence of MTLn3 cells using anti-Mena antibody and Alexa594-phalloidin. Time in seconds after 5 nM EGF stimulation. Scale bar, 10 μm.
(B) Immunofluorescence of MTLn3 EGFP-Mena cells stained for F-actin 1 min after EGF stimulation. Scale bar, 5 μm. Lower panel: frames with 10 s intervals of MTLn3 EGFP-Mena cells. Time in seconds after 5 nM EGF stimulation. Scale bar, 5 μm.
(C) Kinetics of EGFP-Mena leading-edge recruitment. Time in seconds after 5 nM EGF stimulation. The mean fluorescence intensity of 10 different areas of the leading edge is plotted and normalized to the fluorescent intensity before EGF stimulation. Error bars represent SEM.
(D) Immunofluorescence of MTLn3 EGFP-Mena cells using anti-p34Arc antibody and Alexa350-phalloidin. Time in seconds after 5 nM EGF stimulation. Scale bar, 10 μm.
(E) Immunofluorescence of MTLn3 EGFP-Mena cells using anti-p34Arc antibody and Alexa350-phalloidin 1 min after 5 nM EGF stimulation. Scale bar, 5 μm.
(F) Representative line scans of the leading edge of MTLn3 EGFP-Mena cells stained for Arp2/3 (red) and F-actin (blue) at indicated time points after 5 nM EGF stimulation. Arrowheads indicate the leading edge of the cell.
To analyze the relationship between Mena and the Arp2/3 complex in EGF-mediated lamellipodial protrusion, we stained EGFP-Mena MTLn3 cells for the Arp2/3 complex after EGF stimulation. Both Mena and the Arp2/3 complex localized to the leading edge after EGF treatment; however, they exhibited differences in the kinetics of leading-edge enrichment. Following EGF stimulation, EGFP-Mena localized to the leading edge within 20 s, whereas Arp2/3 enrichment was not detected until 1 min (Figure 4D). In contrast, no EGFP-Mena was detected at the leading edge 3 min after EGF stimulation, even though the Arp2/3 complex was still enriched there (Figure 4D). Furthermore, EGFP-Mena localized distal to the Arp2/3 signal, which colocalized with F-actin (Figure 4E), as verified by line scan analysis through the extending lamellipod (Figure 4F). EGFP-Mena leading-edge recruitment was distal to and preceded Arp2/3 and F-actin recruitment in time.
Recruitment of Mena to the Leading Edge Requires Free Barbed Ends
We next asked whether Mena/MenaINV could be recruited to the leading edge in response to cofilin activity. EGF-stimulated phospholipase Cγ (PLCγ) hydrolyses phosphatidylinositol-4,5-bisphosphate (PIP2), thereby releasing active cofilin from its complex with PIP2 in the plasma membrane. Activated cofilin then locally severs actin filaments to generate free barbed ends and start actin polymerization and cell protrusion (van Rheenen et al., 2007) (Figure 5C). We analyzed Mena localization after EGF stimulation in the presence of cytochalasin D (CD), a fungal metabolite that, when used at low concentrations, specifically binds to free barbed ends of actin filaments and reduces the rate of actin monomer addition; under these conditions, lamellipodia protrude, but with lower velocity (Bear et al., 2002). EGFP-Mena failed to localize to the leading edge of MTLn3 cells after EGF treatment in the presence of 50 nM CD, whereas the Arp2/3 complex was still recruited to the leading edge (Figures 5A and 5B). Therefore, as in fibroblasts (Bear et al., 2002), Mena localization to the leading edge of MTLn3 cells was related to the availability of free barbed ends. Similarly, MenaINV was not recruited to the leading edge after EGF stimulation in the presence of CD (data not shown). Therefore, cofilin-generated barbed ends could be the mechanism underlying Mena recruitment to the leading edge upon EGF stimulation.
Figure 5. Mena Recruitment to the Leading Edge Is Dependent on Availability of Free Barbed Ends while Arp2/3 Recruitment Is Not.
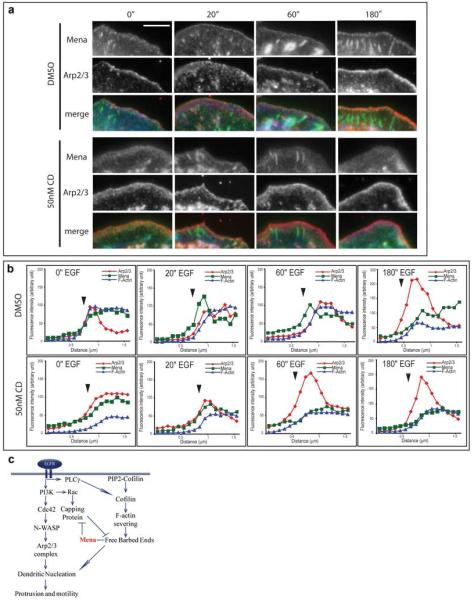
(A) Immunofluorescence of MTLn3 EGFP-Mena cells using anti-p34Arc antibody and Alexa350 phalloidin at indicated time points after 5 nM EGF stimulation in the presence of DMSO or 50 nM CD. Scale bar, 5 μm.
(B) Representative line scans of the leading edge of MTLn3 EGFP-Mena cells stained for Arp2/3 (red) and F-actin (blue) at indicated time points after 5 nM EGF stimulation in the presence of DMSO or 50 nM CD. Arrowheads indicate the leading edge of the cell.
(C) Schematic of signaling cascades leading to protrusion and motility.
MenaINV Promotes Actin Polymerization at the Leading Edge in Response to Low Concentrations of EGF
EGF-induced lamellipodial protrusion correlates directly with the generation of free actin filament barbed ends. EGF induces an increase in the number of free barbed ends in the most peripheral 0.26 μm zone of the leading edge of MTLn3 cells. This increase in free barbed ends shows two transients: a cofilin-dependent peak after 1 min, and a smaller peak 3 min after EGF treatment (Mouneimne et al., 2004) (Figure 5C). To determine whether the increased lamellipodial protrusion of Mena-expressing cells in response to nonsaturating EGF resulted from an increase in free barbed ends at the leading edge, we measured the relative number of barbed ends after EGF addition. Free barbed ends were increased at the leading edge in both EGFP-Mena- and EGFP-MenaINV-expressing cells compared with EGFP-control cells after stimulation with 0.5 nM EGF for both the 1 and 3 min barbed-end transients (Figures 6A and 6B). Increased lamellipodial protrusion in EGFP-MenaINV-expressing cells was observed as early as 20 s after EGF stimulation (Figure 6A); therefore, we analyzed barbed ends at earlier time points. Increase of free barbed ends was observed beginning at 20 s and persisting up to 1 min after EGF stimulation in EGFP-MenaINV cells compared with EGFP-Mena cells (Figure 6C). Taken together, these results suggest that Mena expression renders carcinoma cells more sensitive to low, nonsaturating EGF concentrations, and enables cells to respond with actin incorporation at free barbed ends and lamellipodial protrusion. MenaINV sensitizes carcinoma cells even further to promote more rapid and greater responses to lower EGF concentrations.
Figure 6. Expression of MenaINV Promotes Formation of Barbed Ends at Early Time Points in Response to Low Concentrations of EGF in a Cofilin-Dependent Manner.

(A) Barbed end incorporation after 0.5 nM EGF stimulation in MTLn3 EGFP, EGFP-Mena, or EGFP-MenaINV cells using Biotin-labeled actin. Scale bar, 10 μm.
(B) Relative number of barbed-end incorporation at the leading edge 1 and 3 min after 0.5 nM EGF stimulation. Results represent duplicates; over 30 cells analyzed. Error bars indicate SEM.
(C) Relative number of barbed end incorporation at the leading edge 20, 40, and 60 s after 0.5 nM EGF stimulation. Results represent triplicates; over 40 cells analyzed. Error bars indicate SEM.
(D) Barbed end incorporation after 5 nM EGF stimulation in MTLn3 EGFP-FP4-Mito or EGFP-AP4-Mito cells using Biotin-labeled actin. Scale bar, 10 μm.
(E) Relative number of barbed-end incorporation at the leading edge after 5 nM EGF stimulation in MTLn3-EGFP-AP4 or EGfP-FP4-Mito cells. Results represent triplicates; over 40 cells analyzed. Error bars indicate SEM.
(F) Relative number of barbed-end incorporation at the leading edge after 5 nM EGF stimulation. Results represent duplicates; over 35 cells analyzed. Error bars indicate SEM.
To determine whether inhibition of Ena/VASP function affects EGF-induced free barbed-end production, we examined the levels of free barbed ends in FP4 and AP4 Mito cells. Inhibition of Ena/VASP function dampened both the 1 and 3 min transients of free barbed-end production after 5 nM EGF stimulation (Figures 6D and 6E). In addition, unstimulated FP4Mito-expressing cells showed a small but statistically significant reduction in free barbed ends at the leading edge compared with control cells (Figure 6E). These results indicate that Ena/VASP proteins are necessary to form or maintain free barbed ends at the leading edge after EGF stimulation.
Mena and MenaINV Promote Actin Polymerization in a Cofilin-Dependent Manner
To understand how expression of Mena or MenaINV promotes actin polymerization at the leading edge, we tested three possible mechanisms. First, we hypothesized that Mena expression changed the output of the EGFR signaling pathway directly. We observed no difference in the phosphorylation status of the canonical EGFR downstream targets Erk (pT202/pY204), Akt (pS473), and PKCδ (pT505); minor differences in phospho EGFR levels (pY1068) were observed between experiments; however, no consistent trend emerged (Figure S5 and data not shown). Second, we asked whether Mena was phosphorylated upon EGF treatment. No changes in Mena or MenaINV phosphorylation at the conserved serine residue (S236) were detected (Figure S4). Therefore, Mena and MenaINV potentiate EGF-induced motility responses by a mechanism that does not cause global changes in EGFR signaling or by being phosphorylated in response to EGF.
Lastly, given the potentiating effects of MenaINV on the cofilin-dependent early barbed-end transient, we used MTLn3 cells overexpressing Lin-11, Isl-1, Mec-3 kinase (LIMK) or LIMK kinase-dead mutant (F and KS cells, respectively) to investigate whether cofilin-generated free barbed ends are required for the potentiation of actin polymerization by Mena at the leading edge after EGF treatment. LIMK phosphorylates cofilin and thereby renders it inactive. Following EGF treatment, F cells inhibit generation of free barbed ends, whereas KS cells show an increase in barbed ends (Wang et al., 2006). We transiently transfected F and KS cells with mCherry, mCherry-Mena, or mCherry-MenaINV, and determined the number of free barbed ends after EGF stimulation. Expression of Mena or MenaINV had no effect on the number of barbed ends in F- or KS-overexpressing cells (Figure 6F). We conclude that cofilin activity is required for Mena- and MenaINV-promoted barbed-end generation (Figure 5C).
DISCUSSION
We have identified Mena, in particular the invasion-specific isoform MenaINV, as regulators of carcinoma cell invasion. MenaINV promotes responses to EGF signaling, such as lamellipodial protrusion and actin incorporation at barbed ends. Both these responses play critical roles during breast cancer invasion and metastasis (DesMarais et al., 2004; Mouneimne et al., 2004). MenaINV stabilizes invadopodia and thereby increases their matrix degradation activity. Finally, MenaINV promotes carcinoma cell invasion in a 3D environment in vitro and in vivo, and increases in vivo carcinoma cell motility and the formation of lung metastases. We conclude that MenaINV influences cancer cell invasion by stabilizing invadopodia, regulating the response to EGF signaling, and increasing overall motility.
MenaINV Promotes Carcinoma Cell Invasion and Metastasis
The effects of increased Mena levels differ depending on cellular context. In two-dimensional (2D) cell culture systems, Ena/VASP proteins negatively regulate spontaneous fibroblast motility (Bear et al., 2000); this negative regulation is due to a shift in lamellipodial dynamics (Bear et al., 2002). Increased Mena levels promote the formation of longer, less branched actin networks; in lamellipodia within fibroblasts, such networks likely lack the structural integrity to push effectively against the plasma membrane and instead buckle and are converted into ruffles that do not contribute to locomotion. In neurons, increased Mena levels result in robust filopod formation, likely due to the high levels of fascin that bundle the long filaments, forming structures stiff enough to protrude (Lebrand et al., 2004). Thus, the output of Mena activity is affected by the other components of the protrusion machinery.
In the present study, we find that carcinoma cell motility in 3D environments is increased by Mena expression. Expression of Mena resulted in a higher percentage of motile carcinoma cells in vivo and increased invasive potential both in vitro and in vivo. Furthermore, expression of MenaINV promoted the formation of metastasis to the lung significantly more than Mena- or MTLn3-EGFP-control cells. These results are consistent with the documented upregulation of Mena in invasive tumor cells in mammary tumors of rat and mouse. It is likely that Ena/VASP proteins influence cell motility differently in fibroblasts and carcinoma cells: neither overexpression of Mena nor inhibition of all Ena/VASP proteins alters random 2D motility of MTLn3 carcinoma cells (data not shown), whereas overexpression decreased and inhibition increased random 2D motility in fibroblasts, respectively (Bear et al., 2000). Furthermore, carcinoma cell invasion is the result of directed cell migration toward a chemoattractant, such as EGF (Chan et al., 1998). EGF stimulation affects motility in part by stabilizing lamellipodial protrusion (Hinz et al., 1999); in this context, Mena enhancement of protrusion may be more readily converted to productive locomotion.
MenaINV in Invadopodium Formation and Maturation
Mena localizes to invadopodia, structures assembled at the cell periphery of highly metastatic cancer cells (Linder, 2007). Invadopodium formation is initiated by EGF signaling, where EGFR activation leads to a signal cascade that activates N-WASP and results in actin polymerization initiated by the Arp2/3 complex (Yamaguchi et al., 2005). Cofilin-dependent actin polymerization is required for invadopodium maturation and stabilization. Similar to cofilin, expression of Mena did not influence the initiation of invadopodium formation, but did influence the stability and maturation of invadopodia. Mena or MenaINV expression increased matrix degradation activity and invadopodium lifetime. Therefore, Mena likely plays a role in the actin dynamics required for invadopodium stablilization. Mena may bind to the free barbed ends in immature invadopodia, generated through the severing activity of cofilin, and promote actin polymerization. Alternatively, the actin filament-bundling function of Mena may be required to stabilize invadopodia.
Mena Splice Isoforms in Metastasis
A key finding of our work is the identification of the MenaINV isoform as an invasion-promoting isoform. Expression of MenaINV promotes carcinoma cell invasion, EGF-mediated lamellipodial protrusion, and barbed-end actin incorporation to a greater extent than expression of Mena. Importantly, expression of MenaINV potentiates invasion in vivo and leads to enhanced formation of lung metastases independent of tumor growth. It will be interesting to determine the function of the INV exon and how it can promote responses of the actin cytoskeleton. We hypothesize that the inclusion of the 19 amino acid INV sequence changes the 3D structure of Mena and either facilitates binding to interacting proteins or locks it into a more active state.
In addition to the MenaINV invasion-specific isoform, a recent study identified a second Mena isoform, called Mena 11a, which is exclusively expressed in cells with an epithelial morphology (Di Modugno et al., 2007). The Mena 11a exon consists of 20 amino acids, and its expression is lost during epithelial-to-mesenchymal transition. We have observed that the expression of the Mena 11a exon is lost during cancer cell metastasis, whereas the expression of MenaINV is induced (Goswami et al., 2008). Therefore it appears that Mena activity is regulated through splicing during metastasis. Exon-specific antibodies to INV and 11a could be used to detect highly invasive tumors and may provide a strategy for diagnosis and prognosis of cancer patients. A growing body of evidence implicates alternate splicing events in cancer progression (Venables, 2006); whether additional genes within the invasion signature are regulated by alternate splicing remains to be determined.
Ena/VASP Proteins Downstream of EGF Signaling
Carcinoma cell invasion requires a signal in the form of a growth factor to initiate chemotaxis. Breast carcinoma cells are chemotactic to EGF, and during breast cancer metastasis EGF is secreted by tumor-associated MΦ and attracts carcinoma cells to blood vessels (Mouneimne et al., 2006; Wyckoff et al., 2007). EGF signaling results in actin polymerization at the leading edge of carcinoma cells, a process regulated through cofilin severing and Arp2/3-mediated dendritic nucleation (DesMarais et al., 2004; Mouneimne et al., 2004; Wang et al., 2006). Mena localizes to the protruding edge of carcinoma cells treated with EGF and promotes EGF-stimulated lamellipodial protrusion and actin polymerization. Furthermore, Ena/VASP activity is required for efficient lamellipodial protrusion.
Our results suggest that Mena plays a key role in the response to EGF signaling. MenaINV expression sensitizes the cell to EGF signaling and enables cellular responses, such as lamellipodial extension and invasion in vitro and in vivo, in response to much lower EGF concentrations than parental MTLn3 cells. This observation is consistent with the ability of Mena and MenaINV to promote carcinoma cell invasion in the absence of MΦ.
How does MenaINV sensitize cells to low EGF concentrations? Analysis of canonical EGFR signaling pathways revealed no obvious differences in cells expressing Mena or MenaINV. The timing of Mena recruitment to the leading edge resembles the activation profile of cofilin and precedes Arp2/3 recruitment. Since cofilin activity is required for Mena-promoted actin polymerization, we suggest the following mechanism for EGF-stimulated lamellipodial protrusion. In resting, unstimulated cells, most actin filaments are capped and unavailable for polymerization. EGF stimulation leads to cofilin recruitment and severing of capped actin filaments at the leading edge. The newly generated free barbed ends are bound by Mena, and actin filament elongation is supported by the recruitment of polymerization-competent monomers through profilin binding and the anti-capping activity of Mena (Figure 7) (Bear et al., 2002). Our model suggests that upregulation of MenaINV is a mechanism for amplifying the cofilin pathway. The canonical EGFR signaling pathways Erk, Akt, and PKCδ are not affected, because MenaINV acts as an amplifier downstream of cofilin (Figure 5C).
Figure 7. Model of the Function of MenaINV Downstream of EGF Signaling.

In unstimulated cells, actin filaments are capped. EGF stimulation leads to PLCγ-mediated release and activation of cofilin from PIP2. Cofilin severs capped actin filaments and MenaINV binds newly generated free barbed ends. Actin filament elongation and the resulting membrane protrusion are supported by the recruitment of polymerization-competent monomers through profilin binding and the anticapping activity of Mena. Subsequently, the Arp2/3 nucleates new filaments that branch off the growing filaments.
Mena function may be regulated by the tumor suppressor, Tes, which binds the EVH1 domain of Mena through an unconventional Lim-domain mediated interaction, thereby blocking its FP4 binding site (Boeda et al., 2007). It is intriguing that Tes binds only Mena and not VASP or EVL, similar to the observation that Mena, but not VASP or EVL, is upregulated in invasive carcinoma cells. The absence of Tes in tumors and its ability to regulate Mena function could contribute to Mena-promoted invasion.
The increased EGF sensitivity of cells expressing Mena or MenaINV is interesting in light of the common resistance of metastatic cancer cells to EGFR inhibitory drugs, such as Iressa and/or Tarceva (Baselga and Arteaga, 2005). Upregulation of Mena or MenaINV could enable tumor cells to invade in the absence of a strong EGF signal and escape the action of these cancer treatments.
EXPERIMENTAL PROCEDURES
Molecular Cloning
EGFP-Ena/VASP family members and Mena splice isoforms were subcloned into the retroviral vector packaging Murine stem cell virus-EGFP using standard techniques. EGFP-MenaINV mutants were subcloned or generated using mutagenic polymerase chain reaction (PCR) primers (Stratagene) and confirmed by sequencing. mCherry-Mena and mCherry-MenaINV were expressed in a pCAX vector driven by the chicken β-actin promoter.
Cell Culture, Retroviral Packaging, Infection, and Fluorescence-Activated Cell Sorting
MTLn3 cells were cultured, starved, and stimulated with EGF (Invitrogen) as previously described (DesMarais et al., 2004). Retroviral packaging, infection, and fluorescence-activated cell sorting (FACS) were performed as previously described (Bear et al., 2000). EGFP-Mena MTLn3 cells were FACS sorted to a level of 4-fold overexpression of EGFP-Mena on the protein level. The MTLn3 MenaINV cell line was sorted for EGFP signal intensity levels similar to those of EGFP-Mena cells.
Immunoblotting
NP40 protein lysates were prepared, separated by SDS-PAGE, and probed with antibodies (anti-phospho Mena antiserum 3754 [1:250], anti-Erk, anti-phospho Erk, anti-phospho Akt and anti-phospho PLCγ [1:1000]; Cell Signaling) as previously described (Loureiro et al., 2002).
Transient Transfection
MTLn3 cells were transfected using Lipofectamine 2000 (Invitrogen) as previously described (Yamaguchi et al., 2005).
Immunofluorescence Microscopy
Cells were plated on glass coverslips, fixed and stained as previously described (Gertler et al., 1996). Anti-Mena (2197) was used at 1:400, anti N-WASP antibody was used as previously described (Yamaguchi et al., 2005), anti-p34-Arc antibody (Upstate) was used at 10 μg/ml, and Alexa-Fluor350 or 568 phalloidin (Molecular Probes) were used at 1:250 or 1:500. Cells were imaged using a Deltavision microscope (Applied Precision, Olympus IX71, 603/1.4NA Plan Apo objective) and processed using Softworx software (SGI, Mountain View, CA).
Live-Cell imaging
Cells were plated on glass-bottom dishes (MatTek) treated with 1 M HCl for 5 min, followed by 70% ethanol and PBS wash. Cells were imaged with an ORCA-ER camera (Hammamatsu) attached to a Nikon TE2000 microscope with dual Sutter filter wheels, a spinning disk confocal head (Yokagawa), a mercury light source, and a Coherent 70C 2 W multiline laser using 20×/0.75NA Plan Apo or 60×A/1.4NA Plan Apo Nikon objectives. All images were collected, measured, and compiled with the aid of Metamorph imaging software (Molecular Devices) and Adobe Photoshop. For time-lapse imaging, cells were kept at 37°C with the aid of a Solent incubation chamber (Solent Inc.).
Membrane Protrusion Assay
MTLn3 cells were starved for 3-4 hr in L15 medium (GIBCO BRL) supplemented with 0.35% BSA. For stimulation, cells were treated with a bath application of 5 or 0.5 nM EGF (Invitrogen) at 37°C. Time-lapse movies were recorded for 10 min with a 10 s interval after the addition of EGF. For CD experiments, 50 nM CD was added 30 min before EGF stimulation; DMSO served as a control. Area fold change was quantified by cell tracing, and cell area was measured using ImageJ (National Institutes of Health) and DIAS (Solltech) software. Area measurements of each cell were standardized over the area of the corresponding cell at time = 0, averaged and plotted over time after EGF stimulation.
Barbed-End Assay
The barbed-end assay was used as previously described (Chan et al., 1998). Quantitation of fluorescence intensity versus distance from the cell periphery was performed using ImageJ and macro analysis as previously described (Mouneimne et al., 2004). The average intensities corresponding to the zone between 0 and 0.26 μm inside the cell were plotted versus time after EGF stimulation.
Invadopodium Assay
Invadopodium assays were performed as described previously (Yamaguchi et al., 2005). Alexa568 protein labeling kit (Molecular Probes) was used to label fibronectin (Sigma-Aldrich). Cells were cultured on fibronectin-gelatin-coated dishes for 12-16 hr. To quantify invadopodium number, cells were stained with anti-cortactin antibody (1:100; Upstate Labs, Inc.) and scored as invadopodium positive if dot-like structures contained cortactin and colocalized with F-actin. Matrix degradation area was calculated using ImageJ. For invadopodium lifetime analysis, MTLn3 cells stably expressing GFP-actin (Lorenz et al., 2004) were transiently transfected with mCherry-Mena or mCherry-MenaINV constructs. Time-lapse series were taken at 37°C 24 hr after transfection using an Olympus IX70 microscope equipped with a CCD camera, humidified CO2 chamber, and autofocus system. Fluorescence images were taken every 2 min for up to 16 hr and analyzed using ImageJ.
In Vitro Invasion Assay
In vitro invasion assays were performed as previously described (Goswami et al., 2005). Briefly, MTLn3 cells were plated on MatTek dishes in the presence or absence of BAC1.2F5 cells, overlaid with 6 mg/ml collagen I after 16 hr, and fixed 24 hr later. For the AG1478 experiments, 6 μM AG1478 was added to the collagen gel and the overlaying media. DMSO addition served as control. Cells were analyzed using a confocal microscope by taking optical z sections every 5 μm starting at the bottom of the dish. To quantify invasion, GFP fluorescence was summed from z sections 20 μm and above and divided by the sum of GFP fluorescence in all z sections. Three-dimensional reconstructions were generated using Imaris Software (Bitplane AG).
Animal Models
Xenograft tumors were derived from subcutaneous injection of 1 × 10⁶ MTLn3-EGFP, MTLn3-EGFP-Mena, or MenaINV cells into the mammary gland of 5-7 wk-old female SCID mice (Wyckoff et al., 2004). All experiments were performed following 3-4 wk of tumor growth. Xenografts in Fisher 344 rats and nude mice were also derived in a similar manner for use in intravital imaging.
In Vivo Invasion Assay
The in vivo invasion assay was performed as previously described (Wyckoff et al., 2000b). In brief, six catheterized microneedles containing Matrigel and EGF (concentrations varying from 0.0 to 50 nM) were inserted into the primary tumor and held in place by micromanipulators. Following 4 hr of cell collection, the total number of tumor cells that migrated into each needle was quantified as previously described (Wyckoff et al., 2004). At least five mice were used per condition.
Lung Metastases
Spontaneous lung metastases were evaluated 4 wks after mammary gland injection. After animals were killed, the two largest lung lobes were extracted and metastases were investigated ex vivo using epifluorescence microscopy and quantified using a 60× 1.2 W immersion correction lens on an inverted Olympus IX70 (Wyckoff et al., 2000a). Lungs were then fixed in 4% paraformaldehyde and embedded in paraffin. Three sections from each lung lobe were cut, each 10 μM apart, and stained with H&E. Slides were visualized using light-field microscopy and quantified using a 5× 0.15NA Plan-NEO Fluar lens on an upright Zeiss AxioSkop2. Tumors were excised and weighed after animals were killed. At least 10 animals were used for each cell type.
Intravital Imaging
Following 16-24 days of tumor growth, animals were anesthetized and a skin flap was cut to expose the tumor. Anesthesia was maintained while the tumor was imaged within a 30°C heated chamber using an LSM510 laser scanning microscope connected to a Chameleon Coherent Ti-Sapphire laser or a Biorad Radiance 2000 multiphoton microscope with an inverted Olympus IX70 connected to a Spectra Physics Tsunami Ti-Sapphire laser. The objectives used were 20×, 40×, and 63× 1.2W immersion correction lenses. Time-lapse movies were analyzed for frequency of motility using ImageJ as previously described (Sahai et al., 2005); a cell was scored as motile if the translocation of the cell body was visible in the movies.
Statistical Analysis
Statistical significances were determined using unpaired, two-tailed Student’s t tests assuming equal variances and an alpha level of 0.05. Differences were considered significant if the p value was <0.05.
Supplementary Material
ACKNOWLEDGMENTS
We thank Corina Sarmiento, Michael Cammer, Katie Offer, Jose Medrano, Edward van Veen, and Elaine Pinheiro for comments, help, and technical support. We thank Mary Rowe and Tyler Jacks for helpful discussions. We acknowledge the MIT-CCR FACS and microscopy facilities and thank Eliza Vasile for assistance. U.P. was supported by the Anna Fuller Molecular Oncology Fund and the Ludwig Center for Molecular Oncology. S. Goswami and E.S. were funded by Breast Cancer Campaign (May 12, 2005 grant) and Cancer Research UK. Major funding was provided by National Cancer Institute grant CA100324 to J.B.W. and S. Goswami, and grant CA113395 for J.S.C. National Institutes of Health grant GM38511 to J.S.C., Integrated Cancer Biology Program grant 1-U54-CA112967 to D.A.L. and F.B.G., and National Institutes of Health grant GM58801 and funds from the Ludwig Center at the Massachusetts Institute of Technology to F.B.G.
REFERENCES
- Applewhite DA, Barzik M, Kojima S, Svitkina TM, Gertler FB, Borisy GG. Ena/VASP proteins have an anti-capping independent function in filopodia formation. Mol. Biol. Cell. 2007;18:2579–2591. doi: 10.1091/mbc.E06-11-0990. [DOI] [PMC free article] [PubMed] [Google Scholar]
- Bachmann C, Fischer L, Walter U, Reinhard M. The EVH2 domain of the vasodilator-stimulated phosphoprotein mediates tetramerization, F-actin binding, and actin bundle formation. J. Biol. Chem. 1999;274:23549–23557. doi: 10.1074/jbc.274.33.23549. [DOI] [PubMed] [Google Scholar]
- Barzik M, Kotova TI, Higgs HN, Hazelwood L, Hanein D, Gertler FB, Schafer DA. Ena/VASP proteins enhance actin polymerization in the presence of barbed end capping proteins. J. Biol. Chem. 2005;280:28653–28662. doi: 10.1074/jbc.M503957200. [DOI] [PMC free article] [PubMed] [Google Scholar]
- Baselga J, Arteaga CL. Critical update and emerging trends in epidermal growth factor receptor targeting in cancer. J. Clin. Oncol. 2005;23:2445–2459. doi: 10.1200/JCO.2005.11.890. [DOI] [PubMed] [Google Scholar]
- Bear JE, Loureiro JJ, Libova I, Fassler R, Wehland J, Gertler FB. Negative regulation of fibroblast motility by Ena/VASP proteins. Cell. 2000;101:717–728. doi: 10.1016/s0092-8674(00)80884-3. [DOI] [PubMed] [Google Scholar]
- Bear JE, Svitkina TM, Krause M, Schafer DA, Loureiro JJ, Strasser GA, Maly IV, Chaga OY, Cooper JA, Borisy GG, et al. Antagonism between Ena/VASP proteins and actin filament capping regulates fibroblast motility. Cell. 2002;109:509–521. doi: 10.1016/s0092-8674(02)00731-6. [DOI] [PubMed] [Google Scholar]
- Boeda B, Briggs DC, Higgins T, Garvalov BK, Fadden AJ, McDonald NQ, Way M. Tes, a specific Mena interacting partner, breaks the rules for EVH1 binding. Mol. Cell. 2007;28:1071–1082. doi: 10.1016/j.molcel.2007.10.033. [DOI] [PubMed] [Google Scholar]
- Buccione R, Orth JD, McNiven MA. Foot and mouth: podosomes, invadopodia and circular dorsal ruffles. Nat. Rev. Mol. Cell Biol. 2004;5:647–657. doi: 10.1038/nrm1436. [DOI] [PubMed] [Google Scholar]
- Butt E, Abel K, Krieger M, Palm D, Hoppe V, Hoppe J, Walter U. cAMP- and cGMP-dependent protein kinase phosphorylation sites of the focal adhesion vasodilator-stimulated phosphoprotein (VASP) in vitro and in intact human platelets. J. Biol. Chem. 1994;269:14509–14517. [PubMed] [Google Scholar]
- Chan AY, Raft S, Bailly M, Wyckoff JB, Segall JE, Condeelis JS. EGF stimulates an increase in actin nucleation and filament number at the leading edge of the lamellipod in mammary adenocarcinoma cells. J. Cell Sci. 1998;111:199–211. doi: 10.1242/jcs.111.2.199. [DOI] [PubMed] [Google Scholar]
- Chitaley K, Chen L, Galler A, Walter U, Daum G, Clowes AW. Vasodilator-stimulated phosphoprotein is a substrate for protein kinase C. FEBS Lett. 2004;556:211–215. doi: 10.1016/s0014-5793(03)01435-2. [DOI] [PubMed] [Google Scholar]
- Condeelis J, Pollard JW. Macrophages: obligate partners for tumor cell migration, invasion, and metastasis. Cell. 2006;124:263–266. doi: 10.1016/j.cell.2006.01.007. [DOI] [PubMed] [Google Scholar]
- Condeelis J, Segall JE. Intravital imaging of cell movement in tumours. Nat. Rev. Cancer. 2003;3:921–930. doi: 10.1038/nrc1231. [DOI] [PubMed] [Google Scholar]
- Dent EW, Kwiatkowski AV, Mebane LM, Philippar U, Barzik M, Rubinson DA, Gupton S, Van Veen JE, Furman C, Zhang J, et al. Filopodia are required for cortical neurite initiation. Nat. Cell Biol. 2007;9:1347–1359. doi: 10.1038/ncb1654. [DOI] [PubMed] [Google Scholar]
- DesMarais V, Macaluso F, Condeelis J, Bailly M. Synergistic interaction between the Arp2/3 complex and cofilin drives stimulated lamellipod extension. J. Cell Sci. 2004;117:3499–3510. doi: 10.1242/jcs.01211. [DOI] [PMC free article] [PubMed] [Google Scholar]
- Di Modugno F, Bronzi G, Scanlan MJ, Del Bello D, Cascioli S, Venturo I, Botti C, Nicotra MR, Mottolese M, Natali PG, et al. Human Mena protein, a serex-defined antigen overexpressed in breast cancer eliciting both humoral and CD8+ T-cell immune response. Int. J. Cancer. 2004;109:909–918. doi: 10.1002/ijc.20094. [DOI] [PubMed] [Google Scholar]
- Di Modugno F, Mottolese M, Di Benedetto A, Conidi A, Novelli F, Perracchio L, Venturo I, Botti C, Jager E, Santoni A, et al. The cytoskeleton regulatory protein hMena (ENAH) is overexpressed in human benign breast lesions with high risk of transformation and human epidermal growth factor receptor-2-positive/hormonal receptor-negative tumors. Clin. Cancer Res. 2006;12:1470–1478. doi: 10.1158/1078-0432.CCR-05-2027. [DOI] [PubMed] [Google Scholar]
- Di Modugno F, Demonte L, Balsamo M, Bronzi G, Nicotra MR, Alessio M, Jager E, Condeelis JS, Santoni A, Natali PG, et al. Molecular cloning of hMena (ENAH) and its splice variant hMena+11a: epidermal growth factor increases their expression and stimulates hMena+11a phosphorylation in breast cancer cell lines. Cancer Res. 2007;67:2657–2665. doi: 10.1158/0008-5472.CAN-06-1997. [DOI] [PMC free article] [PubMed] [Google Scholar]
- Ferron F, Rebowski G, Lee SH, Dominguez R. Structural basis for the recruitment of profilin-actin complexes during filament elongation by Ena/VASP. EMBO J. 2007;26:4597–4606. doi: 10.1038/sj.emboj.7601874. [DOI] [PMC free article] [PubMed] [Google Scholar]
- Gates J, Mahaffey JP, Rogers SL, Emerson M, Rogers EM, Sottile SL, Van Vactor D, Gertler FB, Peifer M. Enabled plays key roles in embryonic epithelial morphogenesis in Drosophila. Development. 2007;134:2027–2039. doi: 10.1242/dev.02849. [DOI] [PubMed] [Google Scholar]
- Gertler FB, Niebuhr K, Reinhard M, Wehland J, Soriano P. Mena, a relative of VASP and Drosophila Enabled, is implicated in the control of microfilament dynamics. Cell. 1996;87:227–239. doi: 10.1016/s0092-8674(00)81341-0. [DOI] [PubMed] [Google Scholar]
- Goswami S, Sahai E, Wyckoff JB, Cammer M, Cox D, Pixley FJ, Stanley ER, Segall JE, Condeelis JS. Macrophages promote the invasion of breast carcinoma cells via a colony-stimulating factor-1/epidermal growth factor paracrine loop. Cancer Res. 2005;65:5278–5283. doi: 10.1158/0008-5472.CAN-04-1853. [DOI] [PubMed] [Google Scholar]
- Goswami S, Philippar U, Sun D, Patsialou A, Avraham J, Wang W, Di Modugno F, Nistico P, Gertler FB, Condeelis JS. Identification of invasion specific splice variants of the cytoskeletal protein Mena present in mammary tumor cells during invasion in vivo. Clin. Exp. Metastasis. 2008 doi: 10.1007/s10585-008-9225-8. in press. [DOI] [PMC free article] [PubMed] [Google Scholar]
- Hinz B, Alt W, Johnen C, Herzog V, Kaiser HW. Quantifying lamella dynamics of cultured cells by SACED, a new computer-assisted motion analysis. Exp. Cell Res. 1999;251:234–243. doi: 10.1006/excr.1999.4541. [DOI] [PubMed] [Google Scholar]
- Huttelmaier S, Harbeck B, Steffens O, Messerschmidt T, Illenberger S, Jockusch BM. Characterization of the actin binding properties of the vasodilator-stimulated phosphoprotein VASP. FEBS Lett. 1999;451:68–74. doi: 10.1016/s0014-5793(99)00546-3. [DOI] [PubMed] [Google Scholar]
- Krause M, Dent EW, Bear JE, Loureiro JJ, Gertler FB. Ena/VASP proteins: regulators of the actin cytoskeleton and cell migration. Annu. Rev. Cell Dev. Biol. 2003;19:541–564. doi: 10.1146/annurev.cellbio.19.050103.103356. [DOI] [PubMed] [Google Scholar]
- Lebrand C, Dent EW, Strasser GA, Lanier LM, Krause M, Svitkina TM, Borisy GG, Gertler FB. Critical role of Ena/VASP proteins for filopodia formation in neurons and in function downstream of netrin-1. Neuron. 2004;42:37–49. doi: 10.1016/s0896-6273(04)00108-4. [DOI] [PubMed] [Google Scholar]
- Linder S. The matrix corroded: podosomes and invadopodia in extracellular matrix degradation. Trends Cell Biol. 2007;17:107–117. doi: 10.1016/j.tcb.2007.01.002. [DOI] [PubMed] [Google Scholar]
- Lorenz M, DesMarais V, Macaluso F, Singer RH, Condeelis J. Measurement of barbed ends, actin polymerization, and motility in live carcinoma cells after growth factor stimulation. Cell Motil. Cytoskeleton. 2004;57:207–217. doi: 10.1002/cm.10171. [DOI] [PubMed] [Google Scholar]
- Loureiro JJ, Rubinson DA, Bear JE, Baltus GA, Kwiatkowski AV, Gertler FB. Critical roles of phosphorylation and actin binding motifs, but not the central proline-rich region, for Ena/vasodilator-stimulated phosphoprotein (VASP) function during cell migration. Mol. Biol. Cell. 2002;13:2533–2546. doi: 10.1091/mbc.E01-10-0102. [DOI] [PMC free article] [PubMed] [Google Scholar]
- Mouneimne G, Soon L, DesMarais V, Sidani M, Song X, Yip SC, Ghosh M, Eddy R, Backer JM, Condeelis J. Phospholipase C and cofilin are required for carcinoma cell directionality in response to EGF stimulation. J. Cell Biol. 2004;166:697–708. doi: 10.1083/jcb.200405156. [DOI] [PMC free article] [PubMed] [Google Scholar]
- Mouneimne G, DesMarais V, Sidani M, Scemes E, Wang W, Song X, Eddy R, Condeelis J. Spatial and temporal control of cofilin activity is required for directional sensing during chemotaxis. Curr. Biol. 2006;16:2193–2205. doi: 10.1016/j.cub.2006.09.016. [DOI] [PubMed] [Google Scholar]
- Neri A, Welch D, Kawaguchi T, Nicolson GL. Development and biologic properties of malignant cell sublines and clones of a spontaneously metastasizing rat mammary adenocarcinoma. J. Natl. Cancer Inst. 1982;68:507–517. [PubMed] [Google Scholar]
- Pasic L, Kotova TI, Schafer DA. Ena/VASP proteins capture actin filament barbed ends. J. Biol. Chem. 2008;283:9814–9819. doi: 10.1074/jbc.M710475200. [DOI] [PMC free article] [PubMed] [Google Scholar]
- Sahai E, Wyckoff J, Philippar U, Segall JE, Gertler F, Condeelis J. Simultaneous imaging of GFP, CFP and collagen in tumors in vivo using multiphoton microscopy. BMC Biotechnol. 2005;5:14. doi: 10.1186/1472-6750-5-14. 10.1186/1472-6750-5-14. [DOI] [PMC free article] [PubMed] [Google Scholar]
- Segall JE, Tyerech S, Boselli L, Masseling S, Helft J, Chan A, Jones J, Condeelis J. EGF stimulates lamellipod extension in metastatic mammary adenocarcinoma cells by an actin-dependent mechanism. Clin. Exp. Metastasis. 1996;14:61–72. doi: 10.1007/BF00157687. [DOI] [PubMed] [Google Scholar]
- Sidani M, Wessels D, Mouneimne G, Ghosh M, Goswami S, Sarmiento C, Wang W, Kuhl S, El-Sibai M, Backer JM, et al. Cofilin determines the migration behavior and turning frequency of metastatic cancer cells. J. Cell Biol. 2007;179:777–791. doi: 10.1083/jcb.200707009. [DOI] [PMC free article] [PubMed] [Google Scholar]
- Svitkina TM, Bulanova EA, Chaga OY, Vignjevic DM, Kojima S.-i., Vasiliev JM, Borisy GG. Mechanism of filopodia initiation by reorganization of a dendritic network. J. Cell Biol. 2003;160:409–421. doi: 10.1083/jcb.200210174. [DOI] [PMC free article] [PubMed] [Google Scholar]
- van Rheenen J, Song X, van Roosmalen W, Cammer M, Chen X, Desmarais V, Yip SC, Backer JM, Eddy RJ, Condeelis JS. EGF-induced PIP2 hydrolysis releases and activates cofilin locally in carcinoma cells. J. Cell Biol. 2007;179:1247–1259. doi: 10.1083/jcb.200706206. [DOI] [PMC free article] [PubMed] [Google Scholar]
- Venables JP. Unbalanced alternative splicing and its significance in cancer. Bioessays. 2006;28:378–386. doi: 10.1002/bies.20390. [DOI] [PubMed] [Google Scholar]
- Wang W, Wyckoff JB, Frohlich VC, Oleynikov Y, Huttelmaier S, Zavadil J, Cermak L, Bottinger EP, Singer RH, White JG, et al. Single cell behavior in metastatic primary mammary tumors correlated with gene expression patterns revealed by molecular profiling. Cancer Res. 2002;62:6278–6288. [PubMed] [Google Scholar]
- Wang W, Goswami S, Lapidus K, Wells AL, Wyckoff JB, Sahai E, Singer RH, Segall JE, Condeelis JS. Identification and testing of a gene expression signature of invasive carcinoma cells within primary mammary tumors. Cancer Res. 2004;64:8585–8594. doi: 10.1158/0008-5472.CAN-04-1136. [DOI] [PubMed] [Google Scholar]
- Wang W, Mouneimne G, Sidani M, Wyckoff J, Chen X, Makris A, Goswami S, Bresnick AR, Condeelis JS. The activity status of cofilin is directly related to invasion, intravasation, and metastasis of mammary tumors. J. Cell Biol. 2006;173:395–404. doi: 10.1083/jcb.200510115. [DOI] [PMC free article] [PubMed] [Google Scholar]
- Wang W, Wyckoff JB, Goswami S, Wang Y, Sidani M, Segall JE, Condeelis JS. Coordinated regulation of pathways for enhanced cell motility and chemotaxis is conserved in rat and mouse mammary tumors. Cancer Res. 2007;67:3505–3511. doi: 10.1158/0008-5472.CAN-06-3714. [DOI] [PubMed] [Google Scholar]
- Wyckoff JB, Jones JG, Condeelis JS, Segall JE. A critical step in metastasis: in vivo analysis of intravasation at the primary tumor. Cancer Res. 2000a;60:2504–2511. [PubMed] [Google Scholar]
- Wyckoff JB, Segall JE, Condeelis JS. The collection of the motile population of cells from a living tumor. Cancer Res. 2000b;60:5401–5404. [PubMed] [Google Scholar]
- Wyckoff J, Wang W, Lin EY, Wang Y, Pixley F, Stanley ER, Graf T, Pollard JW, Segall J, Condeelis J. A paracrine loop between tumor cells and macrophages is required for tumor cell migration in mammary tumors. Cancer Res. 2004;64:7022–7029. doi: 10.1158/0008-5472.CAN-04-1449. [DOI] [PubMed] [Google Scholar]
- Wyckoff JB, Wang Y, Lin EY, Li JF, Goswami S, Stanley ER, Segall JE, Pollard JW, Condeelis J. Direct visualization of macrophage-assisted tumor cell intravasation in mammary tumors. Cancer Res. 2007;67:2649–2656. doi: 10.1158/0008-5472.CAN-06-1823. [DOI] [PubMed] [Google Scholar]
- Yamaguchi H, Lorenz M, Kempiak S, Sarmiento C, Coniglio S, Symons M, Segall J, Eddy R, Miki H, Takenawa T, et al. Molecular mechanisms of invadopodium formation: the role of the N-WASP-Arp2/3 complex pathway and cofilin. J. Cell Biol. 2005;168:441–452. doi: 10.1083/jcb.200407076. [DOI] [PMC free article] [PubMed] [Google Scholar]
- Yamaguchi H, Pixley F, Condeelis J. Invadopodia and podosomes in tumor invasion. Eur. J. Cell Biol. 2006;85:213–218. doi: 10.1016/j.ejcb.2005.10.004. [DOI] [PubMed] [Google Scholar]
Associated Data
This section collects any data citations, data availability statements, or supplementary materials included in this article.