Abstract
We demonstrate measurements of the efficiency of competing Förster-type energy-transfer pathways in single bichromophoric systems by monitoring simultaneously the fluorescence intensity, fluorescence lifetime, and the number of independent emitters with time. Peryleneimide end-capped fluorene trimers, hexamers, and polymers with interchromophore distances of 3.4, 5.9, and on average 42 nm, respectively, served as bichromophoric systems. Because of different energy-transfer efficiencies, variations in the interchromophore distance enable the switching between homo-energy transfer (energy hopping), singlet-singlet annihilation, and singlet-triplet annihilation. The data suggest that similar energy-transfer pathways have to be considered in the analysis of single-molecule trajectories of donor/acceptor pairs as well as in natural and synthetic multichromophoric systems such as light-harvesting antennas, oligomeric fluorescent proteins, and dendrimers. Here we report selectively visualization of different energy-transfer pathways taking place between identical fluorophores in individual bichromophoric molecules.
The current renaissance of the use of the fluorescence resonance energy-transfer (FRET) (1) process between two weakly coupled dipoles, one acting as donor and the other acting as acceptor, results from various elegant and successful studies of distance changes in individual biomolecules by using single-molecule spectroscopy (SMS). This type of study is often referred to as single-pair Förster resonance ET (2-4). Recent advances in fluctuation microscopy allow the observation of changes in the ET efficiency in single-pair Förster resonance ET systems at the millisecond-to-nanosecond time scale (5, 6). It has been suggested that, in the latter time scale, thermally excited conformational dynamics of (bio)macromolecules will become accessible (5). Thus far, FRET measurements at these time scales have overlooked competitive Förster-type ET pathways, which might complicate data analysis and interpretation of the FRET data. The FRET process involves nonradiative transfer from a donor to an acceptor. For molecules within the weak coupling limit, Förster derived an expression for the rate constant of dipole-dipole-induced ET (7). This relation shows that the ET efficiency scales with the sixth power of the distance between the chromophores:
 |
[1] |
Here, R0 is the distance at which the efficiency equals 50%, i.e., the distance at which an equal probability exists for the excited chromophore to relax to the ground state via emission of a photon or to undergo ET. It includes the spectral properties and the relative orientation (in terms of the orientation factor κ2) of donor and acceptor transition dipoles. If the distances and orientations of the chromophores are kept constant, the ET efficiency is determined by the spectral overlap of the corresponding transitions, i.e., the overlap of the emission spectrum of the donor and the absorption spectrum of the acceptor. Therefore, FRET can also occur between identical molecules if the Stokes shift is small enough to allow for a sufficient overlap of the emission and absorption spectrum of the chromophores. This so-called homo-transfer or energy hopping represents a key mechanism for energy transport in some light-harvesting complexes (8).
However, Förster-type resonance ET is not restricted to the nonradiative transfer of energy from a donor in the excited state to a ground-state acceptor. Transfer processes that are allowed within the Förster formalism are those for which there are no changes in electron spin in the acceptor transition. Therefore, even ET processes between donor and acceptor molecules with different spin multiplicity likewise are possible. Hence, the transfer of excitation energy from a chromophore residing in the first excited singlet (S) state to another chromophore residing either in the triplet (T) or in an excited singlet state are possible and competitive ET pathways.
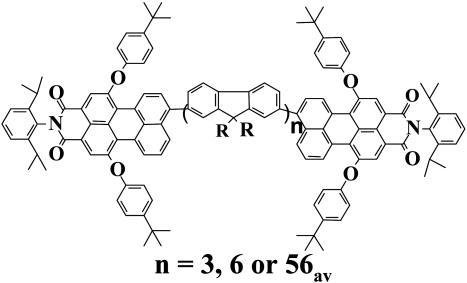
In the present contribution, we demonstrate that, because of the specific excitation conditions that are applied in SMS, indeed several Förster-type ET pathways are prevalent in single bichromophoric systems. The molecules that were used to visualize the different excited-state processes were peryleneimide (PI) end-capped fluorene trimers, hexamers, and polymers (see Fig. 1). Oligo- and polyfluorenes are conjugated polymers that have a high chemical inertness. Although oligo- and polyfluorenes themselves exhibit interesting fluorescence properties in the blue spectral region, we do not focus on the spectroscopy of the conjugated oligomers/polymers as such. The fluorene backbone merely serves as a rigid spacer that keeps both chromophores at well defined distances with a well defined, nearly parallel orientation (9, 10).
Fig. 1.
Structure of the compounds used in this study.
Materials and Methods
PI End-Capped Oligomers and Polymers. The synthesis of the compounds is described in ref. 9. The PI end-capped trimer and hexamer are monodispers. The end-capped polyfluorene has a number average molecular weight, Mn, of 20,700 g/mol and a polydispersity D of 2.1. From gel-permeation chromatography results one can deduce fractions and lengths for the polymer molecules. Only 5.5% of the polymer molecules will have ≤8 fluorene units, corresponding to a maximum length of the rigid spacer of 6 nm. The rest of the polymer molecules have between 8 and 400 repeat units, resulting in a maximum length of 300 nm assuming a fully stretched backbone. The average number of repeat units is 56, corresponding to an average length of the backbone of 42 nm. Although conjugated polymers are often called rigid, Barbara and coworkers (10) recently demonstrated that rigid polymers can collapse in so-called defect coils and cylinders due to chemical defects introduced in the synthesis. This can explain the fact that from the 72 measured polymer molecules, ≈25% show antibunching in the high-intensity level, whereas from the gel-permeation chromatography data only 5% is expected to do so (see Results and Discussion). Details on this observation and other indications that the polyfluorene backbone is not always fully elongated will be discussed in a separate paper.
Ensemble Spectroscopy. Steady-state spectroscopy was performed on a Perkin-Elmer Lambda 40 spectrophotometer and a Spex Industries (Metuchen, NJ) Fluorolog 1500 fluorimeter. The recording of the nanosecond-transient absorption spectrum and the determination of the extinction coefficient was performed by the setup described in refs. 11-13. The extinction coefficient of the S1 → Sn transition was estimated by comparing the height of the S1-Sn absorption band with the S0-S1 depletion band in the femtosecond transient absorption spectra of the trimer (14). The fact that the absolute values of both bands are very similar indicates that the extinction coefficients for both processes are similar (ε = 41,000 cm-1·M-1). A Förster radius of 5.9 nm was calculated based on this extinction coefficient and a κ2 of 4 (fully stretched backbone and transition dipoles oriented along the long axis of the chromophore).
Single-Molecule Measurements. For the single-molecule measurements, the different bichromophoric compounds were dispersed in a thin polymer film and investigated by confocal fluorescence microscopy at room temperature. Samples were prepared by spincoating at 1,000 rpm on a glass coverslip a toluene solution of 3 mg/ml polymethyl metacrylate containing a 10-10 M concentration of the different bichromophoric compounds. Atomic force microscopy measurements showed a film thickness between 200 and 300 nm. The confocal fluorescence microscope that works in the epiluminescence mode is described elsewhere in more detail (15). As excitation light we used the 488-nm line of a continuous-wave argon ion laser (Stabilite, Spectra-Physics) or the frequency-doubled output of a Ti-Sapphire laser (Tsunami, Spectra-Physics, 8.18 MHz and 1.2 ps full-width, half-maximum). The applied power was 400-600 W/cm2 at the sample for continuous wave light and 2.1 kW/cm2 for pulsed-light experiments.
Antibunching Measurements. A setup similar to a Hanbury-Brown, Twiss-type of setup (16) was used to perform the antibunching experiments. The fluorescence emission is split and detected on two single-photon avalanche photodiodes, and the measured time intervals between the photons are then histogrammed. The time-correlated single-photon counting (TCSPC board 630, Becker & Hickl) computer board used records for each photon (i) the absolute arrival time after the beginning of the acquisition with a resolution of 50 ns and (ii) the time delay between the start pulse and stop pulse with a picosecond time resolution. In addition, the TCSPC board records the channel (avalanche photodiode 1 or 2) from which each photon was detected. A LABVIEW routine was designed to obtain the appropriate signature of antibunching from the recorded data. More details on the setup can be found in refs. 17 and 18.
Calculations. Ground-state (S0) and excited-state (S1, T1) geometries of the PI molecules have been optimized at the Austin model 1-configuration interaction (AM1/CI) level. These geometries then were used as input for intermediate neglect of differential overlap (INDO)/multireference determinant (MRD)-CI calculations of the singlet and triplet excitation energies (coupled cluster singles and doubles and AM1/CI calculations were also performed and yielded similar results). The transition densities calculated for all relevant excitations were computed and injected into a distributed monopole expansion of the ET electronic coupling matrix element (19). For each pair of donor/acceptor states, a partial rate is computed as the product of the corresponding electronic coupling squared and the overlap factor between donor emission and acceptor absorption. The total transfer rates then were obtained by summing over all possible pathways for each process [i.e., for S (T) annihilation, by considering all Sn (Tn) states leading to significant overlap between excited-state S1 (T1) absorption and S1 emission]. The INDO/MRD-CI calculations indicate strong singlet excited-state absorption to the red of the S1 emission and strong triplet absorption overlapping with the S1-S0 emission band and extending further to the blue. Most of these transitions are polarized along the chain axis and have comparable intensities. To avoid any possible contamination due to overestimated theoretical transition energies, the dynamics of the ET was investigated by considering both the calculated transition energies and the experimental ones (shifting all transitions to reproduce the ground-state and excited-state absorption peaks). A vibrational mode analysis based on a displaced harmonic oscillator model (Huang-Rhys formalism) was performed in both the singlet ground state and excited state. A single ”effective mode” at 1,500 cm-1 was used to account for the vibrational progression observed experimentally for singlet emission and absorption (with Huang-Rhys factors of 0.79 and 0.89 for emission and absorption, respectively). Theoretical Förster radii were extracted corresponding to the distances for which the rates for energy migration and exciton decay are equal (Table 1).
Table 1. Förster radii.
| Experimental results, nm | Theoretical results, nm | |
|---|---|---|
| Hopping | 5.4 | 4.8 |
| Singlet annihilation | 5.9 | 6.0 |
| Triplet annihilation | 8.7 | 6.5 |
In agreement with the experimental findings, the annihilation processes are found to be more efficient than singlet hopping. However, the calculations underestimate the efficiency of S-T vs. S-S annihilation. Note that the overall description remains unchanged when switching from the measured to the calculated excitation energies.
Results and Discussion
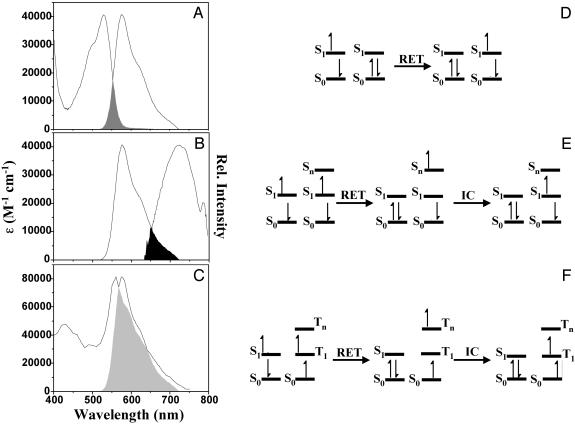
Possible Förster-Type ET Pathways. When investigating a bichromophoric system containing two identical chromophores, three competing Förster-type ET pathways have to be considered (Fig. 2). Depending on the excitation probability and excitation intensity, three scenarios are possible. (i) One of the two chromophores will absorb a photon and decay back to the ground state via internal conversion or emission of a fluorescence photon or will transfer its energy to the other chromophore via energy hopping. (ii) Both chromophores were excited almost simultaneously, resulting in a bichromophore system in which each of the chromophores is in the first excited state S1. If the fluorescence of the chromophores is in resonance with a transition of S1 to higher excited singlet states, i.e., a S1 → Sn transition, ET between the excited singlet states can occur (see Fig. 2E). Because the process results in only one excited state remaining in the bichromophoric system, it is often referred to as S-S annihilation. Although the excitation of both chromophores within their fluorescence lifetime can be considered as a rare event under moderate excitation conditions, it influences the measured photon statistics in a specific manner (see below). (iii) After excitation, one of the chromophores undergoes inter-system crossing to a triplet state T1. When the second chromophore is excited, again two excited states are present simultaneously in the bichromophoric molecule: a singlet excited state (S1) and a triplet excited state (T1). If the triplet state exhibits transitions into higher excited triplet states, Tn, that are in resonance with the S1 → S0 transition, S-T ET (i.e., ET from the excited singlet state to the energetically lower lying triplet state) can occur. This process is often called S-T annihilation because the net result is one excited state in the bichromophoric system in this case a triplet state. A schematic representation of the three processes is given in Fig. 2 D-F.
Fig. 2.
Spectra of the different transitions in PI and schematic representation of the corresponding Förster-type ET pathways. (A) Ground-state absorption spectrum and fluorescence spectrum of PI. (B) Fluorescence spectrum and S1 absorption spectrum of PI. (C) Fluorescence spectrum and T1 absorption spectrum of PI. The extinction coefficients of the different absorption spectra are indicated on the left axis, and the fluorescence spectra are normalized to the peak extinction coefficient to illustrate the change in overlap for the different processes. (D-F) Schematic representation of the different Förster-type energy pathways in PI. The pathways represented are energy hopping, S-S annihilation, and S-T annihilation, respectively.
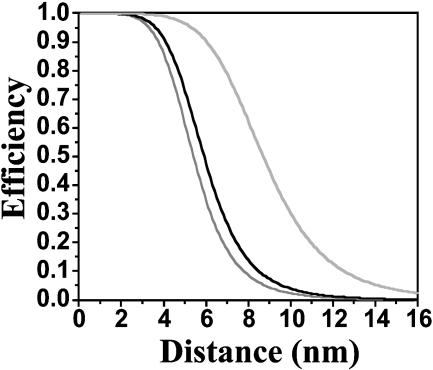
The center-to-center distance between the two PI units is 3.4 nm and 5.9 nm in the trimer and hexamer, respectively. PI units of the polymer (Mw = 20,700, D = 2.1) are separated by an average distance of 42 nm (9). When focusing on a single bichromophore, the rates of energy hopping, S-S annihilation, and S-T annihilation are controlled by the spectral overlap of the PI emission and the S0 → S1, S1 → Sn, and T1 → Tn transitions, respectively, as well as the relative orientation of the corresponding transition dipole moments. The corresponding spectra are depicted in Fig. 2 A-C. Evidently, the overlap is smallest for energy hopping and somewhat larger for S-S annihilation, whereas a nearly perfect overlap is found for S-T annihilation between two PI chromophores. Quantitatively, the extinction coefficients (in toluene and in the absorption maximum) are 41,000 M-1·cm-1 for the S0 → S1, 41,000 M-1·cm-1 for the S1 → Sn, and 84,000 M-1·cm-1 for the T1 → Tn transition (11, 12, 14, 20, 21). Using an orientation factor (κ2) of 4 for perfectly parallel dipoles of the chromophores gives R0 values of 5.4, 5.9, and 8.7 nm for energy hopping, S-S annihilation, and S-T ET, respectively. For the molecules investigated in this study, the assumption of κ2 being 4 is reasonable (see structures in Figs. 1 and 3). Note, however, that as the different processes are compared within the same molecule, a different value of κ2 would only lead to reduced R0 values, but the relative values would have similar ratios. Correlated quantum-chemical studies of the various ET processes support the higher efficiency of the annihilation processes with respect to singlet hopping (19).
Fig. 3.
Distance dependence of the efficiency of the different Förster-type energy pathways. The dark-gray, black, and gray curves represent hopping, S-S annihilation, and S-T annihilation, respectively.
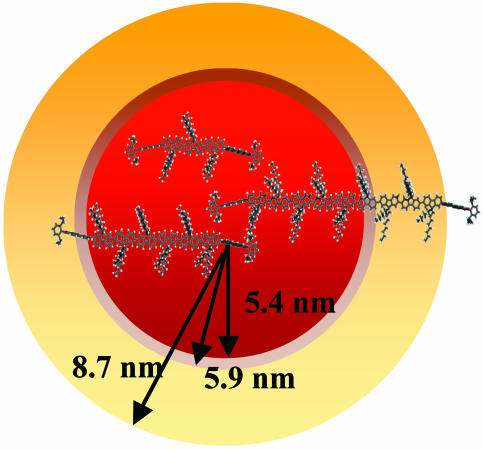
Visualization of the Energy Hopping by SMS. We can deduce from the calculated ET efficiencies (Fig. 3) that, for the end-capped trimer, all three ET processes can occur with high efficiency and therefore will compete with fluorescence. In Fig. 4 the compounds are depicted with a size that is scaled with the Förster radius of the different processes. Energy hopping in the trimeric compound was demonstrated experimentally by time-resolved fluorescence anisotropy measurements in solution (22). In single-molecule measurements, energy hopping can be revealed by monitoring the polarization of the emitted photons when exciting with linearly polarized light, as was done for related PI dendrimers (23, 24). The calculated ET efficiencies plotted in Fig. 3 indicate that, if the center-to-center distance between the two chromophores is increased from 3.4 nm in the trimer to 5.9 nm in the hexameric compound or 42 nm in the polymer, energy hopping is no longer efficient, because the center-to-center distance between the chromophores becomes too large.
Fig. 4.
Optimized structures [force-field calculations in spartan (Wave-function, Irvine, CA)] of the PI end-capped fluorene trimer, hexamer, and polymer. The size of the molecules is scaled with the R0 values of the different ET processes (red, hopping; brown, S1-S1 annihilation; yellow, S1-T1 annihilation).
Visualization of S1-S1 Annihilation by SMS. Because of the limited time resolution (≈300 ps) presently provided by avalanche photodiodes used for SMS, the observation of the S-S annihilation process as a fast, excitation intensity-dependent decay component in time-resolved fluorescence measurements is impossible (14). Indirect evidence for the process can be obtained. A saturation of the fluorescence intensity with increasing excitation power impinged on an individual bichromophoric system eventually points toward an annihilation process. However, other processes such as triplet shelving would lead to a similar saturation. More unambiguous evidence for the annihilation phenomenon can be obtained due to the fact that for a single chromophore the probability of emitting two consecutive photons drops to zero for time intervals shorter than the excited-state lifetime, which results from the fact that a chromophore cannot emit two photons simultaneously. After photon emission, a chromophore must be re-excited and wait, on average, a time interval equal to the fluorescence lifetime before another photon can be emitted. This property of the photon arrival-time statistics, termed photon antibunching, has been measured at room temperature under continuous-wave laser illumination as well as under pulsed-laser illumination for individual molecules by measuring the interphoton arrival times (25-27). These are histogrammed to get the interphoton arrival-times distribution. For pulsed-laser excitation, as we use, the distribution of arrival times is dominated largely by the laser repetition rate, because interphoton times are always a multiple of the interval between laser pulses (neglecting dark and background counts, which arrive at random and the uncertainty due to the excited state S1 lifetime) (17, 18). For a single emitter, the zero peak, which represents pairs of fluorescence photons generated during a single laser pulse, is necessarily vacant as long as the laser-pulse width is much smaller than the fluorescence lifetime of the molecule. This technique represents a method for distinguishing between one or more emitting excited states present simultaneously in a multichromophoric system. Thus, for a bichromophoric system under pulsed-excitation conditions, the absence of the peak at zero delay in the interphoton arrival-times distribution demonstrates the existence of an efficient S-S annihilation process. Inefficient S-S annihilation in a bichromophoric molecule results in detection of pairs of fluorescence photons generated during a single laser pulse, i.e., the peak at zero delay appears. Ideally this peak should be half as intense as the other peaks in the histogram for two independent and equally emitting chromophores (18).
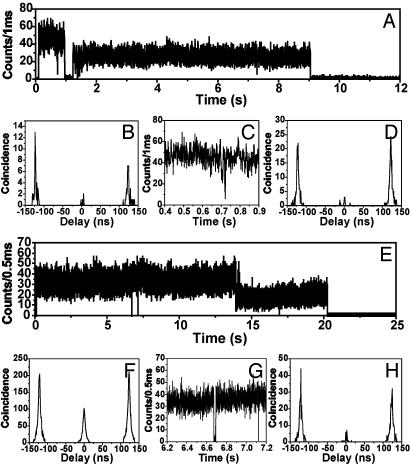
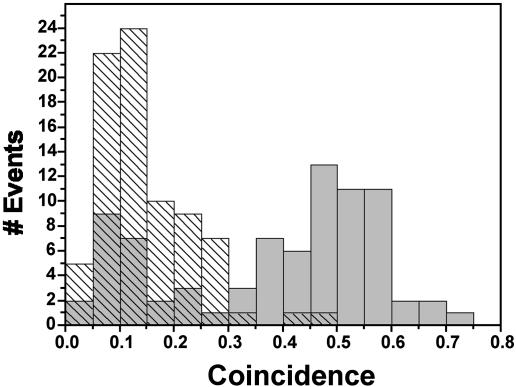
Fig. 5A shows the time course of fluorescence intensity recorded from a hexameric bichromophoric molecule with a center-to-center distance of 5.9 nm, i.e., just within the high efficiency regime for S-S annihilation. The fluorescence intensity trace shows two stable intensity levels as a result of consecutive bleaching of the chromophores. Because of efficient S-S annihilation, the interphoton arrival-time distribution shows only a few accidental coincidence events in the zero peak for both intensity levels (Fig. 5 B and D). Although two chromophores absorb, only one emits. The fluorescence intensity trace shown in Fig. 5E was recorded from a polymer molecule with a spacer sufficiently long to prevent efficient annihilation. The average interchromophore distance is 42 nm, i.e., well outside the range for efficient S-S annihilation. As expected for two independently emitting chromophores, in the first intensity level where two chromophores are still active, the central peak in the interphoton arrival-times distribution is half as intense as the other peaks (Fig. 5F). After bleaching of one of the chromophores, the distribution shows again the fingerprint characteristic expected for a single emitter (Fig. 5H). These data are substantiated further in the histogram shown in Fig. 6, which is constructed from the coincidence data obtained from 80 individual polymer molecules. The data in gray represent values obtained for the first (high) intensity level. The dashed data represent values obtained for the second (low) intensity level. As expected, the latter are centered on 0.1. The width of the distribution can be explained by the lower signal-to-noise ratio in this intensity level. The data for the high-intensity level clearly show a bimodal distribution, indicating two classes of polymer molecules. The first class shows a coincidence value centered on 0.1 pointing to the fraction of polymer with a short chain between the two chromophores. Also, the polymer chains that adopted collapsed conformations might show up in this part of the histogram. The second class of polymer molecules has interchromophore distances that prevent S-S annihilation. The are responsible for the peak centered on 0.5.
Fig. 5.
Typical intensity traces and interphoton arrival-time distributions recorded for the hexameric compound (46 molecules analyzed) and the polymer (80 molecules analyzed) dispersed in a polymethyl-metacrylate polymer matrix. Only those traces that have two distinct intensity levels for which the decay time in both levels is similar to the decay time in solution (4 ns) are analyzed. This is to exclude from the analysis dimers or oligomers resulting from the tendency of the fluorene backbone to aggregate. (A) Data recorded for the hexamer. The intensity trace shows two levels as expected for a bichromophoric molecule and consecutive bleaching. Interphoton arrival-time distributions taken from the first intensity level (B) and the second intensity level of the trace (D, after 1 s) show a vanishing, small central peak, although high-excitation powers were used. This directly demonstrates that efficient S-S annihilation takes place in this individual hexamer. After ≈0.72 s, a collective on/off jump can be observed in the high-intensity level, as can be seen in C. This is explained by the generation of a triplet and subsequent opening of the S-T ET pathway. After the disappearance of the triplet, the molecule switches again to the S-S annihilation pathway. The original long off period (duration of 300 ms) occurring at 1.1 s is not understood at the moment. (E) Intensity trace recorded for a PI end-capped polymer. The appearance of the interphoton arrival-time histograms, however, is completely different, although identical excitation conditions are used. In the high-intensity level, clearly coincident photons are detected as reflected in the ratio of the lateral to the central peak of 0.5 (F). This shows that S-S annihilation is not an efficient ET pathway for this molecule. (G) The only efficient ET pathway that is present temporarily in the molecule is S-T annihilation, which is reflected in the collective on/off jumps after 6.7 and 7.1 s in the intensity trace. (H) The interphoton arrival-times distribution of the second intensity level, corresponding to a situation in which one chromophore is bleached, clearly shows the pattern one expects for a single emitter.
Fig. 6.
Histogram of the ratio of central peak over the side peak (coincidence value) of the interphoton arrival-time distributions measured for 80 individual polymer molecules.
Visualization of S1-T1 Annihilation by SMS. The transients depicted in Fig. 5 A and E both show one or more collective off states in the high-intensity level, which we attributed to a system with two intact chromophores (Fig. 5 C and G). Such collective on/off jumps have been explained by the presence of a temporary trap such as the formation of radical ions or triplet states capable of quenching the fluorescence of the whole system (23, 28, 29). Creation of a triplet state on one of the chromophores and subsequent S-T ET would account for the collective on/off jumps observed (23). The transient in Fig. 5A is an unambiguous example of a molecule that switches between different ET pathways. Whereas initially S-S annihilation is the only active ET pathway, after one of the two chromophores undergoes inter-system crossing to the triplet state, the S-T annihilation becomes the dominating ET pathway. The molecule switches back to S-S annihilation only after disappearance of the triplet state. As shown in Figs. 2 and 4, the S-T annihilation is more efficient than S-S annihilation for the PI chromophore. Therefore, efficient S-T annihilation is a process that has to be considered for bichromophoric molecules with interchromophore distances larger than the dimensions of the hexamer. As can be seen in Fig. 3, S-T annihilation indeed is still reasonably efficient for molecules with a length of up to 12 nm. The transient and interphoton arrival-time distributions in Fig. 5 E and F clearly show that, for this particular molecule, the length of the spacer is such that S-S annihilation will not occur, whereas S-T annihilation is still possible. It is important to note that this process could also explain the appearance of so-called dim levels in multichromophoric molecules (30). When the S-T annihilation is inefficient because of the separation distance or the relative orientation of dipoles, singlet excited states created in a multichromophoric entity have a smaller but not negligible chance to decay by emitting a photon instead of being quenched. S-T annihilation is clearly a process that needs to be considered for the PI chromophore in relation with the observed collective on/off jumps but not necessarily the only process. We have evidence that both the radical anion and cation of PI have transitions in the visible part of the spectrum. Both can eventually be related to some of the observed collective on/off jumps related to the PI chromophore (31).
Conclusions
The examples presented here clearly demonstrate that different ET pathways exist in the investigated bichromophoric systems. For the molecules in this study, we could identify three Förster-type ET pathways: energy hopping, S-S annihilation, and S-T annihilation. In SMS of bi- and multichromophoric systems, S-S annihilation is expressed through antibunching, whereas S-T annihilation can be identified from collective on/off jumps. These data represent direct visualization of and switching between different ET pathways within one molecule. The extent to which the ET processes are competitive at a given distance depends mainly on the spectral overlap of the transitions that are involved. It is safe to assume that similar pathways have to be envisioned in molecules labeled with donor/acceptor pairs and in natural and synthetic multichromophoric systems such as light-harvesting antennas, tetrameric fluorescent proteins, polymers, and dendrimers (28, 29, 30-34). Whether these transfer pathways play an important role in the photophysics of such systems will depend on the spectroscopic properties of the chromophores involved. The results presented here suggest that fluctuation analysis of data obtained from biomolecules (5, 35) labeled with a FRET pair should be interpreted carefully, especially in times scales where competitive processes take place.
Acknowledgments
We thank Dr. Latterini for measuring the extinction coefficient and spectrum of the T1 → Tn transition of PI. M.C. thanks the Katholieke Universiteit Leuven for a postdoctoral fellowship. We gratefully acknowledge support of the Fonds voor Wetenschappelijk Onderzoek, the Flemish Ministry of Education (Grant GOA 2/01), Volkswagon-Stiftung, the Bundesministerium für Bildung, Wissenschaft, Forschung und Technologie, the European Union (the Training and Mobility of Researchers Submicron Imaging and Stimulus Induced Transformation of Organic Molecular Adsorbates at Surfaces program), and the Federale Diensten voor Wetenschappelijke, Technische en Culturele Aangelegenheden Belgium (Grant IUAP-V-03). The work at the University of Arizona was supported by National Science Foundation Grant CHE-0078819. The work in Mons was supported by the Belgian National Science Foundation (FNRS). D.B. is a Research Associate from FNRS.
Abbreviations: ET, energy transfer; FRET, fluorescence resonance ET; SMS, single-molecule spectroscopy; S, singlet; T, triplet; PI, peryleneimide.
References
- 1.Selvin, P. R. (2000) Nat. Struct. Biol. 7, 730-734. [DOI] [PubMed] [Google Scholar]
- 2.Dahan, M., Deniz, A. A., Ha, T. J., Chemla, D. S., Schultz, P. G. & Weiss, S. (1999) Chem. Phys. 247, 85-106. [Google Scholar]
- 3.Grunwell, J. R., Glass, J. L., Lacoste, T. D., Deniz, A. A., Chemla, D. S. & Schultz, P. G. (2001) J. Am. Chem. Soc. 123, 4295-4303. [DOI] [PubMed] [Google Scholar]
- 4.Zhuang, X. W., Kim, H., Pereira, M. J. B., Babcock, H. P., Walter, N. G. & Chu, S. (2002) Science 296, 1473-1476. [DOI] [PubMed] [Google Scholar]
- 5.Berglund, A. J., Doherty, A. C. & Mabuchi, H. (2002) Phys. Rev. Lett. 89, 0681011-0681014. [DOI] [PubMed] [Google Scholar]
- 6.Köhn, F., Hofkens, J., Gronheid, R., Cotlet, M., Müllen, K., Van der Auweraer, M. & De Schryver, F. C. (2002) ChemPhysChem 3, 1005-1013. [DOI] [PubMed] [Google Scholar]
- 7.Förster, T. (1959) Discuss. Farraday Soc. 27, 7-17. [Google Scholar]
- 8.Andrews, D. L. & Demidov, A. A. (1999) Resonance Energy Transfer (Wiley, New York), 1st Ed.
- 9.Ego, C., Marsitzky, D., Becker, S., Zhang, J., Grimsdale, A. C., Müllen, K., Devin MacKenzie, J., Silva, C. & Friend, R. H. (2003) J. Am. Chem. Soc. 125, 437-443. [DOI] [PubMed] [Google Scholar]
- 10.Hu, D. H., Yu, J., Wong, K., Bagchi, B., Rossky, P. J. & Barbara, P. F. (2000) Nature 405, 1030-1033. [DOI] [PubMed] [Google Scholar]
- 11.Aloisi, G. G., Elisei, F. & Latterini, L. (1992) J. Chem. Soc. Faraday Trans. 88, 2139-2145. [Google Scholar]
- 12.Carmichael, I. & Hug, G. L. (1986) J. Phys. Chem. Ref. Data 15, 1-250. [Google Scholar]
- 13.Hofkens, J., Schroeyers, W., Loos, D., Cotlet, M., Kohn, F., Vosch, T., Maus, M., Herrmann, A., Müllen, K., Gensch, T. & De Schryver, F. C. (2001) Spectrochim. Acta A 57, 2093-2107. [DOI] [PubMed] [Google Scholar]
- 14.De Belder, G., Schweitzer, G., Jordens, S., Lor, M., Mitra, S., Hofkens, J., De Feyter, S., Van der Auweraer, M., Herrmann, A., Weil, T., et al. (2001) ChemPhysChem 2, 49-55. [DOI] [PubMed] [Google Scholar]
- 15.Hofkens, J., Verheijen, W., Shukla, R., Dehaen, W. & De Schryver, F. C. (1998) Macromolecules 31, 4493-4497. [Google Scholar]
- 16.Hanbury-Brown, R. & Twiss, R. (1956) Nature 177, 27-30. [Google Scholar]
- 17.Weston, K. D., Dyck, M., Tinnefeld, P., Muller, C., Herten, D. P. & Sauer, M. (2002) Anal. Chem. 74, 5342-5349. [DOI] [PubMed] [Google Scholar]
- 18.Tinnefeld, P., Muller, C. & Sauer, M. (2001) Chem. Phys. Lett. 345, 252-258. [Google Scholar]
- 19.Beljonne, D., Cornil, J., Silbey, R., Millié, P. & Brédas, J. L. (2000) J. Chem. Phys. 112, 4749-4758. [Google Scholar]
- 20.Gronheid, R., Hofkens, J., Kohn, F., Weil, T., Reuther, E., Müllen, K. & De Schryver, F. C. (2002) J. Am. Chem. Soc. 124, 2418-2419. [DOI] [PubMed] [Google Scholar]
- 21.Maus, M., De, R., Lor, M., Weil, T., Mitra, S., Wiesler, U. M., Herrmann, A., Hofkens, J., Vosch, T., Müllen, K. & De Schryver, F. C. (2001) J. Am. Chem. Soc. 123, 7668-7676. [DOI] [PubMed] [Google Scholar]
- 22.Jäckel, F., De Feyter, S., Hofkens, J., Kohn, F., De Schryver, F. C., Ego, C., Grimsdale, A. & Müllen, K. (2002) Chem. Phys. Lett. 362, 534-540. [Google Scholar]
- 23.Hofkens, J., Maus, M., Gensch, T., Vosch, T., Cotlet, M., Kohn, F., Herrmann, A., Müllen, K. & De Schryver, F. C. (2000) J. Am. Chem. Soc. 122, 9278-9288. [Google Scholar]
- 24.Vosch, T., Hofkens, J., Cotlet, M., Kohn, F., Fujiwara, H., Gronheid, R., Van Der Biest, K., Weil, T., Herrmann, A., Müllen, K., et al. (2001) Angew. Chem. Int. Ed. Engl. 40, 4643-4646. [DOI] [PubMed] [Google Scholar]
- 25.Lounis, B. & Moerner, W. E. (2000) Nature 407, 491-493. [DOI] [PubMed] [Google Scholar]
- 26.Tinnefeld, P., Weston, K. D., Vosch, T., Cotlet, M., Weil, T., Hofkens, J., Müllen, K., De Schryver, F. C. & Sauer, M. (2002) J. Am. Chem. Soc. 124, 14310-14311. [DOI] [PubMed] [Google Scholar]
- 27.Hübner, C. G., Zumofen, G., Renn, A., Hermann, A., Müllen, K. & Basche, T. (2003) Phys. Rev. Lett. 91, 093903-1-093903-4. [DOI] [PubMed] [Google Scholar]
- 28.VandenBout, D. A., Yip, W. T., Hu, D. H., Fu, D. K., Swager, T. M. & Barbara, P. F. (1997) Science 277, 1074-1077. [Google Scholar]
- 29.Yu, J., Hu, D. H. & Barbara, P. F. (2000) Science 289, 1327-1330. [DOI] [PubMed] [Google Scholar]
- 30.Tinnefeld, P., Herten, D. P. & Sauer, M. (2001) J. Phys. Chem. A 105, 7989-8003. [Google Scholar]
- 31.Vosch, T., Cotlet, M., Hofkens, J., Van Der Biest, K., Lor, M., Weston, K., Tinnefeld, P., Sauer, M., Latterini, L., Müllen, K. & De Schryver, F. C. (2003) J. Phys. Chem. A 107, 6920-6931. [Google Scholar]
- 32.van Oijen, A. M., Ketelaars, M., Köhler, J., Aartsma, T. J. & Schmidt, J. (1999) Science 285, 400-402. [DOI] [PubMed] [Google Scholar]
- 33.Bopp, M. A., Jia, Y. W., Li, L. Q., Cogdell, R. J. & Hochstrasser, R. M. (1997) Proc. Natl. Acad. Sci. USA 94, 10630-10635. [DOI] [PMC free article] [PubMed] [Google Scholar]
- 34.Cotlet, M., Hofkens, J., Habuchi, S., Dirix, G., Van Guyse, M., Michiels, J., Vanderleyden, J. & De Schryver, F. C. (2001) Proc. Natl. Acad. Sci. USA 98, 14398-14403. [DOI] [PMC free article] [PubMed] [Google Scholar]
- 35.Tinnefeld, P., Buschmann, V., Weston, K. D. & Sauer, M. (2003) J. Phys. Chem. A 107, 323-327. [Google Scholar]


