

Abstract
The existence of a coupling between changes in neuronal activity, cerebral blood flow and blood oxygenation is well known. The explicit relationship between these systems, however, is complex and remains a subject of intense research. Here, we use direct electrophysiological recordings to predict blood flow and oxygenation changes measured with optical methods during parametric stimulation applied to the somatosensory cortex in rat brain. Using a multimodal model of the cerebral functional unit, we estimate a neurovascular and a neuro-metabolic transfer function relating the experimentally measured neural responses with the inputs to a vascular model predicting hemodynamic and blood oxygenation changes. We show that our model can accurately predict experimentally measured parametric hemodynamic evoked responses by using a single linear transfer function relationship with a reduced number of state parameters to relate the level of neural activity to evoked cerebral blood flow and oxygen metabolism changes. At the same time, we characterize the metabolic and vascular neural response functions and interpret their physiological significance.
1. Introduction
The ability to observe functional activation of the human brain has been progressing rapidly in recent years through the advancement of several hemodynamic-dependent techniques, such as optical methods (Villringer and Chance 1997, Strangman et al 2002), functional magnetic resonance imaging (Moonen and Bandettini 1999, Ogawa et al 1990) and positron emission tomography (Carson et al 1998). These techniques are primarily used to study changes in brain activity at the metabolic and vascular levels, thus providing a picture of what happens in the brain following neuronal activation. Electro-encephalography (EEG) and magneto-encephalography (MEG) provide more direct measures of the underlying neuronal activation, but these imaging technologies have limitations to their spatial resolution and identification of unique brain activation patterns. Regardless of whether neural or vascular-based imaging methods are used, the picture provided is incomplete. The ability to provide a comparison between these two types of experiments is crucial to furthering understanding of the brain and providing an interpretation of results from across the growing number of studies utilizing differing and in some cases concurrent multi-modal neuroimaging techniques. Currently, the intrinsic relationships between neuronal activation and the resulting metabolic and vascular responses are poorly understood (Buxton et al 2004,Riera et al 2008).
At the biochemical level, neural–vascular and neural–metabolic relationships have intensely been studied (see Aubert et al (2001), Aubert and Costalat (2002) for an overview); however, the relationship of these microscopic results to human-scale neuroimaging studies is difficult. The introduction of vascular descriptions, such as the Balloon model proposed by Buxton et al (1998), and the Windkessel model by Mandeville et al (1999), and their later advancements to consider oxygen transport into the tissue from the different vascular compartments (Zheng et al 2002, 2005, Vazquez et al 2006, Huppert et al 2007), has offered tools to study the interplay between blood flow, volume and oxygenation and observable hemodynamic measurements made by fMRI or optical methods. Connecting these vascular and oxygen transport models to the underlying neuronal activity, however, is more complex. Friston et al (2000) included the dynamics of perfusion changes that are contingent on underlying synaptic activation to describe hemodynamics as predicted by the Balloon model in an input-state-output model. This model used a fixed canonical linear transfer function to model these neuro-vascular and neuro-metabolic relationships, which provided predictive information about the fMRI signal, but did not provide a means to directly estimate the parameters of this transfer function. Conversely, Riera et al (2005) proposed a bottom-up approach to estimate parameters from electroencephalogram (EEG) and fMRI fused data on humans and link neural-source and vascular-source signals. In the Rierra model, both EEG and fMRI data were treated as observable outputs of the system and the model was inverted in order to estimate the internal parameters and states within the model that jointly predicted these dual outputs. This model provided a framework to empirically estimate the neuro-vascular relationship, but made assumptions about the linearity of this relationship by relying on a biologically-plausible, but untested, model.
The purpose of this study was to investigate the plausibility of a linear transfer function relating underling neural, metabolic and vascular changes, which formed the basis of both the Rierra and Friston models. We hypothesized that given the neural information as an input one can predict the corresponding vascular and metabolic changes through a canonical transfer function that characterizes the system. In this work, we develop a model to estimate both these neuro-metabolic and neuro-vascular transfer functions by simultaneously considering concurrent electrophysiological and hemodynamic measurements. Our model, which is an extension of our multi-compartment Windkessel model as described by Huppert et al (2007), uses a bounded nonlinear parameter estimation routine to predict the values of the underlying system. By considering the electrophysiological measurements as inputs rather than the naive stimulus onset and stimulus condition information provided solely by the experimental design, we provide a neural basis for the estimated metabolic and vascular responses to the stimulus, while at the same time significantly reducing the number of model parameters when analyzing experimental data of parametric stimuli. Below we describe our model, analysis of experimental data from parametric rat whisker stimulation, and discuss the physiological significance of the estimated neuron-metabolic and neuron-vascular transfer functions.
2. Methods
2.1. Experimental procedures
The experimental data used in this study have been published in Huppert et al (2007). In brief, we preformed the following procedure.
2.1.1. Animal protocol
We used seven male Sprague–Dawley rats (250–350 g), which were anesthetized with 2% halothane and prepared as previously described by Dunn et al (2005). The skull over the somatosensory cortex was thinned until transparent. After surgery, the anesthetic was switched to 50 mg kg−1 bolus of α-choralose followed by continuous infusion at 40 mg kg−1 h−1. The MGH Subcommittee on the Research Animal Care approved all the experimental procedures.
The stimulation protocol consisted of a single whisker deflection with varying amplitude, 2 s of duration and at 8 Hz, similar to Devor et al (2003). The deflection varied from 240 μm to 1200 μm, divided into nine different conditions with equal amplitude increments. Stimuli were presented using a rapid, randomized event-related paradigm.
2.1.2. Electrophysiology
Single metal microelectrodes (FHC, Bowdoinham, ME, 5–17 MΩ) were used for electrophysiological recordings. The recorded potential was amplified and filtered into two different signals (Ulbert et al 2001): one referred to as the local field potential (LFP) (low-pass filtered, 0.1–500 Hz) and the other high-pass filtered (150–5000 Hz) to provide multiple unit activity (MUA). Then the MUA data were smoothed along the time axis using a Gaussian kernel of 1 ms full width at e−1 of peak amplitude. Both LFP and MUA responses were normalized to the peak amplitude of the ninth condition before group averaging.
We analyzed both the peak magnitude and the integrated amplitude of the LFP and MUA responses. The peak magnitudes were defined as the magnitude of the first evoked response in the stimulus train; the integrated electrical response was defined as the sum of the amplitudes for the entire two s train of responses.
2.1.3. Optical imaging
Multi-wavelength spectroscopic imaging of total hemoglobin concentration and oxygenation were performed. The cortex was illuminated by a filtered mercury xenon arc lamp (10 nm band-pass filters centered at six different wavelengths: 560, 570, 580, 590, 600 and 610 nm). Images were acquired onto a cooled 12 bit CCD camera at a frame rate of 18 Hz. Oxy- and deoxy-hemoglobin concentration changes were calculated from the modified Beer–Lambert law. Differential path-length factors were used to account for the individual optical path lengths at each wavelength (Kohl et al 2000).
Blood flow was also measured using laser speckle contrast (Dunn et al 2001). Images of relative cerebral blood flow (CBF) changes were determined by calculating the changes in the speckle contrast in a series of laser speckle images, and then were averaged across trials and the averaged set was converted to relative blood flow by converting each speckle contrast value to an intensity autocorrelation decay time (Briers 2001) and dividing by baseline (Dunn et al 2005). Both laser speckle and spectroscopic results were deconvolved using the stimulus presentation timing to determine the blood flow and hemoglobin responses, respectively. Regions of interest were defined by manually selecting a region enclosing the barrel cortex corresponding to the stimulated whisker. A group average of the seven animals was calculated after normalizing to the amplitude of the ninth condition (the largest whisker deflection amplitude).
2.2. Estimating the neuro-metabolic and neuro-vascular transfer functions
The relationship between the underlying level of neural activity and the corresponding hemodynamic responses is hypothesized to be represented by linear and time-invariant (LTI) transformations from electrophysiological activity to both the vascular and metabolic responses (Nangini et al 2006). This hypothesis is implied in both the Friston et al (2000) and Riera et al (2005) models and that neuronal activity can be used to predict both the vascular and/or metabolic responses. The convolution of the neuronal signal with the corresponding transfer function to give a model of blood flow and oxygen metabolism changes forms the inputs to the vascular and oxygen transport models, which predict changes in deoxy- and oxy-hemoglobin, blood volume and flow changes.
By measuring neuronal activity and the vascular response simultaneously, we were able to use neuronal information to guide temporal dynamic changes of the active dilation of the arteries (arterial dilation, DA) and the cerebral metabolic rate of oxygen (CMRO2) by a convolution of the electrophysiology recordings (N(t)) with the transfer functions f(t) to be estimated (see section 2.4):
| (1) |
| (2) |
The results of these convolutions form the input for the vascular model, specifically equations (8) and (14) by Huppert et al (2007). (The conversion of arterial dilation to arterial resistance is given by Poiseuille's law, equation (7) in the cited paper.) The changes in the dynamic states that describe the transfer functions were assumed to have a gamma-variant functional form,
| (3) |
where the function Θ(t) represents the Heaviside-step function, and τ0 and σ are the onset (delay) time and temporal width of the response, respectively. Δf represents the amplitude change and N is a normalizing factor. These transfer functions are determined by three free parameters (amplitude, onset time and width).
2.3. Description of the vascular model
Huppert et al (2007) described a multi-compartment Windkessel model using an inductive approach where both vascular and metabolic parameters are estimated by inverting a nonlinear state-space model which describes the dynamic responses of blood flow, blood volume and oxygenation. The forward model is divided into both vascular and oxygen transport equations which separate contributions from the arteries, capillaries and veins for the cerebral hemodynamic changes, as well as the oxygen content changes in the surrounding bulk extra-vascular tissue.
The vascular component of this model is derived from an analogy of electrical circuits to fluid mechanics based on a dilating arteriole, two compliant vascular Windkessel compartments (Cope 1965) and a constant volume compartment that models the pial veins. The model relies on the original description of the single compartment Balloon/Windkessel model described by Buxton et al (1998) and by Mandeville et al (1999). In summary, changes in arterial diameter are used as input driving states to the calculation of the blood flow between each compartment, which is derived from the gradient of the hydrostatic pressure between the compartments and the vascular resistance of the blood vessels. The latter is inversely related to the diameter of the blood vessels according to Poiseuille's law and thereby related to vascular volumes.
For the metabolic component, the oxygen transport forward model is based on the calculation of the oxygen content in the vascular segments and the bulk extra-vascular parenchyma tissue, using the oxygen transport model described by Herman et al (2006). The rate of transport across each vascular segment depends on the relative permeability of the segment, which can be described by first-order differential equations and determined from steady-state flow and baseline oxygen saturation.
2.4. Fitting procedures
The temporal characteristics of the full cerebral-vascular system are determined by a set of lumped model parameters that define the static and baseline properties of the vascular network such as the vascular compliance, vascular transit time and baseline oxygen saturations of each compartment. In general, these unknown parameters may vary between subjects and vascular regions and thus must be estimated as part of the model. A total of 14 independent states, described below, are fit to each dataset, and the transfer functions that determine the neurovascular and neuro-metabolic coupling are estimated within the physiological range given by the constraint bounds.
The state vector consists of both structural and functional properties of the system. The former relies on unknown physiological constants and proposed Windkessel parameters that are expected to remain constant for different stimulus conditions. The functional properties represent the transfer functions from the neuronal to metabolic and hemodynamic responses, which should also be the same between different stimulus conditions. This implies a reduction in the number of unknowns when fitting parametric data simultaneously, and is a unique feature of this proposed model. In this work, specifically, we fit all the nine hemodynamic responses due to different stimulus amplitudes using only 14 parameters, significantly less than the 59 used by Huppert et al (2007).
The steps of our proposed forward model are schematically illustrated in figure 1. A vector of unknowns (i.e. the state vector) describes the arterial dilation and oxygen consumption transfer functions which are convolved with the electrophysiological measurements to obtain the inputs into the multicompartment Windkessel model. The multicompartment Windkessel model then produces a prediction of the blood flow and hemoglobin responses to the neuronal activity. These predictions are compared with the observations using a weighted least-squares cost-function. We used a nonlinear Levenberg–Marquardt method implemented in Matlab (Mathworks, Inc. Natick MA, Version 7.4) for estimating the state vector that produces a prediction that optimally agrees with the observations. This fitting routine was iterated until a defined convergence criterion (10−6 times the variance of the measurement error) was met. The differential time step for the update of the vascular and oxygen transport models was fixed at 1 ms.
Figure 1.
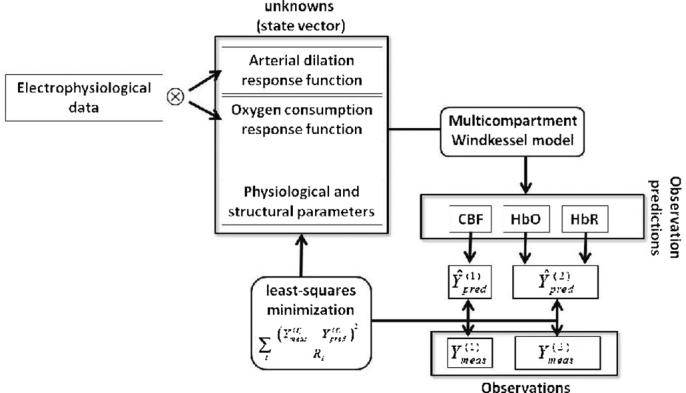
Schematic representation of the model framework proposed. Electrophysiological data are convolved with metabolic and vascular response functions to predict oxygen consumption and arterial dilation changes, respectively. These functions, together with structural and physiological parameters, are state parameters for the multicompartment Windkessel model, as presented by Huppert et al (2007), whose outputs predict the changes in CBF and oxygenation. The predictions are minimized to the experimental data using a pseudo-Bayesian approach, in the form of a weighted least-squares cost function, through a state vector of unknowns with 14 parameters.
In order to test the confidence bounds and to estimate the variance in fitting parameters, we also performed a Markov Chain Monte Carlo (MCMC) sampling of the parameter state space and estimated the 95% confidence intervals for each parameter (Carter and Kohn 1996). Model fits were repeated for 30 iterations of uniformly sampled initial positions of the state vector for the Levenberg–Marquardt algorithm.
3. Results and discussion
Recorded LFP and MUA for each of the nine stimulus amplitudes, obtained from the region-of-interest averaged response of the seven rats is shown in figure 2(a) for conditions 3, 6 and 9, as examples. For this work, we considered either the magnitude of each peak or the area under the peak for each electrophysiology measurement summed over the 16 pulses in the stimulus train, which provided four different possible combinations of input data as constraint to guide the parameter estimation (MUApeak, MUAarea, LFPpeak and LFParea).
Figure 2.
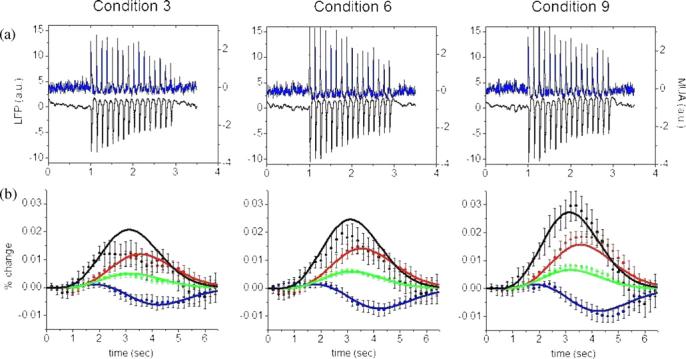
(a) Average LFP (black) and MUA (blue) responses (not normalized) for the entire 2 s stimulus train of whisker stimulation for three different stimulus amplitudes. (b) Evoked hemodynamic responses for these amplitudes; average CBF, HbO, HbR and HbT measurements are shown as black, red, blue and green dots. The error bars show standard error estimated from the seven rats used in the experiment. Solid curves represent the model fits to the data (MUAarea). Columns 1, 2 and 3 are responses to conditions 3, 6, and 9 respectively. In both cases, t = 0 corresponds to the beginning of stimulation.
The model was used to fit the experimental averaged response curves of cerebral blood flow and hemoglobin concentrations for all the nine conditions simultaneously. Figure 2(b) shows the model fits to the experimental data for conditions 3, 6 and 9, when the integrated MUA peaks (MUAarea) were taken as the neuronal input information to the convolution with the transfer function to be estimated. Similar matches between experimental and model prediction were found when using the other three combinations of input data.
The model parameters estimated for all four MUA and LFP cases analyzed were within the physiological ranges reported previously (Mandeville et al 1999, Boas et al 2003, Zheng et al 2005, Herman et al 2006), and close to those obtained by Huppert et al (2007). The structural parameters did not differ among the trials, independent of the input data we used, as expected. The Windkessel vascular reserve, for example, was estimated between 2.4 and 2.8, while the vascular transit time remained in a range of 0.72 and 0.74 s. Both parameters are in agreement with evoked responses found in previous studies (Mandeville et al 1999, Zheng et al 2005). In addition, we examined the 95% confidence intervals with Monte Carlo simulations, as described in section 2.3. We also analyzed the influence of the initial guess of the model parameters, and verified that the final estimates did not change significantly among trials and they always fell within the model uncertainty, independent of the starting position. Table 1 summarizes all these findings for MUAarea.
Table 1.
All 14 model parameters used to fit the experimental data: three for each of the transfer functions; four to describe the structural variables of the system; and four parameters to describe the baseline oxygenation. Physiological ranges were used to bound the estimates of each of the parameters. In the last two columns we present, respectively, the model estimates for the state vector, when using LFParea to guide CMRO2 and arterial dilation changes, and their confidence bounds, calculated from the MCMC simulations.
| Description | Symbol | Physiological constraint |
Estimate | Confidence interval |
|
|---|---|---|---|---|---|
| Arterial dilation transfer funcion | |||||
| Amplitude change | ΔfA | (0–10)% | 1.04% | [1.03–1.26] | |
| Delay time of the amplitude change | τ0,A | (0–5) s | 0.45 s | [0.43–0.55] | |
| Width of the amplitude change | σA | (0.7–3) s | 1.83 s | [1.82–1.86] | |
| Oxygen consumption transfer function | |||||
| Amplitude change | ΔfO2 | (0–10)% | 0.70% | [0.57–0.71] | |
| Delay time of the amplitude change | τ0,O2 | (0–2) s | 0.001 s | [0.00–0.15] | |
| Width of the amplitude change | σO2 | (0.7–3) s | 0.84 s | [0.79–0.86] | |
| Structural variables | |||||
| Initial arterial resistance | RA(0) | (0.2–0.9) au | 0.59 au | [0.58–0.60] | |
| Windkessel vascular reserve | β | (1–5) au | 2.43 au | [2.35–2.46] | |
| Vascular transit time | τ | (0.5–4) s | 0.73 s | [0.70–0.76] | |
| Pial venous transit time | τpial | (0–4) s | 0.33 s | [0.21–0.58] | |
| Hemodynamic variables | |||||
| Total baseline hemoglobin concentration | [HbT](0) | (40–140) μ moll−1 | 86.5 μ moll−1 | [84.3–86.8] | |
| Baseline arterial oxygen saturation | SaO2(0) | (90–100)% | 92.4% | [90.0–92.8] | |
| Baseline capillary oxygen saturation | ScO2 (0) | (60–90)% | 71.3% | [71.1–71.4] | |
| Baseline venous oxygen saturation | SvO2(0) | (55–89)% | 65.9% | [65.8–66.2] | |
The goodness-of-fit was examined by the correlation between the measured and predicted responses. The averaged R2 values from the nine conditions were calculated for our four sets of input data, and are provided in table 2, as well as their comparison to those obtained by Huppert et al (2007). Although slightly smaller when compared to those obtained in the previous cited paper, our optimization model yielded highly statistically significant fits for all combinations of input data. Furthermore, these new model fits were obtained using the electrophysiological measurements as constraints, significantly decreasing the degrees of freedom in the system, i.e. the total number of parameters to be estimated. This is clearly seen in the F-statistics for each of these models, which penalizes for the additional degrees-of-freedom of the Huppert et al model. According to the F-statistics, our neural transfer model is significantly better, being able to provide similar modeling of the data with 70% fewer degrees-of-freedom.
Table 2.
Goodness-of-fit for the model fits of the four combinations of electrophysiological parameters. Uncertainty of the values was calculated from standard deviation of the fits to the nine stimulus conditions. The total R2 values indicate the fraction of the total variance accounted for by all measurements. The F-values consider the degrees-of-freedom from each model, and were calculated from the R2 values. The last column shows R2 values obtained for the fits of the nine conditions with the multicompartment Windkessel model, without any neuronal information as a prior, described by Huppert et al (2007).
| Model fitting |
Model fit from Huppert et al (2007) |
|||||
|---|---|---|---|---|---|---|
| MUA area |
MUA peak |
LFP area |
LFP peak |
|||
| HbO | R2 value | 0.94 ± 0.03 | 0.94 ± 0.04 | 0.93 ± 0.04 | 0.93 ± 0.04 | 0.97 ± 0.03 |
| F value | 1063 ± 38 | 1063 ± 44 | 902 ± 38 | 902 ± 37 | 523 ± 16 | |
| HbR | R2 value | 0.93 ± 0.04 | 0.92 ± 0.04 | 0.92 ± 0.04 | 0.92 ± 0.05 | 0.96 ± 0.06 |
| F value | 902 ± 34 | 781 ± 34 | 781 ± 36 | 781 ± 38 | 389 ± 23 | |
| HbT | R2 value | 0.92 ± 0.05 | 0.92 ± 0.06 | 0.91 ± 0.06 | 0.91 ± 0.06 | 0.96 ± 0.04 |
| F value | 781 ± 44 | 7813 ± 51 | 687 ± 46 | 687 ± 45 | 389 ± 16 | |
| CBF | R2 value | 0.83 ± 0.10 | 0.82 ± 0.11 | 0.82 ± 0.11 | 0.82 ± 0.11 | 0.92 ± 0.08 |
| F value | 332 ± 41 | 310 ± 40 | 310 ± 42 | 310 ± 40 | 187 ± 17 | |
| Total | R2 value | 0.90 ± 0.05 | 0.90 ± 0.06 | 0.89 ± 0.06 | 0.90 ± 0.06 | 0.95 ± 0.05 |
| F value | 611 ± 38 | 611 ± 42 | 550 ± 39 | 611 ± 43 | 308 ± 17 | |
The transfer functions estimated from either MUA or LFP to the arterial dilation and CMRO2 changes are presented in figure 3(a). Irregardless of the type of the input data (integrated sum or peak magnitude), the transfer function obtained for each electrophysiology observation was similar, although the amplitude of the LFP transfer functions was smaller. The transfer function for the vascular response was more delayed in its onset and had a wider temporal response, while the transfer function for the metabolic response was more instantaneous and narrower in time. The temporal width of the transfer functions suggests that the vascular response (arterial dilation) is slower than the metabolic response, which is reasonable given the biomechanical nature of the vascular response.
Figure 3.
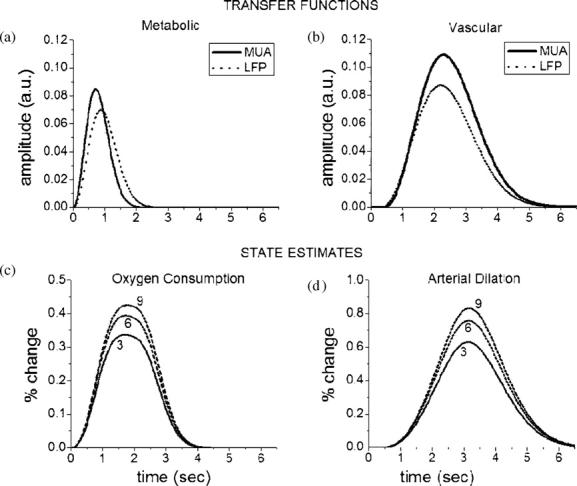
Estimated transfer function for the (a) neuro-metabolic and (b) neuro-vascular systems, which represents their respective response to a single stimulus pulse. Solid (dotted) lines correspond to estimation when using integrated area over MUA (LFP) recordings. In the bottom panel, we show the convolved response of the transfer function (LFParea) with a train of pulses from electrophysiological recordings, resulting parametric estimates in (c) CMRO2 and (d) arterial dilation changes for evoked responses to whisker barrel stimulation (only conditions 3, 6 and 9 are plotted for a better visualization).
The physiological response of each system, represented by the change in CMRO2 and arterial dilation, can be calculated from the direct convolution of the input data with the corresponding transfer function estimated. Figure 3(b) shows the changes in these states for conditions 3, 6 and 9 when using LFParea to guide the optimization process. The maximum flow—oxygen consumption ratio, a common rate calculated from functional responses, was found at 3.27, which is consistent with reported values (Kastrup et al 2002, Hoge et al 2005).
Electrophysiological recordings evidence different processes of the neuronal system. MUA is directly related to spiking activity, while LFP measures a weighted sum of transmembrane currents due to synaptic and dendritic activities (Devor et al 2003). Because these measurements clarify different neuronal-related mechanisms, one might analyze the influence of one or another when used as neuronal information for studying the neuro-metabolic-vascular coupling of the cerebral evoked response. Indeed MUA statistics are slightly higher than LFPs in our results, as shown in table 2, but this difference was not statistically significant (P < 0.05; T-test). Perhaps these differences would become more apparent with different stimulation paradigms that evoked characteristically different behavior in MUA and LFP. Of particular interest is the surround vaso-constriction behavior observed during fore-paw stimulation (Devor et al 2007) that appears to arise from relatively greater hyper-polarization and supports the intriguing hypothesis that depolarization drives dilation and hyperpolarization drives constriction. Our analysis framework enables a model test of this hypothesis by separating the MUA and LFP responses into depolarization and hyperpolarization components that individually drive dilation and/or constriction. We tested this idea with the present whisker barrel data and found no significant support for or against this hypothesis.
4. Summary
Evoked changes in blood oxygenation, volume and flow are nonlinearly related to changes in the vascular tone and oxygen metabolism in underlying cerebral tissue and can be approximated by models of the vascular dynamics. In this work, we have shown that measured neuronal activity can be used to predict such measured hemodynamic changes through a linear model of the neuro-vascular and neuro-metabolic coupling relationship to the underlying arterial dilation and oxygen consumption changes and the nonlinear response of the vasculature to these physiological inputs. We used the Windkessel vascular model to fit experimental parametric hemodynamic and electrophysiological data in order to characterize these coupling functions. The empirical neuro-vascular and neuro-metabolic relationships both appear to be linear, however, our results show clear differences between the magnitude and timing of these two transfer functions. This model offers considerable improvement over previous descriptions and shows that multiple levels of neural and vascular activity can be modeled using a single transfer function relationship. Thus, compared to our previous Windkessel model, this current description uses a considerably lower number of the model parameters while providing equal quality predictions of the multimodal data. Our estimates of arterial dilation and CMRO2 changes, as well as other structural properties of the neuro-metabolic-vascular system are in agreement with previous findings. Furthermore, our model offers an electrophysiological basis for previous available vascular and metabolic models, and tested its dependence on amplitude of the evoked response. This feature can open more opportunities to study the behavior of the metabolic and hemodynamic responses under different conditions, such as parametric studies on stimulus frequency and/or duration, where the temporal time course of the blood flow and oxygenation changes varies considerably.
Acknowledgments
The authors would like to thank Drs Anna Devor, Rob Haslinger, Anders Dale and Roberto Covolan for helpful discussion of this text. RCM acknowledges funding from CNPq and CAPES agencies through 140273/2005-0 and 2860/06-6, respectively. This work was supported by the National Institutes of Health through R01-EB002482, R01-EB000790, R01-NS051188 and P41-RR14075.
References
- Aubert A, Costalat R. A model of the coupling between brain electrical activity, metabolism and hemodynamics: application to the interpretation of functional neuroimaging. Neuroimage. 2002;17:1162–81. doi: 10.1006/nimg.2002.1224. [DOI] [PubMed] [Google Scholar]
- Aubert A, Costalat R, Valabregue R. Modeling of the coupling between brain electrical activity and metabolism. Acta Biotheoretica. 2001;49:301–26. doi: 10.1023/a:1014286728421. [DOI] [PubMed] [Google Scholar]
- Boas DA, Strangman G, Culver JP, Hoge RD, Jasdzewski G, Poldrack RA, Rosen BR, Mandeville JB. Can the cerebral metabolic rate of oxygen be estimated with near-infrared spectroscopy? Phys. Med. Biol. 2003;48:2405–18. doi: 10.1088/0031-9155/48/15/311. [DOI] [PubMed] [Google Scholar]
- Briers JD. Laser Doppler, speckle and related techniques for blood perfusion mapping and imaging. Physiol. Meas. 2001;22:35–66. doi: 10.1088/0967-3334/22/4/201. [DOI] [PubMed] [Google Scholar]
- Buxton RB, Uludag K, Dubowitz DJ, Liu TT. Modeling the hemodynamic response to brain activation. Neuroimage. 2004;23:S220–33. doi: 10.1016/j.neuroimage.2004.07.013. [DOI] [PubMed] [Google Scholar]
- Buxton RB, Wong EC, Frank LR. Dynamics of blood flow and oxygenation changes during brain activation: the balloon model. Magn. Reson. Med. 1998;39:855–64. doi: 10.1002/mrm.1910390602. [DOI] [PubMed] [Google Scholar]
- Carson RE, Herscovitch P, Daube-Witherspoon ME, editors. Quantitative Functional Brain Imaging with Positron Emission Tomography. Academic; San Diego, CA: 1998. [Google Scholar]
- Carter CK, Kohn R. Markov chain Monte Carlo in conditionally Gaussian state space models. Biometrika. 1996;83:589–601. [Google Scholar]
- Cope FW. Elastic reservoir theories of the human circulation with applications to clinical medicine and to computer analysis of the circulation. Adv. Biol. Med. Phys. 1965;10:277–356. doi: 10.1016/b978-0-12-005210-3.50009-3. [DOI] [PubMed] [Google Scholar]
- Devor A, Dunn AK, Andermann ML, Ulbert I, Boas DA, Dale AM. Coupling of total hemoglobin concentration, oxygenation, and neural activity in rat somatosensory cortex. Neuron. 2003;39:353–9. doi: 10.1016/s0896-6273(03)00403-3. [DOI] [PubMed] [Google Scholar]
- Devor A, Tian P, Nishimura N, Teng IC, Hillman EMC, Narayanan SN, Ulbert I, Boas DA, Kleinfeld D, Dale AM. Supressed neuronal activity and concurrent arteriolar vasoconstriction may explain negative blood oxygenation level-dependent signal. J. Neurosci. 2007;27:4452–59. doi: 10.1523/JNEUROSCI.0134-07.2007. [DOI] [PMC free article] [PubMed] [Google Scholar]
- Dunn AK, Bolay H, Moskowitz MA, Boas DA. Dynamic imaging of cerebral blood flow using laser speckle. J. Cereb. Blood Flow Metab. 2001;21:195–201. doi: 10.1097/00004647-200103000-00002. [DOI] [PubMed] [Google Scholar]
- Dunn AK, Devor A, Dale AM, Boas DA. Spatial extent of oxygen metabolism and hemodynamic changes during functional activation of the rat somatosensory cortex. Neuroimage. 2005;27:279–90. doi: 10.1016/j.neuroimage.2005.04.024. [DOI] [PubMed] [Google Scholar]
- Friston KJ, Mechelli A, Turner R, Price CJ. Nonlinear responses in fMRI: the balloon model, volterra kernels and other hemodynamics. Neuroimage. 2000;12:466–77. doi: 10.1006/nimg.2000.0630. [DOI] [PubMed] [Google Scholar]
- Herman P, Trubel HK, Hyder F. A multiparametric assessment of oxygen efflux from the brain. J. Cereb. Blood Flow Metab. 2006;26:79–91. doi: 10.1038/sj.jcbfm.9600165. [DOI] [PubMed] [Google Scholar]
- Hoge RD, Franceschini MA, Covolan RJ, Huppert T, Mandeville JB, Boas DA. Simultaneous recording of task-induced changes in blood oxygenation, volume, and flow using diffuse optical imaging and arterial spin-labeling MRI. Neuroimage. 2005;25:701–7. doi: 10.1016/j.neuroimage.2004.12.032. [DOI] [PubMed] [Google Scholar]
- Huppert TJ, Allen MS, Benav H, Jones PB, Boas DA. A multi-compartment vascular model for inferring baseline and functional changes in cerebral oxygen metabolism and arterial dilation. J. Cereb. Blood Flow Metab. 2007;27:1262–79. doi: 10.1038/sj.jcbfm.9600435. [DOI] [PMC free article] [PubMed] [Google Scholar]
- Kastrup A, Kruger G, Neumann-Haefelin T, Glover GH, Moseley ME. Changes of cerebral blood flow, oxygenation, and oxidative metabolism during graded motor activation. Neuroimage. 2002;15:74–82. doi: 10.1006/nimg.2001.0916. [DOI] [PubMed] [Google Scholar]
- Kohl M, Lindauer U, Royl G, Kuhl M, Gold L, Villringer A, Dirnagl U. Physical model for the spectroscopic analysis of cortical intrinsic optical signals. Phys. Med. Biol. 2000;45:3749–64. doi: 10.1088/0031-9155/45/12/317. [DOI] [PubMed] [Google Scholar]
- Mandeville JB, Marota JJ, Ayata C, Zaharchuk G, Moskowitz MA, Rosen BR, Weisskoff RM. Evidence of a cerebrovascular postarteriole windkessel with delayed compliance. J. Cereb. Blood Flow Metab. 1999;19:679–89. doi: 10.1097/00004647-199906000-00012. [DOI] [PubMed] [Google Scholar]
- Moonen CTW, Bandettini PA, Baert AL, Sartor K, Youker JE, editors. Functional MRI (Medical Radiology Diagnostic Imaging) Springer; Berlin, Germany: 1999. [Google Scholar]
- Nangini C, Ross B, Tam F, Graham SJ. Magnetoencephalographic study of vibrotactile evoked transient and steady-state responses in human somatosensory cortex. Neuroimage. 2006;33:252–62. doi: 10.1016/j.neuroimage.2006.05.045. [DOI] [PubMed] [Google Scholar]
- Ogawa S, Lee TM, Kay AR, Tank DW. Brain magnetic resonance imaging with contrast dependent on blood oxygenation. Proc. Natl. Acad. Sci. USA. 1990;87:9868–72. doi: 10.1073/pnas.87.24.9868. [DOI] [PMC free article] [PubMed] [Google Scholar]
- Riera J, Aubert E, Iwata K, Kawashima R, Wan X, Ozaki T. Fusing EEG and fMRI based on a bottom-up model: inferring activation and effective connectivity in neural masses. Phil. Trans. R. Soc. B. 2005;360:1025–41. doi: 10.1098/rstb.2005.1646. [DOI] [PMC free article] [PubMed] [Google Scholar]
- Riera JJ, Schousboe A, Waagepetersen SH, Howarth C, Hyder F. The micro-architeture of the cerebral cortex: functional neuroimaging models and metabolism. Neuroimage. 2008;40:1436–59. doi: 10.1016/j.neuroimage.2007.12.051. [DOI] [PMC free article] [PubMed] [Google Scholar]
- Strangman G, Boas DA, Sutton JP. Non-invasive neuroimaging using near-infrared light. Biol. Psychiatry. 2002;52:679–93. doi: 10.1016/s0006-3223(02)01550-0. [DOI] [PubMed] [Google Scholar]
- Ulbert I, Karmos G, Heit G, Halgren E. Early discrimination of coherent versus incoherent motion by multiunit and synaptic activity in human putative MT+ Hum. Brain Mapp. 2001;13:226–38. doi: 10.1002/hbm.1035. [DOI] [PMC free article] [PubMed] [Google Scholar]
- Vazquez AL, Cohen ER, Gulani V, Hernandez-Garcia L, Zheng Y, Lee GR, Kim SG, Grotberg JB, Noll DC. Vascular dynamics and BOLD fMRI: CBF level effects and analysis considerations. Neuroimage. 2006;32:1642–55. doi: 10.1016/j.neuroimage.2006.04.195. [DOI] [PubMed] [Google Scholar]
- Villringer A, Chance B. Non-invasive optical spectroscopy and imaging of human brain function. Trends Neurosci. 1997;20:435–42. doi: 10.1016/s0166-2236(97)01132-6. [DOI] [PubMed] [Google Scholar]
- Zheng Y, Johnston D, Berwick J, Chen D, Billings S, Mayhew J. A three-compartment model of the hemodynamic response and oxygen delivery to brain. Neuroimage. 2005;28:925–39. doi: 10.1016/j.neuroimage.2005.06.042. [DOI] [PubMed] [Google Scholar]
- Zheng Y, Martindale J, Johnston D, Myles J, Berwick J, Mayhew J. A model of the hemodynamic response and oxygen delivery to brain. Neuroimage. 2002;16:617–37. doi: 10.1006/nimg.2002.1078. [DOI] [PubMed] [Google Scholar]
- Zheng Y, Johnston D, Berwick J, Chen D, Billings S, Mayhew J. A three-compartment model of the hemodynamic response and oxygen delivery to brain. Neuroimage. 2005;28:925–39. doi: 10.1016/j.neuroimage.2005.06.042. [DOI] [PubMed] [Google Scholar]