

Abstract
This study investigates the hypothesis that CuZn-superoxide dismutase (SOD1) overexpression confers radioresistance to human glioma cells by regulating the late accumulation of reactive oxygen species (ROS) and G2/M checkpoint pathway. U118-9 human glioma cells (wild type, neo vector control, and stably overexpressing SOD1) were irradiated (0-10 Gy) and assayed for cell survival, cellular ROS levels, cell cycle phase distributions, and cyclin B1 expression. SOD1 overexpressing cells were radioresistant compared to wild type (wt) and neo vector control (neo) cells. Irradiated wt and neo cells showed a significant increase (~2-fold) in DHE-fluorescence beginning at 2 d post-irradiation, which remained elevated at 8 d post-irradiation. Interestingly, the late accumulation of ROS was suppressed in irradiated SOD1-overexpressing cells. The increase in ROS levels was followed by a decrease in cell growth and viability, and an increase in the percentage of cells with sub G1 DNA content. SOD1 overexpression enhanced radiation-induced G2-accumulation within 24 h post-irradiation, which was accompanied with a decrease in cyclin B1 mRNA and protein levels. These results support the hypothesis that long after the radiation exposure a “metabolic redox-response” regulates radiosensitivity of human glioma cells.
Keywords: CuZnSOD, ROS, Radiosensitivity, Human Gliomas, SOD1, Cell Cycle Checkpoint
Introduction
CuZn-superoxide dismutase (SOD1) is a 32-kDa homodimer antioxidant enzyme, which is widely distributed in the cytosol, nucleus, peroxisome, and intermembrane space of mitochondria in mammalian cells [1, 2]. SOD1 gene knockout mice were viable and showed no overt abnormalities during development and early adulthood [3]. However, SOD1 knockout mice did exhibit reduced lifespan, extensive oxidative damage, and increased incidence of neoplastic changes in the liver at later life [3]. SOD1 contributes to approximately 70–80% of cellular SOD activity. Mammalian cells have two additional SODs: MnSOD (SOD2) located in the mitochondrial matrix and EcSOD (SOD3) in the plasma membrane and extracellular space [4, 5]. SODs together with other antioxidant enzymes are known to regulate cellular oxidation and reduction (redox) environment.
Cellular redox environment is a delicate balance between the levels of reactive oxygen species (ROS) and the antioxidant system that scavenges them. ROS are generated during the four-electron reduction of molecular oxygen to water for energy generation. The partial reduction of molecular oxygen results in the production of superoxide and hydrogen peroxide [6]. Superoxide and hydrogen peroxide can react with transition metal ions (e.g. cuprous and ferrous ions) through Fenton and Haber-Weiss chemistry, to promote further radical generation including the highly reactive hydroxyl radical [7]. In addition to these spontaneous reactions, enzymatic reactions of SODs convert superoxide to hydrogen peroxide; catalase and glutathione peroxidases neutralize hydrogen peroxide and organic hydroperoxides.
ROS can be generated from exogenous sources (e.g. ionizing radiation, chemicals) as well as endogenous sources (mitochondrial electron transport chain and oxygen metabolizing enzymes). Ionizing radiation (IR) is known to induce ROS production due to radiolysis of water and direct ionization of target molecules, which could result in oxidative damage to critical cellular biomolecules (nucleic acids, protein, and lipids) resulting in cytotoxicity [7-9]. Pre-treatment with small molecular weight antioxidants and antioxidant enzymes are known to suppress IR-induced cytotoxicity [10-14]. Likewise, IR-induced changes in cellular antioxidant defense are also believed to regulate cytotoxicity [15-17]. Although these previous reports support the hypothesis that ROS generated within milliseconds of IR-exposure could regulate cytotoxicity, the amount of ROS generated from the primary ionization events is significantly lower than ROS generated from cellular metabolism [18]. Therefore, the initial production of ROS might not be entirely responsible for the long-term biological effects of IR-exposure. Consistent with this hypothesis manipulations with antioxidants long after the initial IR-exposure have been shown to suppress radiation-induced late effects [11, 13, 19]. This paradigm shift focuses on ROS-imbalance due to metabolic oxidative stress as an additional regulatory mechanism controlling the fate of the irradiated cell population [20].
Gliomas are the most frequent primary tumors in the central nervous system, and patients with malignant glioma have very poor prognosis [21]. A previous study reported by Yoshii et al. [22] correlated SOD1 protein levels to human glioma’s responses to radiotherapy. High grade glioma exhibiting low SOD1 protein levels responded better to radiotherapy compared to glioma with higher levels of SOD1 protein. A radioresistant variant of U251 human glioblastoma cell line also exhibited higher SOD1 expression [23].
In this study, we determined if SOD1 overexpression confers radioresistance to human glioma cells by regulating the radiation-induced ROS accumulation and G2-checkpoint pathway. Our results showed SOD1 overexpression inhibited late accumulation of ROS, which was associated with inhibition in IR-induced increase in the percentage of cells with sub-G1 DNA content, and protection from IR-induced loss in cell survival. Furthermore, SOD1 overexpression enhanced IR-induced G2-accumulation and decreased cyclin B1 mRNA and protein levels.
Materials and Methods
Cell culture and irradiation
The U118-9 human glioma wild type, neo vector control, and SOD1 overexpressing (C43 and C51) cells were kindly provided by Dr. Larry W. Oberley (University of Iowa). Details of these cell lines were previously reported by Zhang et al. [24]. Monolayer cultures were grown in high glucose DMEM supplemented with 10% fetal bovine serum (HyClone) and antibiotics at 37°C in a humidified atmosphere of 95% air and 5% CO2. The medium for the transfected cells contained 400 μg/ml G418 (Life Technologies). The University of Iowa Holden Comprehensive Cancer Center Radiation and Free Radical Core facility resources were used for all radiation-related experiments. Exponentially growing asynchronous cultures were irradiated using a cesium-137 gamma radiation source set at a dose rate of 0.83 Gy/min. Cell number was measured by Beckman Z1 particle counter (Beckman Coulter). Cell population doubling time (Td) was calculated from the exponential portion of the growth curve using the following equation: Td=0.693t/ln(Nt/N0) where t is time, and Nt and N0 represent cell numbers at time t and initial time, respectively.
SOD activity assays
SOD enzymatic activities were determined by native activity gel electrophoresis and biochemical assays [25, 26]. Exponentially growing asynchronous cultures were harvested by scraping and cell pellets stored at −20°C. The pellets were re-suspended in PBS and sonicated 4 × 15 second bursts using Vibra Cell sonicator (Sonics and Materials) with a cup horn at 45% full power duty. Total protein concentration was determined by Bio-Rad Bradford protein assay kit and lyophilized bovine plasma γ-globulin was used as standard. One hundred microgram of total cellular protein was separated on a 12% native polyacrylamide gel electrophoresis. After electrophoresis, the gel was soaked in a solution containing 2.43 mM nitroblue tetrazolium, 28 μM riboflavin, and 28 mM TEMED for 20 min in dark. The gel was rinsed with distilled water and illuminated under a fluorescent lamp for visualization of achromatic bands that represent SOD activity. The bands were quantified with a computerized digital imaging system interfaced with AlphaImager 2000 software (Alpha Innotech). NaCN (5 mM) was used to distinguish the activity of MnSOD from CuZnSOD. CuZnSOD activity was calculated as the difference between total SOD activity and MnSOD activity. The biochemical assay for measuring SOD activity was performed following the method of Spitz and Oberley (26).
Clonogenic assay
Monolayer cultures of exponential control and irradiated cells were trypsinized and appropriate dilutions of cell cultures were re-plated for colony formation assay. Cells were cultured for 15 d and stained with 0.8% coomassie blue G250 in 50% methanol and 20% acetic acid. Colonies greater than or equal to 50 cells were counted. Plating efficiencies (PE) were calculated using the following formula: PE = (number of colonies counted/number of cells seeded) × 100. Survival fractions (SF) were calculated using the following formula: SF = (number of colonies counted) / (number of cells seeded × PE). Normalized survival fraction (NSF) was calculated relative to un-irradiated cells for each cell line.
Flow cytometry assays
All flow cytometry assays were performed at the University of Iowa Flow Cytometry Core facility. Control and irradiated monolayer cultures were continued in culture and cell viability assayed by propidium iodide (PI) dye exclusion and flow cytometry assay. Cells re-suspended in cold phosphate buffered saline were incubated with PI (1 μg/mL) and fluorescence assayed by flow cytometry. Fluorescence from 10,000 cells was collected in list mode, and population of PI-positive (nonviable) and negative (viable) cells were calculated using WINMDI software (Scripps Research Institute).
Ethanol fixed cells were treated with RNase A (0.1 mg/ml) for 30 min followed by incubation with PI (35 μg/ml). DNA content of PI-stained cells was analyzed by FACScan (Becton Dickinson) and the percentage of cells with sub-G1, G1, S, and G2/M DNA content calculated using MODFIT software (Verity Software House).
Flow cytometry measurements of dihydroethidium (DHE)-fluorescence were used to measure cellular ROS levels. Monolayer cultures were rinsed with Hanks buffer salt solution (HBSS) and harvested by trypsinizing the monolayer cultures. Cells were incubated in HBSS buffer containing 10% FBS and 10 μM DHE for 45 min. DHE-fluorescence was analyzed by flow cytometry (excitation 488 nm, and emission 585 nm). Mean fluorescence intensity (MFI) was calculated after correction for autofluorescence and fold change calculated relative to un-irradiated control. Cells treated with antamycin A were used as positive control for the assay.
Western blot assay
Total protein was separated by denaturing 12% SDS-polyacrylamide gel electrophoresis, and electro-transferred by semi-dry blotting onto a nitrocellulose membrane. Membranes were incubated with antibodies to SODs and catalase (gift from Dr. Larry W. Oberley, University of Iowa), cyclin B1 (Santa Cruz Biotechnology), and actin (Chemicon). Immunoreactive bands were detected by an enhanced chemiluminescence kit (Amersham) and results were quantitated using AlphaImager 2000 software (Alpha Innotech). Actin protein levels were used for loading corrections. All western blotting experiments were repeated at least twice.
Reverse transcription and quantitative polymerase chain reaction (RT-Q-PCR)
Total cellular RNA was extracted using TRIzol reagent (Invitrogen) according to the protocol provided by the manufacturer. RNA was quantified with BioPhotometer (Eppendorf). One microgram of total RNA was reverse transcribed using High Capacity cDNA Archive Kit (Applied Biosystems, ABI) with random hexamer primers in 25 μl reaction volume (25°C for 10 min followed by 35°C for 2 h). The PCR reaction was carried out using 2 μL cDNA, 0.6 μM of cyclin B1 and 18S primers, and 12.5 μL of 2x Syber Green Master Mix (ABI) in a total volume of 25 μL. Primers for PCR amplifications were as follows: cyclin B1, forward: 5’GGAGAGGTTGATGTCG AGCAA3’, and reverse 5’GCAAAAAGCTCCTGCTGCAAT3’; 18S rRNA, forward: 5’CCTTGGATGTGGTAGCCGTTT3’ and reverse: 5’AACTTTCGATGGTAGTCGCCG3’. The ABI PRISM 7000 sequence detection system was used with the following cycle parameters: Cycle 1 (95°C for 10 min); Cycle 2 (95°C for 15 sec, 60°C for 1 min) × 40 cycles. The relative cyclin B1 mRNA levels was calculated as follows: ΔCT (sample) = CT (cyclin B1) - CT (18S); ΔΔCT = ΔCT (post-irradiation time point) - ΔCT (0h); Relative expression = 2-ΔΔCT.
Statistical analysis
Statistical analysis was performed using R Integrated Statistical Software (version 2.6.0, the R Foundation for Statistical Computing, Vienna, Austria). Student t-Test was used to determine statistical difference between means. Results with p values < 0.05 were considered significant.
Results
SOD1 overexpressing human glioma cells are radioresistant
Initially, we determined SOD1 protein levels and activity in the four cell lines. Exponentially growing asynchronous cultures were harvested and total proteins extracted. Equal amounts of total cellular proteins were separated by SDS-PAGE and immunoblotted for SOD1, catalase, and actin protein levels. Total protein extracts prepared from replicate dishes were analyzed for SOD1 and SOD 2 activities by native gel electrophoresis and biochemical assays. SOD1 protein level was highest in C43 cells (~2.5-fold) followed by C51 (~1.5-fold), neo (~0.7-fold) compared to wt cells (Figure 1A). SOD1 activity measured by native gel electrophoresis showed approximately 4.8-fold increase in C43, and 3.2-fold increase in C51 compared to wt cells (Figure 1A, middle panel), which is consistent with results obtained from the biochemical activity assay (data not shown). To determine if SOD1 overexpression affects other antioxidant enzymes, total protein extracts prepared from exponential cultures were assayed for SOD2 activities using the biochemical assay. SOD2 activities were found to be 42.3±6.8 U/mg in C43, 33.6±12.1 U/mg in C51, 28.9±11.3 U/mg in neo, and 27.9±9.6 U/mg in wt cells. Results from the western blot assay showed minimal decrease in catalase protein levels in C43 and C51 compared to neo and wt cells (Figure 1A bottom panels). These results were comparable with previously published results [24] indicating that C43 and C51 cells have higher SOD1 activity compared to wt and neo controls.
Figure 1. Radioresistance in SOD1 overexpressing human glioma cells.
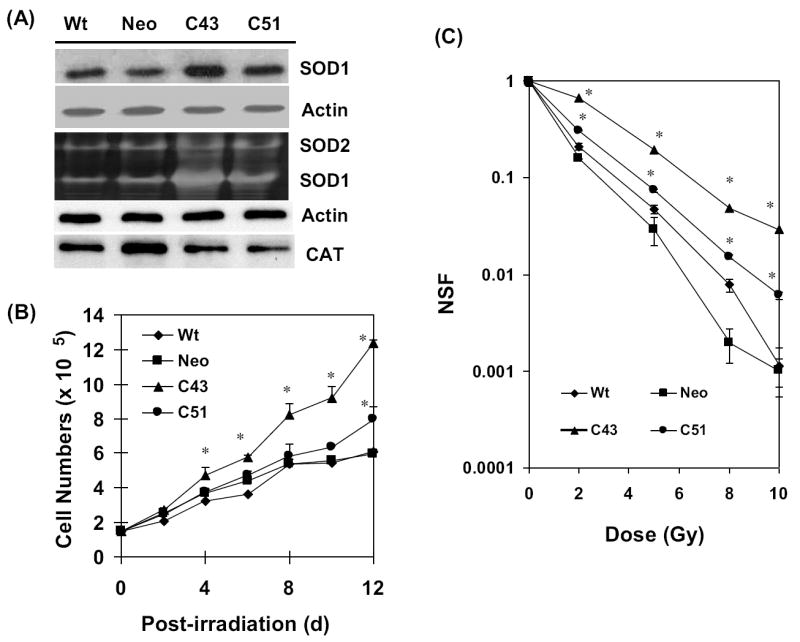
(A) Total cellular proteins were extracted from exponential cultures of wt, neo, and SOD1 overexpressing (C43 and C51) human glioma cells. Equal amounts of proteins were separated by SDS-PAGE and immunoblotted for SOD1, catalase, and actin protein levels; SOD1 and SOD2 activities were measured by native gel-electrophoresis. (B) Exponentially growing cultures were irradiated with 8 Gy (dose rate: 0.83 Gy/min) and analyzed for cell growth by counting cells in a Z1 Coulter Counter (Beckman Coulter). (C) Control (0 Gy) and irradiated (2-10 Gy) cells were assayed for cell survival using clonogenic assay. Monolayer cultures were trypsinized and re-plated at limited dilutions. Cells were cultured for 15 d and stained with 0.8% coomassie blue G250 dissolved in 50% methanol and 20% acetic acid. The surviving colonies of cells containing 50 or more cells were scored. NSF: normalized survival fraction. Asterisks represent statistical significance compared to wt and neo controls; error bars represent average and SD; n=3, p<0.05.
To determine if SOD1 activity perturbs cellular proliferation in control and 8 Gy (dose rate 0.83 Gy/min) irradiated cells, cell numbers were counted at different days post-irradiation (Supplemental Figure 1, and Figure 1B). In unirradiated cells, C43 and C51 cells grew slower (Td, 58-61 h) compared to wt, and neo cells (Td, ~56 h; Supplemental Figure 1). Following irradiation, all four cell lines showed initial growth delay followed by an increase in cell number (Figure 1B). Although cell growth was significantly suppressed in irradiated wt and neo cells, irradiated C43 cells continued to proliferate and C51 cells showed an intermediate response. The clonogenic properties of these cells were evaluated by irradiating cells with 0-10 Gy and performing the clonogenic cell survival assay. C43 cells showed significant radioresistance at all doses compared to wt and neo cells. C51 cells were less radioresistant compared to C43 cells (Figure 1C).
SOD1-induced radioresistance was further evident from results presented in figures 2&3. Exponential cultures of wt, neo, C43, and C51 cells were irradiated with 8 Gy and harvested at 10 d post-irradiation. Ethanol-fixed cells were analyzed for DNA content by flow cytometry and the percentage of cells with sub-G1 DNA content calculated (Figure 2B). Representative histograms of DNA content are shown in figure 2A. The percentage of cells with sub-G1 DNA content increased 35-50% in irradiated wt and neo cells. Interestingly, C43 and C51 SOD1 overexpressing irradiated cells showed significantly lower percentage of cells with sub-G1 DNA content (approximately 10-20%). The changes in the percentage of cells with sub-G1 DNA content correlated to SOD1 activity. In a separate series of experiments, cell viability was measured by propidium iodide (PI) exclusion assay. Exponential cultures were irradiated with 8 Gy and continued in culture. Cells were harvested at 6 d post-irradiation, stained with PI, and PI-fluorescence measured by flow cytometry. The percentage of PI-stained population (non-viable) was calculated. Results presented in figure 3A showed approximately 30% increase in PI-stained cell population in irradiated wt and neo cells while irradiated C43 and C51 cells showed approximately 10% PI-positive cells. Interestingly, an inverse correlation was observed between SOD1 activity and percent PI-positive cells (Figure 3B, R2=0.94, p=0.02).
Figure 2. SOD1 overexpression suppressed radiation-induced increase in the percentage of cells with sub G1-DNA content.
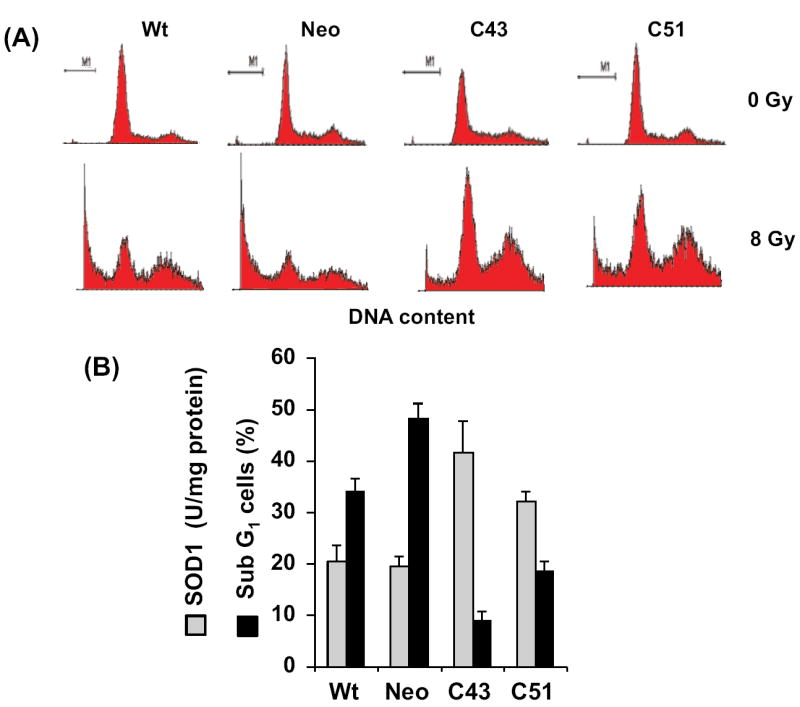
(A) Representative histograms of unirradiated and irradiated cells: asynchronous cultures were irradiated with 8 Gy and harvested 10 d post-irradiation. Ethanol-fixed cells were analyzed for DNA content by flow cytometry. (B) Basal levels of SOD1 activity and the percentage of cells with DNA content less than G1 (sub G1, indicative of cell death); SOD1 activity was measured by the biochemical activity assay.
Figure 3. Radiation induced increase in percent propidium-iodide positive cells inversely correlates with SOD1 activity.
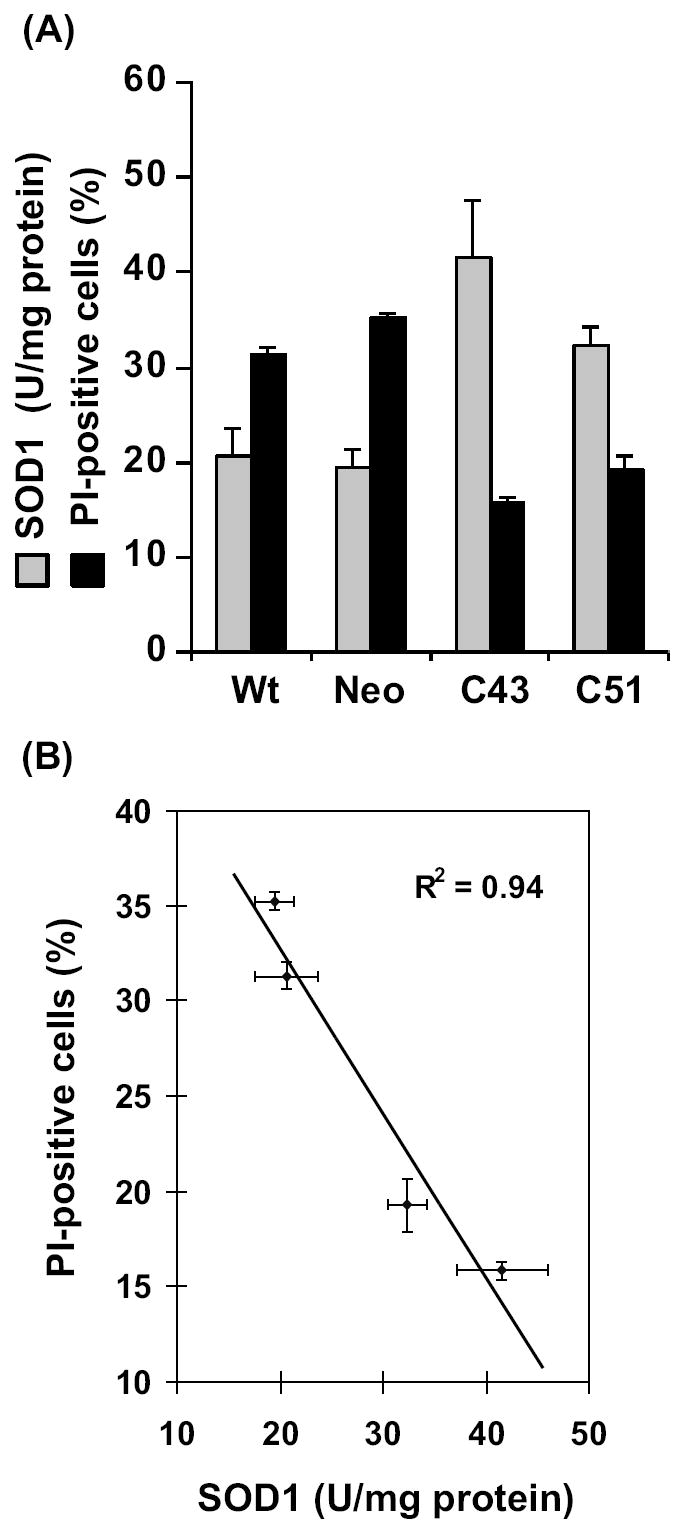
(A) Flow cytometry assay of cell viability: Exponential cultures were irradiated with 8 Gy and harvested by trypsinizing the monolayer cultures at 8 d post-irradiation. Cells were stained with PI and PI-stained cell population analyzed by flow cytometry. SOD1 activity was measured by the biochemical activity assay. (B) A correlation plot of SOD1 activity and percent PI-positive cells.
SOD1 overexpression suppressed late ROS accumulation in irradiated cells
To determine if intracellular ROS levels could differ in irradiated cells long after the initial irradiation and if such a change in ROS levels differs in SOD1 overexpressing cells, exponential cultures were irradiated with 8 Gy and continued in culture for the indicated times (Figure 4). Cells were harvested by trypsinizing the monolayer cultures and cell suspensions were stained with DHE. DHE-fluorescence was measured by flow cytometry and mean fluorescence intensity (MFI) calculated after correcting for autofluorescence. Data are presented relative to 0 h un-irradiated wt cells. There was no significant change in MFI within 5 h of radiation in all cell lines (Figure 4A, left panel). However, the MFI did show a statistically significant increase in irradiated wt and neo cells at 2 d post-irradiation, which remained elevated at 6 and 8 d post-irradiation (Figure 4A, right panel). Interestingly, there was no significant difference in MFI in irradiated C43 and C51 cells within the same time period. Exponential cultures of wt and neo cells irradiated with 10 Gy also showed approximately 2-fold increase in DHE-fluorescence at 2 and 6 d post-irradiation, while such an increase was absent in 10 Gy irradiated C41 and C51 cells (Supplemental Figure 2).
Figure 4. SOD1 overexpression-induced radioresistance correlates with inhibition in the late accumulation of reactive oxygen species (ROS).
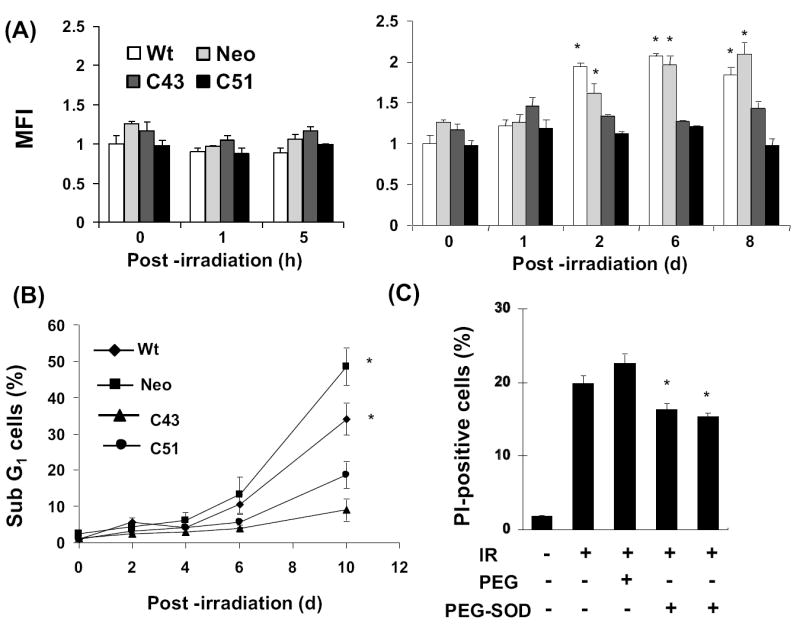
(A) Flow cytometry assay of cellular ROS levels: exponentially growing asynchronous cultures of wt, neo, and SOD1 overexpressing (C43 and C51) cells were irradiated with 8 Gy and continued in culture. Monolayers were stained with 10 μM dihydroethidium (DHE) and harvested by trypsinizing the monolayer cultures. DHE-fluorescence analyzed by flow cytometry. The fold-change in mean fluorescence intensity (MFI) was calculated relative to unirradiated wt cells. Asterisks represent statistical significance compared to 0 h; p<0.05. (B) Cells from replicate dishes were fixed in ethanol, and ethanol-fixed cells were analyzed for DNA content by flow cytometry. The percentage of cells with sub G1-DNA content calculated using CellQuest software. (C) Exponentially growing asynchronous neo cultures were pre- (10 h) or post (5 h)-treated with 400 U of PEG-SOD and irradiated with 4 Gy. Cells were stained with PI at 6 d post-irradiation and the percentage of PI-positive cells analyzed by flow cytometry. Cells treated with PEG alone were included to show specificity of SOD1 activity. Asterisks represent statistical significance compared to irradiated neo cells; error bars represent average and SD; n=3, p<0.05.
Exponential cultures in replicate dishes were irradiated with 8 Gy, and harvested at indicated times by trypsinizing the monolayer cultures. Ethanol-fixed cells were analyzed for DNA content by flow cytometry. The percentage of cells with sub G1-DNA content was approximately 10% at 6 d post-irradiation in wt and neo cells, which further increased to 30 and 50% at 10 d post-irradiation, respectively (Figure 4B). Consistent with the results presented in figures 1-3, radiation-induced toxicity in C43 and C51 cells were significantly lower compared to wt and neo cells. At 10 d post-irradiation, the percentage of cells with sub G1-DNA content increased approximately 5% in C43 cells and 15% in C51 cells (Figure 4B).
To further verify if SOD1 overexpression confers radioresistance in human glioma cells, exponential cultures of neo-control cells were pre-treated with polyethylene glycol-conjugated SOD1 (PEG-SOD) and irradiated with 4 Gy. Cells in replicate dishes were irradiated first and PEG-SOD was added at 5 h post-irradiation. Irradiated control and PEG-treated cells were included for comparison of results. Cells were harvested at 6 d post-irradiation and viability measured by PI-exclusion and flow cytometry assay. Irradiated control and PEG-treated cells showed approximately 20% PI-positive cells (Figure 4C). Irradiation-induced increase in the percentage of PI-positive cells was partially suppressed in cells treated with PEG-SOD. Interestingly, both pre- and post-treatment with PEG-SOD showed similar level of inhibition in radiation-induced increase in percent PI-positive cells. These results further support the hypothesis that SOD1 confers radioresistance to human glioma cells.
SOD1-induced radioresistance in human glioma cells is associated with enhanced G2-accumulation and decreased cyclin B1 mRNA and protein levels
To determine if SOD1-induced radioresistance is associated with altered cell cycle checkpoint activation, exponential cultures were irradiated with 8 Gy, and harvested at different times post-irradiation. Ethanol-fixed cells were treated with RNase A, and PI-stained cells were analyzed for DNA content by flow cytometry. The fold-change in G2/M relative to 0 h un-irradiated controls for each cell line is shown in figure 5A. Results showed that the fold-change in G2/M in irradiated C43 and C51 cells was higher at 18 and 24 h post-irradiation compared to wt and neo cells. Although the percentage of G2/M cells were higher in irradiated C43 and C51 cells compared to wt and neo cells at 1 d post-irradiation, all cell lines showed comparable distributions at 3 d post-irradiation (Figure 5B). To determine if cells accumulated in G2/M could be sensitive to a second dose of radiation, a split-dose experiment was performed. Wild type and C43 cells were irradiated with 4 Gy and after 18 h post-irradiation cells were irradiated with a second dose of 4 Gy. Cells in replicate dishes were irradiated with a single dose of 8 Gy. Irradiated cells were continued in culture for 6 d and cell viability measured. Representative histograms are shown in figure 5C left panel and the percentage of PI-positive cells is presented in figure 5C right panel. The percentage of PI-positive cells in 8 Gy irradiated wt cultures was approximately 25%, while C43 cells had approximately 15% PI-positive cells. Interestingly, results from the split-dose radiation showed a significant increase in the percentage of PI-positive cells in C43 cultures compared to the single 8 Gy dose (Figure 5C right panel). The difference in toxicity between the single and split doses could be due to the cell cycle rearrangement between the two radiation doses. There were more cells in the G2/M phases at the time of the second radiation dose, and considering G2/M phases are most radiosensitive the split-dose treatment resulted in more toxicity compared to the single dose.
Figure 5. SOD1 overexpression enhanced radiation-induced G2-accumulation.
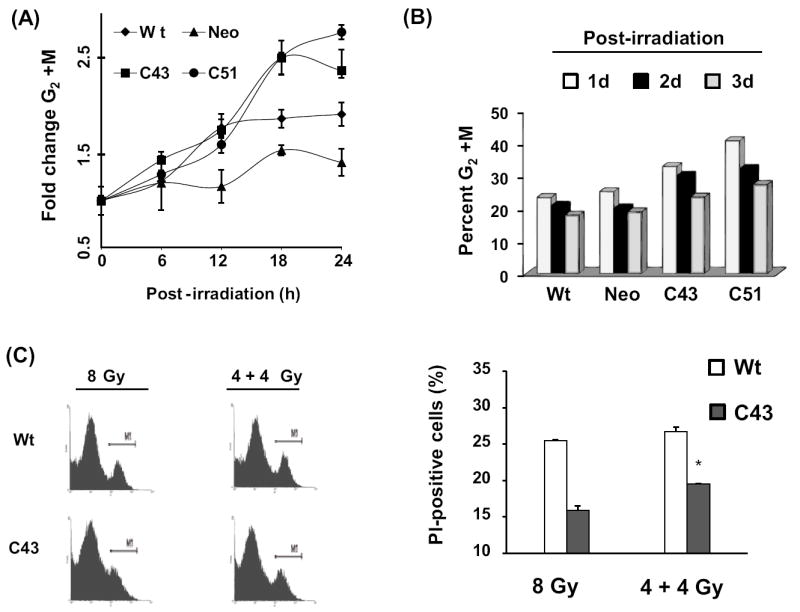
(A) Exponentially growing asynchronous cultures were irradiated with 8 Gy and harvested at indicated times for flow cytometry measurements of DNA content. Cell cycle phase distributions were calculated using MODFIT software; fold-change was calculated relative to 0 h un-irradiated cells. The percentage of G2/M in un-irradiated cells was as follows: wt, 12%; neo, 18%; C43, 14%; C51, 14%. (B) Irradiated cells were continued in culture and harvested at 1, 2, and 3 d post-irradiation for cell cycle phase analysis. The percent distributions in G2/M in wt, neo, C43, and C51 were calculated. (C) Asynchronously growing exponential cultures of wt and C43 cells were irradiated with a single dose of 8 Gy or split dose of 4+4 Gy. In the split dose experiment, the time difference between the two doses was 18 h. Cells were continued in culture and harvested at 6 d post-irradiation for flow cytometry measurements of cell viability. Error bars represent average and SD; n=3, p<0.05.
Total cellular proteins extracted from irradiated cells were separated by SDS-PAGE and immunoblotted for cyclin B1 and actin protein levels. There were minimal changes in cyclin B1 protein levels in irradiated neo and wt cells between 0 and 24 h post-irradiation (Figure 6A). Cyclin B1 protein levels in irradiated C43 cells decreased at 4 h post-irradiation and more than 80% decrease in cyclin B1 protein levels was observed between 6 and 8 h post-irradiation. In irradiated C51 cells, cyclin B1 protein levels decreased more than 50% between 6 and 10 h post-irradiation, and remained low at 24 h post-irradiation (Figure 6A). Cyclin B1 protein levels were similar at 1, 2, and 3 d post-irradiation in wt and neo cells (Figure 6B left panel). However, cyclin B1 protein levels in 8 Gy irradiated C43 and C51 cells were lower at 1 and 2 d post-irradiation. In irradiated C43 cells, cyclin B1 protein levels recovered to normal levels at 3 d post-irradiation, while cyclin B1 levels in C51 cells remained low at 3 d post-irradiation (Figure 6B right panel). Results from the quantitative RT-PCR assay showed cyclin B1 mRNA levels decreased 60-70% in irradiated C43 and C51 cells at 8 and 16 h post-irradiation (Figure 6C). Cyclin B1 mRNA levels in irradiated wt and neo cells showed only minimal changes (10-15% decrease).
Figure 6. SOD1 overexpression down-regulated cyclin B1 mRNA and protein levels.
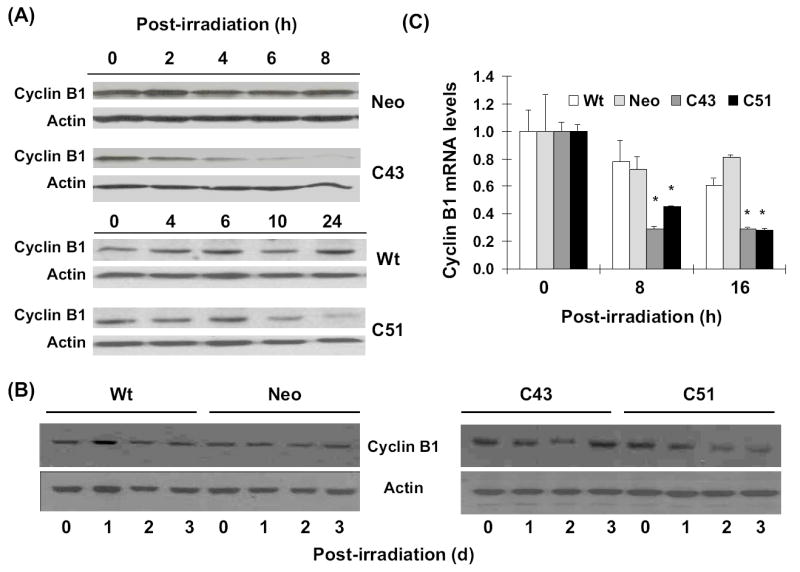
Total cellular proteins isolated at the indicated times were separated by SDS-PAGE and immunoblotted for cyclin B1 protein levels at 0-24 h (A), and 0-3 d (B) post-irradiation; actin protein levels were used for loading correction. (C) Quantitative RT-PCR assay for measurements of cyclin B1 mRNA levels: cellular RNA was extracted using TRIzol reagent (Invitrogen). Total mRNA was reverse transcribed (High Capacity cDNA Achieve Kit, ABI) and quantitative PCR performed using SYBR Green Quantitative PCR kit and ABI PRISM 7000 sequence detection system. Relative cyclin B1 mRNA level was calculated and fold-change plotted relative to 0 h un-irradiated cells.
Discussion
Irradiation is well known to generate ROS that persist for milliseconds and result in oxidative damage to cellular macromolecules. It has been hypothesized that ROS-mediated covalent modifications of cellular macromolecules could regulate some aspects of the cellular responses to IR-exposure. This hypothesis was based on the observations that ROS scavengers suppress many of the biological effects of irradiation. However, it is believed that the amount of ROS generated from the primary ionization events are significantly lower than ROS generated from cellular metabolism [18]. Therefore, the initial production of ROS might not be entirely responsible for all cellular effects of irradiation. This led to the hypothesis that ROS-imbalance due to metabolic oxidative stress could be an additional regulatory mechanism controlling the fate of the irradiated cell population.
The present study was designed to determine if SOD1 activity regulates radiosensitivity in human glioma cells. U118-9 human glioma wild type, neo, and SOD1 overexpressing (C43 and C51) cells were irradiated with 0-10 Gy of ionizing radiation and cell survival measured by clonogenic assay (Figure 1). SOD1 overexpressing cells were significantly radioresistant compared to wt and neo cells. The dose modifying factor at 10% survival was calculated to be 1.8 for C43 and 1.3 for C51 cells. Cell growth was also higher in irradiated C43 cells compared to wt and neo cells. The percentage of cells with sub G1-DNA content was significantly higher in irradiated wt and neo cells compared to SOD1 overexpressing irradiated C43 and C51 cells (Figure 2). Consistent with these results, the percentage of PI-positive cells was significantly lower in SOD1 overexpressing irradiated cells compared to wt and neo cells (Figure 3). In fact, an inverse correlation was observed between SOD1 activity and percent PI-positive cells (Figure 3B, R2=0.94, p=0.02). These results showed SOD1 activity regulates radiosensitivity in human glioma cells. Our results are consistent with the clinical observations correlating higher immunostaining of SOD1 in human brain tumors with poor therapy outcome while patients with lower SOD1 responded better to radiation therapy [22, 27, 28]. These previous reports and results from this study suggest that evaluations of SOD1 activity might be helpful in selecting oxidative cytotoxic treatment protocols for brain cancer therapy.
A key observation of our study was the late ROS accumulation in irradiated wt and neo cells that was suppressed in irradiated SOD1 overexpressing cells. Since superoxide radical is the substrate for SOD, we used dihydroethidium (DHE)-fluorescence and flow cytometry to measure superoxide steady state levels. DHE is a non-fluorescent chemical that upon entry into the cell undergoes oxidation to yield the fluorescent chemical, 2-hydroxyethidium (HE). HE intercalates with DNA and shows strong fluorescence in presence of superoxide radical [29]. Initially, there was no significant difference in DHE-fluorescence among all 4 cell types within 1-5 h post-irradiation. It was somewhat puzzling to notice that SOD1 overexpression did not affect DHE-fluorescence in un-irradiated C43 and C51 cells compared to control (Figure 4A left panel, 0 h). In general, one would expect superoxide steady state levels inversely proportional to SOD activity. It is possible that SOD1 overexpression could result in compensatory changes in other antioxidants and/or antioxidant enzymes. We observed minimal increase in SOD2 activities and decrease in catalase protein levels in C43 and C51 compared to wt cells. These results still do not address the question why SOD1 overexpression did not decrease superoxide steady state levels in C43 and C51 cells. An alternative explanation could be that the rate of superoxide production among the four cell lines might be different. If the rate of production of superoxide were to have increased in the SOD1 overexpressing cells and the rate of its removal were to increase similarly (due to the greater activity of SOD1), then there would be no change in the steady-state level of superoxide. We will be investigating possible sources of superoxide generation in future studies.
The absence of any significant changes during 1-5 h post-irradiation compared to 0 h for all cell lines is comparable to our previously published results [12]. In our previous report we used EPR spectroscopy to measure superoxide steady state levels in 6 Gy irradiated control and SOD2 overexpressing human oral squamous carcinoma cells. These results showed no significant change in ROS levels in irradiated control compared to SOD2 overexpressing cells within hours of the radiation treatment [12]. Thus, results from our earlier and present studies indicate that the radiation-induced generations of free radicals immediately after the treatment are essentially similar both in control and SOD overexpressing cells.
However, subsequent scavenging of these free radicals could differ depending upon the antioxidant capacity of the cell. This “metabolic redox-response” to radiation-exposure could determine the fate of the redox-sensitive cellular processes in irradiated cells. This hypothesis is supported by earlier reports demonstrating increases in pentose cycle activity in irradiated cells, which is believed to provide NADPH required for repair and biosynthetic processes [30]. An earlier report by Petkau et al. (10) showed administration of SOD1 2-4 h after the radiation-exposure protected Swiss mice from radiation-induced lethality. Likewise, antioxidant-manipulations long after the initial radiation-exposure have been shown to suppress radiation-induced late effects (reviewed in ref. [19]). In these previously published reports, the evidence for the late ROS is indirect and primarily based on the observations of elevated levels of oxidized products including 4-hydroxynonenal, 8-hydroxy-2’-deoxyguanosine, and malondialdehyde [19, 31, 32]. Our results showed DHE-fluorescence increased approximately 2-fold in irradiated wt and neo cells 2-8 d post-irradiation (Figure 4A) suggesting an increase in cellular ROS steady state levels. This increase in ROS levels precedes the increase in the percentage of cells with sub G1-DNA content (Figure 4B) indicating that the increase in ROS levels is not due to cell death, but indicative of the activation of ROS-sensitive cellular processes leading to cell death. Because SOD1 overexpression suppressed late accumulation of ROS and SOD1 activity is well known to scavenge superoxide, our results indicate that the major component of the radiation induced late accumulation of ROS could be superoxide. However, our results do not exclude the possible involvement of other ROS because DHE is known to undergo oxidation in presence of H2O2, ONOO-, HOCl, and singlet O2. Furthermore, DHE is also known to undergo auto-oxidation, and cytochrome c released into the cytosol from mitochondria could oxidize DHE [33-35]. Additional study is necessary to distinguish and unequivocally characterize the specific ROS regulating radiosensitivity in human glioma cells.
Our results also showed radiation-induced cytotoxicity was similar in cells pre- or post-treated with PEG-SOD (Figure 4C). These results and previous reports in the literature support the hypothesis that the “metabolic redox response” could be a critical regulator for cellular responses to oxidative stress causing agents.
Cellular antioxidant capacity could regulate IR-induced activation of cell cycle checkpoint pathways (Figure 5). IR-exposure is known to cause cell cycle arrest in G1, S, and/or G2 to prevent replication of damaged DNA or to prevent aberrant cell division. The regulatory mechanisms are known as checkpoints, and their primary function is to delay progression until the cell has adequately repaired the damage. Because U118-9 human glioma cells have multiple defects in the G1-checkpoint pathway (mutations in p53, p16, p14, PTEN, ref. [36]), these cells are expected to depend on the G2-checkpoint for survival. This property also makes them more susceptible to therapies targeted at abrogating the G2-checkpoint pathway. Our results show SOD1 overexpression-induced radioresistance in human glioma cells is associated with an increase in the percentage of G2/M cells compared to wt and neo cells (Figure 5A). Although the flow cytometry assay used in this study does not distinguish between G2 and M phases, we have previously used a bromodeoxyuridine pulse-chase assay to demonstrate that SOD2 overexpression delayed transit through G2 resulting in G2-accumulation in irradiated human oral squamous carcinoma cells [12].
Expression of cyclin B1, a major G2/M-checkpoint protein, significantly decreased in irradiated SOD1 overexpressing cells compared to wt and neo cells (Figure 6). These results are consistent with a recent report by Scaife demonstrating increased G2-accumulation and decreased cyclin B1 protein levels in cells treated with a superoxide-scavenging agent diphenyleneiodonium [37]. Our results support the hypothesis that ROS-signaling (presumably superoxide) could play a significant role regulating cell cycle progression possibly by modulating cell cycle checkpoint proteins [38, 39].
In summary, our results show SOD1 overexpression-induced radioresistance in human glioma cells was associated with suppression in late ROS accumulation, enhanced G2/M accumulation, and decrease in cyclin B1 mRNA and protein levels. These results support the hypothesis that long after the initial irradiation a “metabolic redox-response” regulates radiosensitivity of human glioma cells. Although speculative, it is possible that ROS generated from IR-induced shift in cellular metabolism could serve as second messengers leading to cell cycle checkpoint activation, which then regulates radiosensitivity. Therefore, a better understanding of the “metabolic redox response” to oxidative stress agents could provide a biochemical rationale for novel cancer therapy modalities targeted at antioxidant enzyme and cell cycle checkpoints pathways.
Supplementary Material
Acknowledgments
We thank Dr. Larry W. Oberley for the cell lines, Radiation and Free Radical Research Core Facility for assisting with the radiation experiments, Mr. Burl E. Hess and the flow cytometry core facility for assisting with flow cytometry, and Dr. Garry R. Buettner for free radical chemistry discussion. Funding from NIH CA 111365 and Radiation Oncology Department supported this work.
Abbreviations
- DHE
dihydroethidium
- PEG-SOD
polyethylene glycol conjugated superoxide dismutase
- PI
propidium iodide
- SOD1
copper, zinc superoxide dismutase
- SOD2
manganese superoxide dismuatse
- redox
reduction and oxidation reactions
- ROS
reactive oxygen species
Footnotes
Publisher's Disclaimer: This is a PDF file of an unedited manuscript that has been accepted for publication. As a service to our customers we are providing this early version of the manuscript. The manuscript will undergo copyediting, typesetting, and review of the resulting proof before it is published in its final citable form. Please note that during the production process errors may be discovered which could affect the content, and all legal disclaimers that apply to the journal pertain.
References
- 1.Valko M, Rhodes CJ, Moncol J, Izakovic M, Mazur M. Free radicals, metals and antioxidants in oxidative stress-induced cancer. Chem Biol Interact. 2006;160:1–40. doi: 10.1016/j.cbi.2005.12.009. [DOI] [PubMed] [Google Scholar]
- 2.Zelko IN, Mariani TJ, Folz RJ. Superoxide dismutase multigene family: a comparison of the CuZn-SOD (SOD1), Mn-SOD (SOD2), and EC-SOD (SOD3) gene structures, evolution, and expression. Free Radic Biol Med. 2002;33:337–349. doi: 10.1016/s0891-5849(02)00905-x. [DOI] [PubMed] [Google Scholar]
- 3.Elchuri S, Oberley TD, Qi W, Eisenstein RS, Jackson Roberts L, Van Remmen H, Epstein CJ, Huang TT. CuZnSOD deficiency leads to persistent and widespread oxidative damage and hepatocarcinogenesis later in life. Oncogene. 2005;24:367–380. doi: 10.1038/sj.onc.1208207. [DOI] [PubMed] [Google Scholar]
- 4.Folz RJ, Crapo JD. Extracellular superoxide dismutase (SOD3): tissue-specific expression, genomic characterization, and computer-assisted sequence analysis of the human EC SOD gene. Genomics. 1994;22:162–171. doi: 10.1006/geno.1994.1357. [DOI] [PubMed] [Google Scholar]
- 5.McCord JM, Fridovich I. Superoxide dismutase. An enzymic function for erythrocuprein (hemocuprein) J Biol Chem. 1969;244:6049–6055. [PubMed] [Google Scholar]
- 6.Riley PA. Free radicals in biology: oxidative stress and the effects of ionizing radiation. Int J Radiat Biol. 1994;65:27–33. doi: 10.1080/09553009414550041. [DOI] [PubMed] [Google Scholar]
- 7.Hall EJ. Radiobiology for the radiologist. Philadelphia: Lippincott Williams & Wilkins; 2000. [Google Scholar]
- 8.Biaglow JE, Mitchell JB, Held K. The importance of peroxide and superoxide in the X-ray response. Int J Radiat Oncol Biol Phys. 1992;22:665–669. doi: 10.1016/0360-3016(92)90499-8. [DOI] [PubMed] [Google Scholar]
- 9.Oberley LW, Lindgren LA, Baker SA, Stevens RH. Superoxide lon as the cause of the oxygen effect. Radiat Res. 1976;68:320–328. [PubMed] [Google Scholar]
- 10.Biaglow JE, Clark EP, Epp ER, Morse-Guadio M, Varnes ME, Mitchell JB. Nonprotein thiols and the radiation response of A549 human lung carcinoma cells. Int J Radiat Biol Relat Stud Phys Chem Med. 1983;44:489–495. doi: 10.1080/09553008314551491. [DOI] [PubMed] [Google Scholar]
- 11.Epperly MW, Epstein CJ, Travis EL, Greenberger JS. Decreased pulmonary radiation resistance of manganese superoxide dismutase (MnSOD)-deficient mice is corrected by human manganese superoxide dismutase-Plasmid/Liposome (SOD2-PL) intratracheal gene therapy. Radiat Res. 2000;154:365–374. doi: 10.1667/0033-7587(2000)154[0365:dprrom]2.0.co;2. [DOI] [PubMed] [Google Scholar]
- 12.Kalen AL, Sarsour EH, Venkataraman S, Goswami PC. Mn-superoxide dismutase overexpression enhances G2 accumulation and radioresistance in human oral squamous carcinoma cells. Antioxid Redox Signal. 2006;8:1273–1281. doi: 10.1089/ars.2006.8.1273. [DOI] [PubMed] [Google Scholar]
- 13.Petkau A, Chelack WS, Pleskach SD. Letter: Protection of post-irradiated mice by superoxide dismutase. Int J Radiat Biol Relat Stud Phys Chem Med. 1976;29:297–299. doi: 10.1080/09553007614550341. [DOI] [PubMed] [Google Scholar]
- 14.St Clair DK, Wan XS, Oberley TD, Muse KE, St Clair WH. Suppression of radiation-induced neoplastic transformation by overexpression of mitochondrial superoxide dismutase. Mol Carcinog. 1992;6:238–242. doi: 10.1002/mc.2940060404. [DOI] [PubMed] [Google Scholar]
- 15.Guo G, Yan-Sanders Y, Lyn-Cook BD, Wang T, Tamae D, Ogi J, Khaletskiy A, Li Z, Weydert C, Longmate JA, Huang TT, Spitz DR, Oberley LW, Li JJ. Manganese superoxide dismutase-mediated gene expression in radiation-induced adaptive responses. Mol Cell Biol. 2003;23:2362–2378. doi: 10.1128/MCB.23.7.2362-2378.2003. [DOI] [PMC free article] [PubMed] [Google Scholar]
- 16.Oberley LW, St Clair DK, Autor AP, Oberley TD. Increase in manganese superoxide dismutase activity in the mouse heart after X-irradiation. Arch Biochem Biophys. 1987;254:69–80. doi: 10.1016/0003-9861(87)90082-8. [DOI] [PubMed] [Google Scholar]
- 17.Summers RW, Maves BV, Reeves RD, Arjes LJ, Oberley LW. Irradiation increases superoxide dismutase in rat intestinal smooth muscle. Free Radic Biol Med. 1989;6:261–270. doi: 10.1016/0891-5849(89)90053-1. [DOI] [PubMed] [Google Scholar]
- 18.Ward JF. DNA damage as the cause of ionizing radiation-induced gene activation. Radiat Res. 1994;138:S85–88. [PubMed] [Google Scholar]
- 19.Robbins ME, Zhao W. Chronic oxidative stress and radiation-induced late normal tissue injury: a review. Int J Radiat Biol. 2004;80:251–259. doi: 10.1080/09553000410001692726. [DOI] [PubMed] [Google Scholar]
- 20.Spitz DR, Azzam EI, Li JJ, Gius D. Metabolic oxidation/reduction reactions and cellular responses to ionizing radiation: a unifying concept in stress response biology. Cancer Metastasis Rev. 2004;23:311–322. doi: 10.1023/B:CANC.0000031769.14728.bc. [DOI] [PubMed] [Google Scholar]
- 21.Castro MG, Cowen R, Williamson IK, David A, Jimenez-Dalmaroni MJ, Yuan X, Bigliari A, Williams JC, Hu J, Lowenstein PR. Current and future strategies for the treatment of malignant brain tumors. Pharmacol Ther. 2003;98:71–108. doi: 10.1016/s0163-7258(03)00014-7. [DOI] [PubMed] [Google Scholar]
- 22.Yoshii Y, Saito A, Zhao DW, Nose T. Copper/zinc superoxide dismutase, nuclear DNA content, and progression in human gliomas. J Neurooncol. 1999;42:103–108. doi: 10.1023/a:1006122923952. [DOI] [PubMed] [Google Scholar]
- 23.Lee HC, Kim DW, Jung KY, Park IC, Park MJ, Kim MS, Woo SH, Rhee CH, Yoo H, Lee SH, Hong SI. Increased expression of antioxidant enzymes in radioresistant variant from U251 human glioblastoma cell line. Int J Mol Med. 2004;13:883–887. [PubMed] [Google Scholar]
- 24.Zhang Y, Zhao W, Zhang HJ, Domann FE, Oberley LW. Overexpression of copper zinc superoxide dismutase suppresses human glioma cell growth. Cancer Res. 2002;62:1205–1212. [PubMed] [Google Scholar]
- 25.Darby Weydert CJ, Smith BB, Xu L, Kregel KC, Ritchie JM, Davis CS, Oberley LW. Inhibition of oral cancer cell growth by adenovirusMnSOD plus BCNU treatment. Free Radic Biol Med. 2003;34:316–329. doi: 10.1016/s0891-5849(02)01245-5. [DOI] [PubMed] [Google Scholar]
- 26.Spitz DR, Oberley LW. An assay for superoxide dismutase activity in mammalian tissue homogenates. Anal Biochem. 1989;179:8–18. doi: 10.1016/0003-2697(89)90192-9. [DOI] [PubMed] [Google Scholar]
- 27.Kurisaka M, Mori K. Immunohistochemical study of copper and zinc-superoxide dismutase (Cu, Zn-SOD) in meningiomas. Noshuyo Byori. 1993;10:107–111. [PubMed] [Google Scholar]
- 28.Kurisaka M, Mori K. Immunohistochemical study of medulloblastoma with a monoclonal antibody against human copper and zinc-superoxide dismutase. Neurol Med Chir (Tokyo) 1996;36:220–223. doi: 10.2176/nmc.36.220. [DOI] [PubMed] [Google Scholar]
- 29.Zhao H, Kalivendi S, Zhang H, Joseph J, Nithipatikom K, Vasquez-Vivar J, Kalyanaraman B. Superoxide reacts with hydroethidine but forms a fluorescent product that is distinctly different from ethidium: potential implications in intracellular fluorescence detection of superoxide. Free Radic Biol Med. 2003;34:1359–1368. doi: 10.1016/s0891-5849(03)00142-4. [DOI] [PubMed] [Google Scholar]
- 30.Tuttle SW, Varnes ME, Mitchell JB, Biaglow JE. Sensitivity to chemical oxidants and radiation in CHO cell lines deficient in oxidative pentose cycle activity. Int J Radiat Oncol Biol Phys. 1992;22:671–675. doi: 10.1016/0360-3016(92)90500-h. [DOI] [PubMed] [Google Scholar]
- 31.Kang SK, Rabbani ZN, Folz RJ, Golson ML, Huang H, Yu D, Samulski TS, Dewhirst MW, Anscher MS, Vujaskovic Z. Overexpression of extracellular superoxide dismutase protects mice from radiation-induced lung injury. Int J Radiat Oncol Biol Phys. 2003;57:1056–1066. doi: 10.1016/s0360-3016(03)01369-5. [DOI] [PubMed] [Google Scholar]
- 32.Lonergan PE, Martin DS, Horrobin DF, Lynch MA. Neuroprotective effect of eicosapentaenoic acid in hippocampus of rats exposed to gamma-irradiation. J Biol Chem. 2002;277:20804–20811. doi: 10.1074/jbc.M202387200. [DOI] [PubMed] [Google Scholar]
- 33.Green DR, Reed JC. Mitochondria and apoptosis. Science. 1998;281:1309–1312. doi: 10.1126/science.281.5381.1309. [DOI] [PubMed] [Google Scholar]
- 34.Halliwell B, Gutteridge JMC. Free radicals in biology and medicine. Oxford; New York: Oxford University Press; 2007. [Google Scholar]
- 35.Tarpey MM, Fridovich I. Methods of detection of vascular reactive species: nitric oxide, superoxide, hydrogen peroxide, and peroxynitrite. Circ Res. 2001;89:224–236. doi: 10.1161/hh1501.094365. [DOI] [PubMed] [Google Scholar]
- 36.Ishii N, Maier D, Merlo A, Tada M, Sawamura Y, Diserens AC, Van Meir EG. Frequent co-alterations of TP53, p16/CDKN2A, p14ARF, PTEN tumor suppressor genes in human glioma cell lines. Brain Pathol. 1999;9:469–479. doi: 10.1111/j.1750-3639.1999.tb00536.x. [DOI] [PMC free article] [PubMed] [Google Scholar]
- 37.Scaife RM. G2 cell cycle arrest, down-regulation of cyclin B, and induction of mitotic catastrophe by the flavoprotein inhibitor diphenyleneiodonium. Mol Cancer Ther. 2004;3:1229–1237. [PubMed] [Google Scholar]
- 38.Menon SG, Goswami PC. A redox cycle within the cell cycle: ring in the old with the new. Oncogene. 2007;26:1101–1109. doi: 10.1038/sj.onc.1209895. [DOI] [PubMed] [Google Scholar]
- 39.Sarsour EH, Venkataraman S, Kalen AL, Oberley LW, Goswami PC. Manganese superoxide dismutase activity regulates transitions between quiescent and proliferative growth. Aging Cell. 2008;7:405–417. doi: 10.1111/j.1474-9726.2008.00384.x. [DOI] [PMC free article] [PubMed] [Google Scholar]
Associated Data
This section collects any data citations, data availability statements, or supplementary materials included in this article.