Abstract
We reported previously the formation of microtears in an in vivo loaded Flexor Digitorum Profundus (FDP) rabbit tendon with a repetition rate of 60 repetitions per minute and a peak force of 15% of maximum peak tetanic force for 80 cumulative hours. Tear area as a percent of tendon area, tear density (tears/mm2), and mean tear size (μm2) were higher in tendons from the loaded limb compared to the unloaded control limb. The purpose of the present study was to compare those results to results obtained with a repetition rate of 10 while maintaining the same peak force and force-time integral (n = 8). Due to a strain gradient between the inner and outer sides of the FDP tendon, microtears were quantified in four regions, two regions each along the inner and outer sides of the tendon. The tear area as a percent of total tendon area and the mean tear size were significantly greater in the loaded limb compared to the unloaded limb (p <0.03). However, the effects were less than those observed at 60 repetitions/min. The higher repetition loading pattern resulted in an increase in tear measures in all four regions, while the lower rate produced changes only in the outer regions of the tendon. This finding may establish where the initial sites of damage occur in tendons that insert into bone in a similar arrangement as the FDP. The results suggest that repetition rate or number of loading cycles is associated with increased tendon microtears or fragility in a dose-response pattern.
Keywords: tendonitis, tendonitis, epicondylitis, overuse, repetitive loading
INTRODUCTION
Tendon injuries due to overuse are common in athletes and workers. Overuse injuries account for 30 to 50% of sports-related injuries.1,2 Although overuse injuries are related to forceful and repetitive hand activities, little is known about the early mechanisms of injury that ultimately lead to tendinopathy. Elucidating the early structural, cellular, and molecular changes in tendons exposed to cyclical loading may ultimately improve prevention and treatment options.
Previously we reported the formation of micro-tears in the tendons of rabbits that were cyclically loaded in vivo at 60 repetitions per minute for 80 h of cumulative loading.3 The mean tear densities ranged from 650 to 1,788 tears/mm2 in the tendon of the loaded limb compared to 358 to 1,491 in the unloaded limb. The tears in the loaded limb ranged in size from 13 to 26 μm2 compared to 9 to 21 μm2 in the unloaded tendon. Larger tears (on the order of cm2) have been observed in tendons of humans with tendinosis using high-resolution ultrasound,4,5 MR imaging,6–8 and 3D volume-rendered images from multidetector computer tomography (MDCT).9 The larger tears may occur after prolonged exposure to repetitive load due to accumulation of injuries from microtears.
Several epidemiologic workplace studies suggest that rate of repetition may be an important risk factor for tendon injuries.10–12 Latko et al.13 categorized repetition as high/medium/low in their investigation of the relationship between repetitive work and the prevalence of tendinitis of the distal upper extremity. People exposed to high repetition jobs had two to three times higher risk of developing pain or tendinitis. A linear relationship between the three levels of repetition and the risk of tendinitis was found.
The purpose of this study was to investigate microstructural changes, specifically the formation of microtears in the Flexor Digitorum Profundus (FDP) tendon at the medial epicondyle following cyclical digit loading using a rabbit model with a repetition rate of 10 repetitions/min, and to compare these results to those obtained from our previous study.3 The duty cycle (20%) and peak force [0.42 N, 15% Po (peak tetanic force)] were the same between loading groups.
METHODS
Animal Model
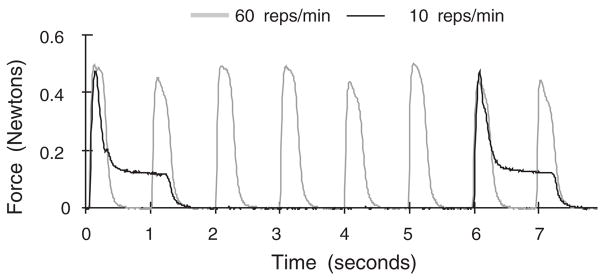
The loading model was described previously.3 Eight female, young adult (5 month old), New Zealand White rabbits weighing 3.58 kg (±0.84) were used. Under general anesthesia, the FDP muscle of one forelimb was electrically stimulated to contract repetitively for 2 h per day, 3 days per week, for 80 h of cumulative loading. The contralateral limb, supported in the same posture, did not receive a stimulus and therefore served as the control. The stimulation train was adjusted to maintain a mean peak digit flexion force of 0.42 N (15% of Po). Previously, a repetition rate of 60 reps/min was used with a train duration of 200 ms,3 while this set of animals was exposed to 10 reps/min with a train duration of 1,200 ms (Fig. 1). These rates covered the high and low hand grasp rates observed among assembly line workers.10,14 The study was approved by UC Berkeley’s Committee on Animal Research. Weekly examinations of the paw, forearm, and elbow revealed no tenderness, limping, nodules, swelling, limitation in range of motion, reduction in gross claw flexion strength, or skin breaks.
Figure 1.
Typical tendon loading profiles for 60 and 10 reps/min groups. Peak force is equivalent in the two groups. The force-time integral and duty cycle are also equivalent.
Tissue and Histological Preparation
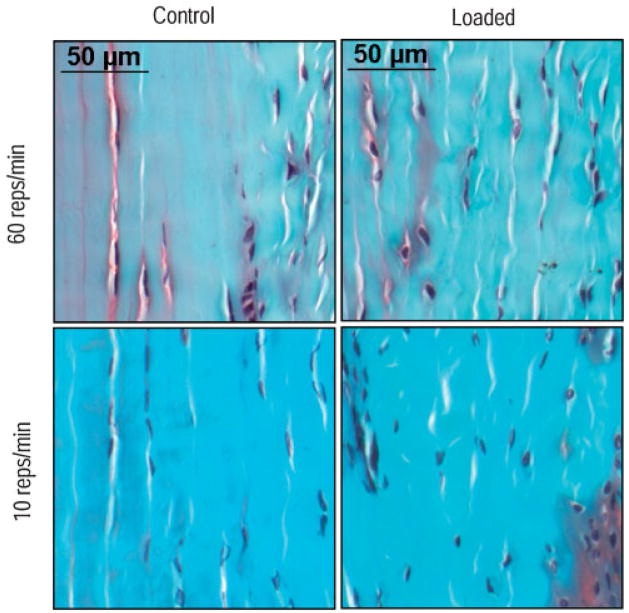
After 80 h of cumulative loading, animals were weighed (4.00 ±0.55 kg), euthanized, and the medial epicondyle block (tendon and bone) was harvested. Tissue and histological preparation along with image acquisition were identical to the previous study (Fig 2).3 Briefly, four regions of interest (ROIs) (200 ×400 μm2) of the FDP tendon were captured and analyzed for tears (tear area as a percent of tendon area, tear density, and mean tear size) with a custom image analysis software program.
Figure 2.
Microtears can be seen in loaded and unloaded tendons for both repetition rates stained with Iron Hemotoxlin, Safranin O, and Fast Green.
Statistical Analysis
A mixed model repeated measures ANOVA was used to analyze differences in tear measures by region (inner enthesis, outer enthesis, inner distal, or outer distal) and by loading status (loaded or unloaded) in the 10 reps/min group. Follow-up analysis was performed using the Tukey method for multiple comparisons. The distributions of tears by tear size were transformed into normal distributions using a log transformation preceded by the addition of the smallest value to each data point to avoid taking the logarithm of a zero. Then the transformed tear density was compared between loaded and unloaded limbs with the paired t-test using an α <0.01 to adjust for multiple comparisons. A two-factor ANOVA was used to examine differences between the repetition groups (60 vs. 10 reps/min) and among regions (four regions). This analysis was based on first evaluating the differences in tear measures between loaded and unloaded limbs of the same animal. Follow-up tests were performed using the Tukey method for multiple comparisons.
RESULTS
Tear Area as a Percent of Tendon Area (10 reps/min)
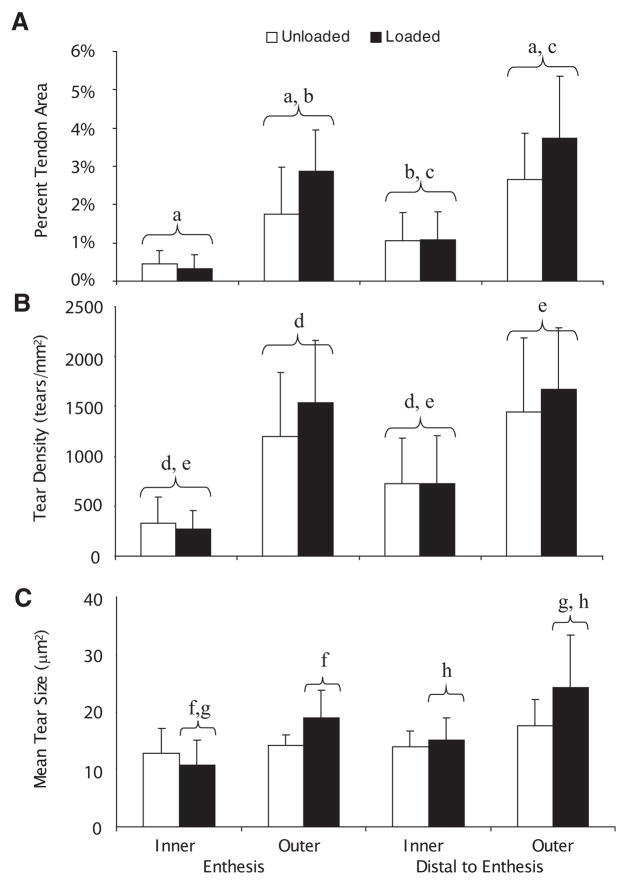
Across the four ROIs, the average tear area as a percent of tendon area ranged from 0.33 to 3.74% in the loaded tendon compared to 0.44 to 2.66% in the unloaded tendon (Fig. 3A). The outer enthesis (110% increase) and outer distal (86.3% increase) regions had the greatest percent increase when comparing the loaded to unloaded tendon. The inner enthesis (12.3% decrease) and the inner distal (10.7% increase) ROIs exhibited much smaller changes. The limb by region interaction term was not significant (p =0.054), while the limb (p =0.01) and region (p <0.001) effects were significant. Using the Tukey follow-up test, significant differences among regions were found. The tear area as a percent of tendon area at the inner enthesis was significantly lower than the outer enthesis (p <0.001) and outer distal (p <0.001) regions. Similarly, it was significantly lower in the inner distal ROI than the outer enthesis (p <0.02) and outer distal (p <0.001) regions. No significant differences were found between the two inner ROIs; however, the outer distal ROI had a significant increase in tear area percent when compared to the outer enthesis (p =0.016) ROI.
Figure 3.
Tear area as a percent of tendon area (A), tear density (B), and mean tear size (C) for the 10 reps/min group. The interaction terms (loading group ×region) for (A) and (B) were not significant (p >0.05), but were in (C) (p =0.03). A significant (p =0.01) effect of limb was found in (A), but not for (B) (p =0.25). Regions marked with the same lower case letter are significantly different based on the Tukey follow-up test. Columns are marked ±SD, n =8.
Tear Density
The tear density (tears/mm2), on average, ranged from 270.4 to 1,672.7 tears/mm2 in the loaded limb compared to 315.6 to 1,442.8 tears/mm2 in the unloaded limb across the four ROIs (Fig. 3B). Similar to the tear area, greater changes were observed in the outer regions. The outer enthesis (61.3% increase) and outer distal (45.4% increase) regions had a higher percent increase than the inner enthesis (10.7%) and the inner distal (7.2%) regions when comparing loaded to unloaded tendons. The limb by region interaction term was not significant (p =0.57). There was no significant difference between limbs (p =0.25), but there was a regional effect (p <0.0001). The differences were primarily between the inner and outer regions. The inner enthesis region had a significantly lower tear density than the other three ROIs: outer enthesis (p <0.001), inner distal (p =0.04), and outer distal (p <0.001). Similarly, the inner distal region had a significantly lower tear density than the outer enthesis (p =0.001) and outer distal (p <0.001) ROIs.
Mean Tear Size
The mean tear size (μm2) ranged from 11.0 to 24.2 μm2 in the loaded tendon compared to 13.4 to 17.6 μm2 in the unloaded tendon (Fig. 3C) in the four ROIs. Similar to the other two tear measures, the greatest changes occurred along the outer regions of the tendon. The outer enthesis (37.2% increase) and outer distal (38.9% increase) regions had larger changes in mean tear size compared to the inner enthesis (17.1% decrease) and inner distal (7.29% increase). The limb (p =0.03), region (p <0.001), and interaction (p =0.03) terms were all significant (Fig. 3C). The ROIs in the loaded tendon were significantly different from one another. The loaded inner enthesis ROI had a smaller mean tear size than the loaded outer enthesis (p = 0.0167) and loaded outer distal (p <0.0001) ROIs. The loaded inner region distal to the enthesis had a significantly smaller mean tear size than the outer region distal to the enthesis (p = 0.001).
Comparing 60 versus 10 reps/min
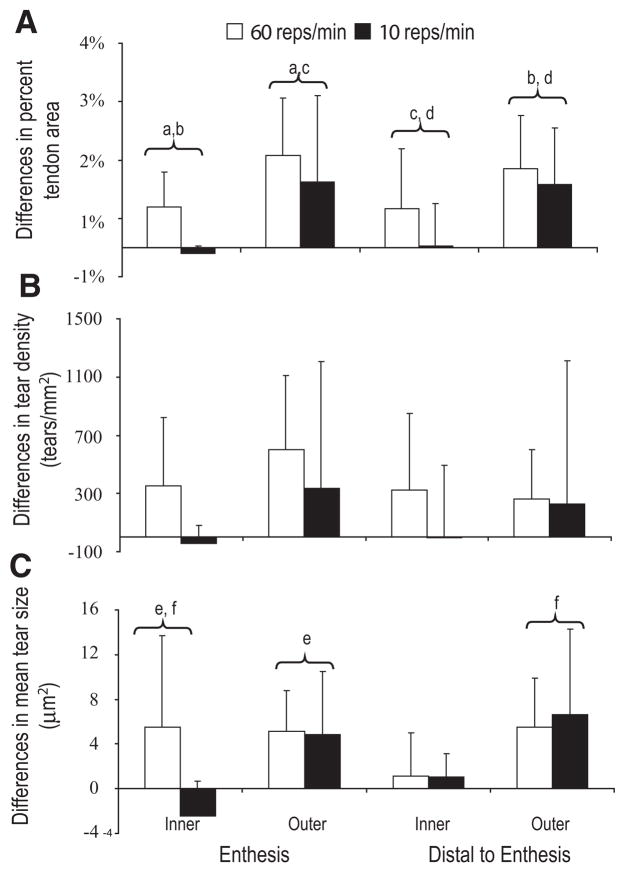
Differences in tear parameters between limbs were compared to the data from the 60 reps/min group.3 The interaction term in the ANOVA (repetition rate ×region) for the differences in tear area as a percent of tendon area was not significant (p =0.91). The 60 reps/min group had greater differences between limbs in tear area as a percent of tendon area (p =0.01) compared to the 10 reps/min group (Fig. 4A). Regional differences were also present (p <0.0001); there were larger tear differences between unloaded and loaded tendons along the outer regions of the tendon than along the inner regions of the tendon (p <0.05).
Figure 4.
Comparison of tear measures for 60 (n =9) and 10 (n =8) reps/min. Values represent mean (±SD) differences between loaded and unloaded tendons of the same animal. Changes in tear area as a percent of tendon area (A), in tear density (B), and in mean tear size (C). Significant differences between limbs by repetition rate occurred only for (A). Regions marked with the same lower case letter are significantly different based on the Tukey follow-up test.
The interaction term for the tear density was not significant (p =0.82) in the ANOVA. Differences in tear densities were not significantly different between the two loading groups (p =0.07), nor were there regional effects (p =0.18) (Fig. 4B).
The interaction term for the mean tear size was not significant (p =0.23). The difference in the mean tear size between the two loading groups was not significantly different (p =0.18). Regionally (p =0.005), there were differences, most notably the outer ROIs had greater changes between loaded and unloaded tendons than the inner enthesis (Fig. 4C).
Distribution of Tears by Size
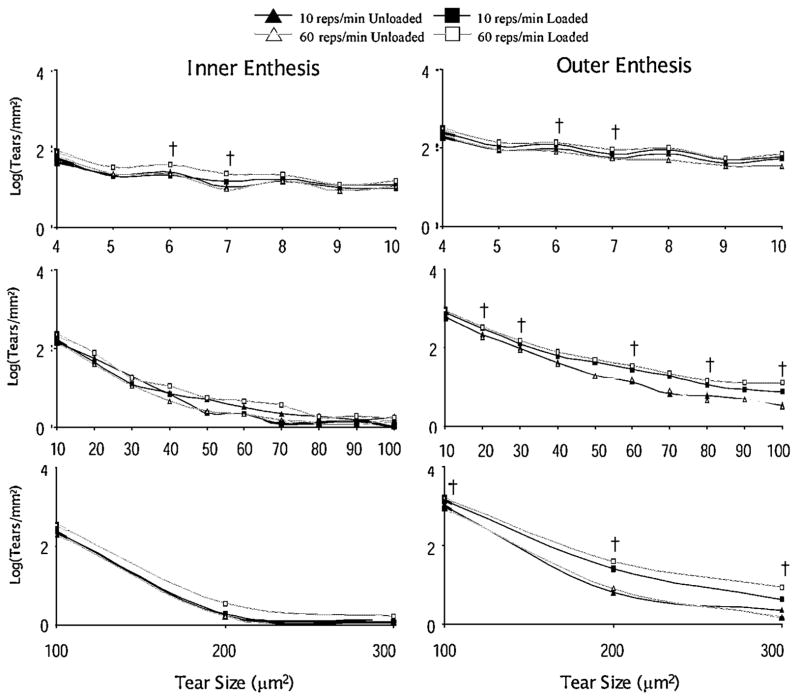
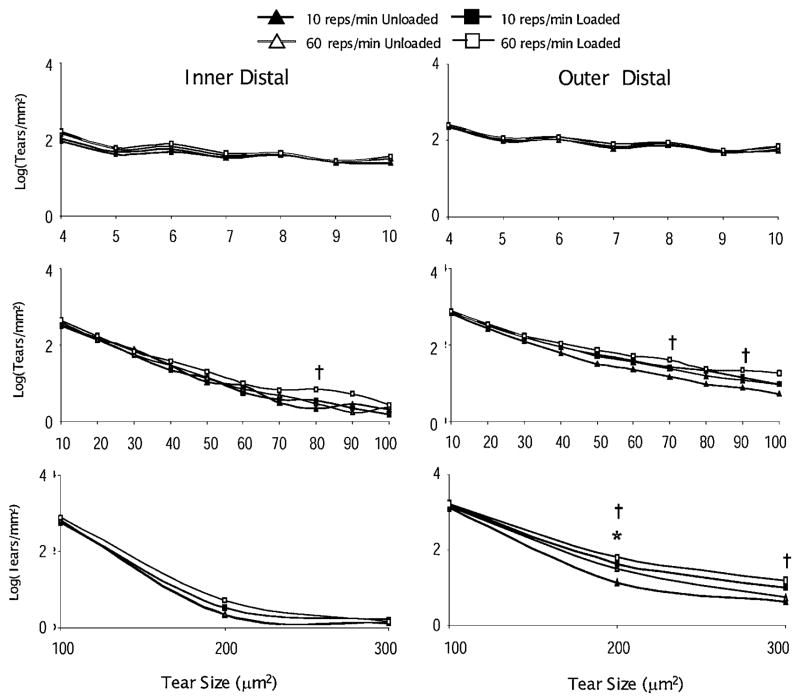
The distributions of tears by size are presented in Figures 5 and 6. The 60 rep/min loading group demonstrated a broader range of differences in tear density.3 Across nearly all tear sizes, the tear density in the loaded tendon was greater in the 60 reps/min loading group, especially in the outer enthesis region. These broad ranges of differences were not observed in the 10 reps/min group, where the only significant difference with load occurred at the 200 μm (symbolize) tear size (Fig. 6).
Figure 5.
The log of the distribution of microtears by tear size for the inner and outer regions of the tendon at the enthesis for both loading groups. No significant differences were found in the 10 reps/min group (paired t-test, p <0.01). The symbol † indicates a significant difference between unloaded and loaded limbs (paired t-test, p <0.01) in the 60 reps/min group, n =9.
Figure 6.
The log of the distribution of microtears by size for the inner and outer parts of the tendon distal to the enthesis for both loading groups. The symbols † and * indicate significant differences between unloaded and loaded limbs (paired t-test, p <0.01) in the 60 (n =9) and 10 (n =8) reps/min group, respectively.
DISCUSSION
This is the first study to evaluate the effect of repetition rate on tendon damage, specifically the formation of microtears, in an in vivo cyclical loading model. A loading rate of 10 reps/min significantly increased tear area as a percent of tendon area and the mean tear size, but had negligible effect on tear density. This differs from what we previously found for a repetition rate of 60 reps/min,3 where all tear parameters of (area percent, density, and size) were significantly greater in the loaded limb compared to the unloaded limb. The higher repetition group had larger changes in tear area as a percent of tendon area (p =0.01), whereas differences were borderline for the tear density (p =0.07) and not significantly different for the mean tear size (p =0.18) (Fig. 4). An examination of tear densities by size revealed that loaded tendons from the higher repetition group consistently had higher tear densities across the majority of tear sizes (Figs. 5 and 6), whereas only tears of 100 to 200 μm2 in size were significantly different in tear density for the lower repetition group. These differences are masked when the tear sizes are grouped. These findings provide some insight into the effect of loading rate on tendon microtear formation; lower rates cause relatively larger tears, but high rates cause tears across a spectrum of sizes. Larger tears may be the first ones to form with repetitive loading, indicating that the fatigue failure point for larger areas with poor cross-linking is less than the failure point for smaller areas with poor cross-linking.
Overall, our findings suggest a dose-response relationship between repetition rate and measures of microtears. The higher repetition rate caused greater microtear formation than the lower rate at the same peak force and duty cycle. The higher repetition rate exposed the tendon to six times more loading cycles (288,000 vs. 48,000). However, because load duration was longer for the low repetition rate (1,200 vs. 200 ms), the cumulative loading duration was the same for both. This experiment cannot separate the contribution of total number of cycles versus loading rate to injury; both are closely related. These differences should be explored in future studies.
The increased duration of nonloading at the low repetition rate may allow for more tendon recovery between loading cycles, which may have contributed to the observed differences. The tendon-muscle-tendon unit has viscoelastic properties, including creep, history-dependence, and loss of energy during cyclic loading. Although the cumulative times that the forces were elevated were equal in both loading conditions, the times allowed for recovery (0.8 s for 60 reps/min vs. 4.8 s for 10 reps/min) before the next loading cycle were not equivalent. In addition, during a loading cycle, energy dissipation may occur and may transfer into internal heat, affecting the physiological state of the tendon.
A number of animal models have been developed to study the effect of cyclical loading on tendon.15–21 Some studies examined the effects on different outcomes (histological, cellular, biochemical, or mechanical) of one loading regimen at different time points.17,18,20–22 Others15,16 investigated the effects of loading at one time point. A few15,16,19 compared loaded to unloaded tendons of the same animal. These previous in vivo loading models utilized rates as low as 4 reps/min17 to as high as 150 reps/min.16 Barbe et al.17 utilized low forces (Fpeak < 0.15 MVC) and repetition rates (4/min) in a rat volitional study and found both behavioral and histological changes. These changes started in week 3 and continued until the end of the study in week 8. They found a decrease in reach rate and task duration and a change in the preferred grasping technique utilized by the rats. The number of resident and infiltrating macrophages was significantly higher from the baseline control group at week 3, and tendon fraying was present after 5 weeks at the musculotendon junction. Soslowsky’s overuse rotator cuff model exposing rats to treadmill running used repetition rates of approximately 120 reps/min.18,21,22 Peak forces were unknown. If the forces were similar to those involved during gait and jogging, the forces were high relative to our study and other studies.15–17,19 Soslowsky et al. showed gross mechanical changes at 4 weeks of running (1 h/day, 5 day/week), including an increase in tendon cross sectional area, a decrease in maximum tensile stress, and a decrease in elastic modulus relative to a control group. Perry et al., using the same overuse model, showed an increase in mRNA of inflammatory markers (COX-2 and FLAP) and angiogenic factors (VEGF, VWF) after 3 days of exercise. COX-2 and FLAP expression peaked at 8 weeks. We previously demonstrated in our model that other angiogenic components (VEGF, VEGFR-1, and CTGF) increased with 60 reps/min of cyclical loading of the FDP muscle, but we did not look at earlier time points.23
Although the differences in tear measures between limbs were greater at the higher rate, there were similar regional differences (p <0.001) for both the 60 and 10 repetition rates. Larger differences were present in tear measures between unloaded and loaded tendons between the two loading groups (10 vs. 60 reps/min) at the outer tendon regions (Fig. 4). Along the inner regions, there were little differences between loaded and unloaded tendons in the lower rate group (Fig. 4). The inner regions had greater tear measures than their unloaded counterpart for the higher loading rate (60 reps/min). This regional variation may be due to the inhomogenous stress distribution that occurs with normal loading.24–27 As the FDP tendon is loaded, the region adjacent to bone (inner enthesis) experiences tension and compression but the compression results in fibrocartilage formation.24–27 Fibrocartilage has mechanical and biological properties that allow it to absorb compressive stresses27 and as a result is found in tissues bearing compressive loads such as cartilage. These compositional differences may contribute to the different regional response to loading. The inner and outer enthesis are structurally different and may have different failure modes and strain differences under repetitive loads. The outer regions of the tendon are composed mainly of type I collagen (30% wet weight), which provides tensile strength. Although collagen has high tensile strength, these collagen fibrils may be at risk for failure under cyclical loading patterns as the fibers continually slide past one another, disrupting collagen cross-links. Intermolecular cross-links are a stabilizing feature and contribute to tendon strength and stiffness. Chronic loading may reduce the cross-link concentration through combined fatigue damage and collagen synthesis. Exercise can increase collagen synthesis,28 resulting in the presence of smaller diameter fibers that may or may not have intermolecular cross-links, because the cross-linking process undergoes an enzymatic development and maturation process.29 Therefore, damage may occur in these areas.
Several limitations of this model should be noted. Tendons were evaluated after 80 h of cumulative loading. Earlier time points may provide insight into the onset of microtear formation and biochemical changes that may precede microtear formation. Only four regions of the tendon were evaluated; changes in other areas such as the musculotendon junction may be important. Furthermore, tendon is a 3D structure, while our analysis measured microtears in 2D sections taken from nine sections in the middle of the tendon; this process may have missed changes at the periphery of the tendon. Another limitation relates to our understanding of the microtear findings. The relationship between microtears and other measures of tendon degradation (e.g., necrosis, angiofibroblastic dysplasia, increases in proteases and growth factors) should be studied.
Surprisingly, microtears were observed in the unloaded, control tendons. There may be a background rate of microtears that occurs normally with cage or usual activities in this species. As far as we are aware, the quantification of tendon microtears has not been previously systematically investigated. Other possible contributors to microtear formation are the dehydration, heating, and sectioning used in histological processing. Microtears could be artifacts of the tissue preparation. However, this does not explain the significant differences observed between loaded and unloaded tendons. Each tendon pair was processed and analyzed simultaneously with blinding to limb loading status. All statistical comparisons were done within rabbits, that is, the exposed limb was compared to the control limb of the same rabbit. Therefore, differences in microtears are due to loading. However, if microtears are partly due to tissue preparation, then loading may have increased the fragility of the tendon, possibly due to changes in collagen cross-linking, making it more susceptible to microtear formation. Microtears would then be an indirect measure of increased tendon fragility occurring in the loaded tendon.
In conclusion, overuse tendon damage is associated with several biomechanical loading parameters. Peak force, repetition rate, sustained posture extremes, and duration are associated risk factors based on epidemiologic studies.10–13,30,31 Our study suggests a dose-response relationship between repetition rate or cumulative number of cycles and the formation of microtears or increased fragility in tendons. A higher rate led to greater measures of tear damage across all regions of the tendon. The lower rate had little effect along the inner regions of the tendon; greater changes occurred along the outer regions. These regional differences are likely due to differences in tissue properties or the presence of an inhomogenous strain distribution during peak loads. Applying the same peak force at lower repetition rates may prevent microtears or increased fragility in tendon compared to applying the same load at higher loading rates where both loading patterns have equivalent duty cycles. These findings may be useful in the understanding, management, and prevention of tendinopathies.
Acknowledgments
This work was supported by the National Institute for Occupational Safety and Health (R01-0H07359). The authors wish to thank Alex Portnoy, Yuka Nakamura, and Keiko Amano for their contributions to this study.
References
- 1.Jozsa L, Kannus P. Histopathological findings in spontaneous tendon ruptures. Scand J Med Sci Sports. 1997;7:113–118. doi: 10.1111/j.1600-0838.1997.tb00127.x. [DOI] [PubMed] [Google Scholar]
- 2.Kannus P. Tendons—a source of major concern in competitive and recreational athletes. Scand J Med Sci Sports. 1997;7:53–54. [PubMed] [Google Scholar]
- 3.Nakama LH, King KB, Abrahamsson S, et al. Evidence of tendon microtears due to cyclical loading in an in vivo tendinopathy model. J Orthop Res. 2005;23:1199–1205. doi: 10.1016/j.orthres.2005.03.006. [DOI] [PubMed] [Google Scholar]
- 4.Gibbon WW, Cooper JR, Radcliffe GS. Sonographic incidence of tendon microtears in athletes with chronic Achilles tendinosis. Br J Sports Med. 1999;33:129–130. doi: 10.1136/bjsm.33.2.129. [DOI] [PMC free article] [PubMed] [Google Scholar]
- 5.La S, Fessell DP, Femino JE, et al. Sonography of partial-thickness quadriceps tendon tears with surgical correlation. J Ultrasound Med. 2003;22:1323–1329. doi: 10.7863/jum.2003.22.12.1323. quiz 1330–1331. [DOI] [PubMed] [Google Scholar]
- 6.Cvitanic O, Henzie G, Skezas N, et al. MRI diagnosis of tears of the hip abductor tendons (gluteus medius and gluteus minimus) AJR Am J Roentgenol. 2004;182:137–143. doi: 10.2214/ajr.182.1.1820137. [DOI] [PubMed] [Google Scholar]
- 7.Steinborn M, Heuck A, Jessel C, et al. Magnetic resonance imaging of lateral epicondylitis of the elbow with a 0.2-T dedicated system. Eur Radiol. 1999;9:1376–1380. doi: 10.1007/s003300050851. [DOI] [PubMed] [Google Scholar]
- 8.Yu JS, Popp JE, Kaeding CC, et al. Correlation of MR imaging and pathologic findings in athletes undergoing surgery for chronic patellar tendinitis. AJR Am J Roentgenol. 1995;165:115–118. doi: 10.2214/ajr.165.1.7785569. [DOI] [PubMed] [Google Scholar]
- 9.Ohashi K, El-Khoury GY, Bennett DL. MDCT of tendon abnormalities using volume-rendered images. AJR Am J Roentgenol. 2004;182:161–165. doi: 10.2214/ajr.182.1.1820161. [DOI] [PubMed] [Google Scholar]
- 10.Luopajarvi T, Kuorinka I, Virolainen M, et al. Prevalence of tenosynovitis and other injuries of the upper extremities in repetitive work. Scand J Work Environ Health. 1979;5(suppl 3):48–55. [PubMed] [Google Scholar]
- 11.Maffulli N, Wong J, Almekinders LC. Types and epidemiology of tendinopathy. Clin Sports Med. 2003;22:675–692. doi: 10.1016/s0278-5919(03)00004-8. [DOI] [PubMed] [Google Scholar]
- 12.Werner RA, Franzblau A, Gell N, et al. Predictors of persistent elbow tendonitis among auto assembly workers. J Occup Rehabil. 2005;15:393–400. doi: 10.1007/s10926-005-5945-6. [DOI] [PubMed] [Google Scholar]
- 13.Latko WA, Armstrong TJ, Franzblau A, et al. Cross-sectional study of the relationship between repetitive work and the prevalence of upper limb musculoskeletal disorders. Am J Ind Med. 1999;36:248–259. doi: 10.1002/(sici)1097-0274(199908)36:2<248::aid-ajim4>3.0.co;2-q. [DOI] [PubMed] [Google Scholar]
- 14.Roquelaure Y, Mechali S, Dano C, et al. Occupational and personal risk factors for carpal tunnel syndrome in industrial workers. Scand J Work Environ Health. 1997;23:364–369. doi: 10.5271/sjweh.233. [DOI] [PubMed] [Google Scholar]
- 15.Archambault JM, Hart DA, Herzog W. Response of rabbit Achilles tendon to chronic repetitive loading. Connect Tissue Res. 2001;42:13–23. doi: 10.3109/03008200109014245. [DOI] [PubMed] [Google Scholar]
- 16.Backman C, Boquist L, Friden J, et al. Chronic achilles paratenonitis with tendinosis: an experimental model in the rabbit. J Orthop Res. 1990;8:541–547. doi: 10.1002/jor.1100080410. [DOI] [PubMed] [Google Scholar]
- 17.Barbe MF, Barr AE, Gorzelany I, et al. Chronic repetitive reaching and grasping results in decreased motor performance and widespread tissue responses in a rat model of MSD. J Orthop Res. 2003;21:167–176. doi: 10.1016/S0736-0266(02)00086-4. [DOI] [PMC free article] [PubMed] [Google Scholar]
- 18.Carpenter JE, Flanagan CL, Thomopoulos S, et al. The effects of overuse combined with intrinsic or extrinsic alterations in an animal model of rotator cuff tendinosis. Am J Sports Med. 1998;26:801–807. doi: 10.1177/03635465980260061101. [DOI] [PubMed] [Google Scholar]
- 19.Messner K, Wei Y, Andersson B, et al. Rat model of Achilles tendon disorder. A pilot study. Cells Tissues Organs. 1999;165:30–39. doi: 10.1159/000016671. [DOI] [PubMed] [Google Scholar]
- 20.Perry SM, McIlhenny SE, Hoffman MC, et al. Inflammatory and angiogenic mRNA levels are altered in a supraspinatus tendon overuse animal model. J Shoulder Elbow Surg. 2005;14:79S–83S. doi: 10.1016/j.jse.2004.09.020. [DOI] [PubMed] [Google Scholar]
- 21.Soslowsky LJ, Thomopoulos S, Tun S, et al. Neer Award 1999. Overuse activity injures the supraspinatus tendon in an animal model: a histologic and biomechanical study. J Shoulder Elbow Surg. 2000;9:79–84. [PubMed] [Google Scholar]
- 22.Soslowsky LJ, Thomopoulos S, Esmail A, et al. Rotator cuff tendinosis in an animal model: role of extrinsic and overuse factors. Ann Biomed Eng. 2002;30:1057–1063. doi: 10.1114/1.1509765. [DOI] [PubMed] [Google Scholar]
- 23.Nakama LH, King KB, Abrahamsson S, et al. VEGF, VEGFR-1, and CTGF cell densities in tendon are increased with cyclical loading: An in vivo tendinopathy model. J Orthop Res. 2006;24:393–400. doi: 10.1002/jor.20053. [DOI] [PubMed] [Google Scholar]
- 24.Huang CY, Wang VM, Pawluk RJ, et al. Inhomogeneous mechanical behavior of the human supraspinatus tendon under uniaxial loading. J Orthop Res. 2005;23:924–930. doi: 10.1016/j.orthres.2004.02.016. [DOI] [PubMed] [Google Scholar]
- 25.Malaviya P, Butler DL, Boivin GP, et al. An in vivo model for load-modulated remodeling in the rabbit flexor tendon. J Orthop Res. 2000;18:116–125. doi: 10.1002/jor.1100180117. [DOI] [PubMed] [Google Scholar]
- 26.Waggett AD, Ralphs JR, Kwan AP, et al. Characterization of collagens and proteoglycans at the insertion of the human Achilles tendon. Matrix Biol. 1998;16:457–470. doi: 10.1016/s0945-053x(98)90017-8. [DOI] [PubMed] [Google Scholar]
- 27.Wakabayashi I, Itoi E, Sano H, et al. Mechanical environment of the supraspinatus tendon: a two-dimensional finite element model analysis. J Shoulder Elbow Surg. 2003;12:612–617. doi: 10.1016/s1058-2746(03)00214-3. [DOI] [PubMed] [Google Scholar]
- 28.Miller BF, Olesen JL, Hansen M, et al. Coordinated collagen and muscle protein synthesis in human patella tendon and quadriceps muscle after exercise. J Physiol. 2005;567:1021–1033. doi: 10.1113/jphysiol.2005.093690. [DOI] [PMC free article] [PubMed] [Google Scholar]
- 29.Bailey AJ. Molecular mechanisms of ageing in connective tissues. Mech Ageing Dev. 2001;122:735–755. doi: 10.1016/s0047-6374(01)00225-1. [DOI] [PubMed] [Google Scholar]
- 30.Descatha A, Leclerc A, Chastang JF, et al. Medial epicondylitis in occupational settings: prevalence, incidence and associated risk factors. J Occup Environ Med. 2003;45:993–1001. doi: 10.1097/01.jom.0000085888.37273.d9. [DOI] [PMC free article] [PubMed] [Google Scholar]
- 31.Roquelaure Y, Mariel J, Fanello S, et al. Active epidemiological surveillance of musculoskeletal disorders in a shoe factory. Occup Environ Med. 2002;59:452–458. doi: 10.1136/oem.59.7.452. [DOI] [PMC free article] [PubMed] [Google Scholar]


