Summary
Recently there has been an increasing interest in using spectral searching as an alternative to traditional database sequence searching methods for peptide identification from tandem mass spectrometry. In spectral searching, the query spectrum is compared to a carefully compiled library of previously observed and identified spectra; high spectral similarity signals positive identification. We have previously developed an open-source software toolkit, SpectraST, to enable proteomics researchers to integrate spectral searching into their data analysis pipeline. Here we report an additional module to SpectraST that provides the functionality of spectral library building, allowing users to build custom libraries when public spectral libraries do not adequately meet their needs. A consensus creation algorithm was developed to coalesce replicate spectra identified to the same peptide ion. Various quality filters were implemented to remove questionable and low-quality spectra from the library. To validate the methodology, we first compiled a spectral library from the 1.3 million SEQUEST-identified spectra (29,109 distinct peptide ions) among the publicly released datasets in the Human Plasma PeptideAtlas, a collection of 40 contributed, heterogeneous shotgun proteomics datasets, and verified the effectiveness of the library building algorithm to generate high-quality, representative consensus spectra and to remove questionable spectra. We then re-searched the same datasets by SpectraST against this spectral library filtered at different quality levels, and used the performance as a benchmark to evaluate our library building methods and to determine key parameters for high-quality library building. We demonstrated the importance of library quality on the performance of spectral searching. The ready-to-deploy software allows individual researchers to easily condense their raw data into specialized spectral libraries, summarizing useful information about their observed proteomes into a concise and retrievable format for future data analyses.
Introduction
The inference of the peptide sequence from the tandem mass (MS/MS) spectra of fragmented peptide ions is a critical step in mass-spectrometry based proteomics workflows. In most proteomics application, this step is achieved by sequence database searching. In this approach, a target protein (or translated DNA) sequence database is used as a reference to generate all possible putative peptide sequences by in silico digestion. The sequence search engine then uses various rules to predict the theoretical fragmentation pattern of each of these putative peptides, and compare the experimentally observed MS/MS spectra to these theoretical spectra one-by-one for the best match (1–4). Unfortunately, due to the enormous search space and to the computationally expensive spectral processing and similarity scoring algorithms, sequence searching is time-consuming, and often requires substantial computational resources. With the advent of more powerful mass spectrometers that are capable of generating spectra at even faster rates, coupled with the increased interest in applying proteomics techniques to more sophisticated experiments that require larger amounts of data, this problem is expected to get worse in time. In addition, because of the uncertainty of the theoretical fragmentation pattern predictions, the similarity scoring in sequence searching is suboptimal and often error-prone. It is therefore important to devise methods that are more efficient and accurate than traditional sequence database searching for identifying peptide MS/MS spectra (5,6).
Spectral library searching has been proposed as a useful complement, and in some cases, a promising alternative to sequence database searching (7). In this approach, the peptide identification is made by comparing the query MS/MS spectrum to a library of reference spectra for which the identifications are known. This method has been commonly practiced for mass spectrometric analysis of small molecules (8–10). Recently, thanks to the rapid accumulation of shotgun proteomics data from which spectral libraries could be compiled, spectral searching has become a reality for proteomics applications, with some preliminary demonstration of success (11–14). As discussed in these reports, the advantages of spectral library searching over traditional sequence searching are manifold. First, because the search space is confined to previously observed and identified peptides, the search engine does not waste computational time attempting to match the query spectra with putative peptide sequences that are never observed in practice. This results in a drastic increase in search speed and selectivity. Second, similarity scoring in spectral searching is more precise, in that one is comparing experimental spectra to experimental spectra, and not to simplistic theoretical spectra constructed from peptide sequences. Consequently, spectral searching is able to take full advantage of all spectral features, including actual peak intensities and the presence of uncommon fragment ions, to determine the best match. Therefore, the discriminating power of spectral searching is often much greater, resulting in improved sensitivity and false discovery rates. Third, spectral libraries can be condensed from identifications made by multiple methods (e.g., different sequence search engines), allowing the strengths of each method to complement each other and yield the best coverage possible. Consequently, by spectral searching against such a library, one can reap the benefit of combining multiple methods, but without the additional time and cost (11).
Of course, the availability of suitable spectral libraries is the prerequisite for the successful implementation of spectral searching. In the context of proteomics, where the sheer number of observable peptides makes it impractical to generate every reference spectrum from a purified peptide, spectral libraries are typically compiled from peptide MS/MS spectra that are obtained from the analysis of complex biological samples and identified confidently by traditional sequence database searching. Recently, the National Institute of Standards and Technology (NIST) has taken the steps to extend their mass spectral reference library, previously consisting of small molecules, to include peptides from various organisms. Drawing from public shotgun proteomics data available in various data repositories, they have compiled consensus spectral libraries for 4 organisms, totaling about 90,000 spectra (15). Other smaller publicly available libraries include those from X!Hunter (12) and from BiblioSpec (13). At the same time, we have developed SpectraST, an open-source spectral search engine, to utilize these libraries for peptide identification (11).
However, despite the emergence of these public spectral libraries, there remains an acute need for a ready-to-deploy software tool to create custom spectral libraries. The variety of biological systems studied by mass spectrometry-based proteomics techniques is simply too great for a centralized effort like NIST’s to tackle. Most likely, only the most popular model organisms will have corresponding public spectral libraries. Even for these organisms, specialized libraries covering subproteomes of interest are likely more useful than generic ones released by NIST. Besides, there may also be needs for specialized libraries due to differences in experimental practice (e.g., specialized peptide derivatization for enrichment or quantification purposes), instrumentation and data acquisition parameter settings. Futhermore, due to various constraints, some proteomics data are proprietary and cannot be released to the public domain for centralized library building. A research group focused on a biological system not covered by a suitable public spectral library can only resort to building their own custom spectral library.
To meet the needs discussed above, we have developed a ready-to-deploy library building tool for use with proteomics data. Specifically, we have extended SpectraST, an open-source spectral library search engine described above, to enable users to build their own spectral libraries from sequence search results from several popular search engines. In the remainder of this paper, we describe the library building features of this software tool. We also compared various library building strategies proposed previously in the literature.
Experimental Procedures
Software Development
SpectraST is written in C++ and compiled on a Linux platform, although a Windows-compatible version is made available together with the Trans Proteomic Pipeline (TPP) software suite (16). The open-source, readily extensible software is designed to work efficiently on modest computational resources, and requires no relational database backend or other sophisticated computational infrastructure.
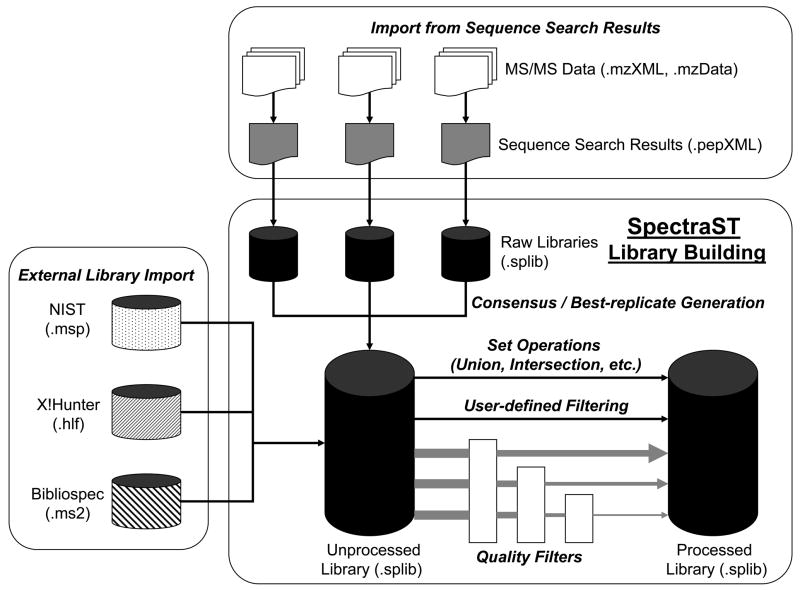
The spectral searching component of SpectraST has been previously described (11). To enable users to build their own libraries from sequence search results, SpectraST has been extended to accept sequence search results as input in the open pepXML format (16), and to perform various library building functions, including consensus creation, best replicate selection, and quality filters. Currently, search results from the sequence search engines SEQUEST (4), Mascot (17), X!Tandem (18), Phenyx (19) and ProbID (20) can be written to pepXML formats through the use of the Trans Proteomic Pipeline (TPP) software suite (16), and can all be used in library building by SpectraST. It also provides other useful features, such as import of other public library formats (NIST, X!Hunter and BiblioSpec), operations on libraries (union, intersection, filters, etc.), and visualization of library spectra. The various library building functionalities of SpectraST are depicted in Figure 1. Due to the open-source nature, users are empowered to further explore strategies of library building within the framework of SpectraST.
Figure 1.
A schematic diagram showing the various library building functionalites of SpectraST. Pertinent file formats are given in parentheses.
We have also made SpectraST part of the TPP, which provides full workflow support, including raw data file conversion to the open mzXML (21) format, automatic validation by PeptideProphet (22), quantification, and data visualization, among others. This unique advantage of SpectraST should enable users to switch over to the new workflow based on spectral searching with minimal effort. The software is freely available to the community (23).
Generation of Peptide MS/MS Spectra
In this study, we make use of the 40 publicly released (out of 61 total) datasets comprising the current build of the Human Plasma PeptideAtlas (Build 2007-04). PeptideAtlas is a compendium of confidently identified peptides derived from a large number of contributed, heterogeneous experiments processed through a uniform pipeline with validation (24–26). Brief information about the sample preparation and instrumentation procedures employed in these datasets is listed in Table 1; detailed information can be found in their respective references. All samples are prepared from human serum or plasma, and digested with trypsin. Sample depletion and fractionation methods vary from dataset to dataset. All the datasets used in this study are from various models of ion-trap instruments. All of the datasets are available as raw files, mzXML files, and SEQUEST search results on the data repository of PeptideAtlas (http://www.peptideatlas.org/repository/).
Table 1.
List of Human Plasma PeptideAtlas Datasets Used in This Study.
| Dataset Identifier | Ref | MS Instrument | Sample Preparation a | # MS runs | # MS/MS spectra | # Positive SEQ IDs b |
|---|---|---|---|---|---|---|
| HUPO-ISB/b1-CIT_glyco_lcq | 27 | LCQ Classic | Gly,IAM,SCX | 46 | 148536 | 8206 c |
| HUPO-ISB/NIBSC_glyco_lcq | 27 | LCQ Classic | Gly,IAM,SCX | 47 | 157370 | 18486 c |
| HUPOPPP12/HUPO12_run31 | 27 | LCQ Deca | Alb,Ig,IAM,SCX | 15 | 27007 | 1041 d |
| HUPOPPP12/HUPO12_run32 | 27 | LCQ Deca | Alb,Ig,IAM,SCX | 15 | 29383 | 1292 d |
| HUPOPPP12/HUPO12_run33 | 27 | LCQ Deca | Alb,Ig,IAM,SCX | 15 | 24726 | 1463 d |
| HUPOPPP12/HUPO12_run34 | 27 | LCQ Deca | Alb,Ig,IAM,SCX | 15 | 21311 | 1043 d |
| HUPOPPP22/HUPO22_M_CA_S | 27 | LCQ Deca XP | Top6,IAM,SCX | 219 | 517747 | 11706 d |
| HUPOPPP28/HUPO28_b1-CIT | 27 | LCQ Duo | None | 1 | 3570 | 412 c |
| HUPOPPP28/HUPO28_b1-SERUM | 27 | LCQ Duo | None | 1 | 3640 | 529 c |
| HUPOPPP28/HUPO28_b2-CIT | 27 | LCQ Duo | None | 5 | 12534 | 2032 c |
| HUPOPPP28/HUPO28_b2-SERUM | 27 | LCQ Duo | None | 5 | 12483 | 1676 c |
| HUPOPPP28/HUPO28_b3-CIT | 27 | LCQ Duo | None | 1 | 3631 | 578 c |
| HUPOPPP28/HUPO28_b3-SERUM | 27 | LCQ Duo | None | 1 | 3618 | 583 c |
| HUPOPPP28/HUPO28_Ref-CIT | 27 | LCQ Duo | None | 1 | 3543 | 413 c |
| HUPOPPP28/HUPO28_Ref-SERUM | 27 | LCQ Duo | None | 1 | 3546 | 366 c |
| HUPOPPP29/HUPO29_b1-CIT_1 | 27 | LCQ Deca XP | Top6,IAM,SCX | 17 | 132484 | 6313 c |
| HUPOPPP29/HUPO29_b1-CIT_win1 | 27 | LCQ Deca XP | Top6,IAM,SCX | 15 | 106995 | 3205 c |
| HUPOPPP29/HUPO29_b1-CIT_win2 | 27 | LCQ Deca XP | Top6,IAM,SCX | 15 | 90803 | 657 c |
| HUPOPPP29/HUPO29_b1-EDTA_1 | 27 | LCQ Deca XP | Top6,IAM,SCX | 15 | 130894 | 1250 c |
| HUPOPPP29/HUPO29_b1-EDTA_win1 | 27 | LCQ Deca XP | Top6,IAM,SCX | 15 | 112090 | 6117 c |
| HUPOPPP29/HUPO29_b1-EDTA_win2 | 27 | LCQ Deca XP | Top6,IAM,SCX | 14 | 84068 | 2286 c |
| HUPOPPP29/HUPO29_b1-HEP | 27 | LCQ Deca XP | Top6,IAM,SCX | 15 | 133616 | 762 c |
| HUPOPPP29/HUPO29_b1-SERUM | 27 | LCQ Deca XP | Top6,IAM,SCX | 15 | 129002 | 2057 c |
| HUPOPPP34/HUPO34 | 27 | LCQ Deca XP | Top6,IAM,pI,Size | 140 | 477321 | 13522 c |
| HUPOPPP34/HUPO34_b1-SERUM | 27 | LTQ | Top6,IAM,pI,Size | 157 | 1116626 | 75221 d |
| HUPOPPP37/HUPO37_b1-HEP_2LCQ | 27 | LCQ Deca XP | None | 17 | 10953 | 27 c |
| HUPOPPP40/HUPO40 | 27 | LCQ | Alb,Ig,IAM,SCX | 126 | 66695 | 6124 c |
| wqian/HsPlasma_tryp_nonalkylated | 28 | LCQ Deca XP | Alb,Ig,SCX | 321 | 451115 | 141852 e |
| wqian/HsPlasma_tryp_alkylated | 28 | LCQ Duo | Alb,Ig,SCX,IAM | 140 | 2277496 | 46480 e |
| mpeitsch/NovartisPlasma/MicroProt | 29 | Bruker Esquire | Alb,Ig,IAM,Size,SCX | 38252 | 5741424 | 284100 c |
| mpeitsch/NovartisPlasma/MicroProt2 | 29 | Bruker Esquire | Alb,Ig,IAM,Size,SCX | 7480 | 2522032 | 480193 d |
| apaulovich/serum_fractionation/01_glyco | 30 | LTQ | Gly,IAM | 10 | 171207 | 33789 c |
| apaulovich/serum_fractionation/15_clinprot_c3 | 30 | LTQ | HIC,IAM | 10 | 138430 | 14891 c |
| apaulovich/serum_fractionation/16_clinprot_c8 | 30 | LTQ | HIC,IAM | 10 | 142338 | 13999 c |
| apaulovich/serum_fractionation/17_wcx | 30 | LTQ | WCX,IAM | 10 | 147259 | 26813 c |
| apaulovich/serum_fractionation/18_size | 30 | LTQ | Size,IAM | 10 | 166796 | 19813 c |
| apaulovich/serum_fractionation/19_proteintag | 30 | LTQ | Ig,IAM | 10 | 155402 | 8556 c |
| apaulovich/serum_fractionation/20_cys | 30 | LTQ | Cys,IAM | 10 | 150152 | 31852 c |
| apaulovich/serum_fractionation/21_unfract | 30 | LTQ | IAM | 10 | 74936 | 16013 c |
| apaulovich/serum_fractionation/22_mars | 30 | LTQ | Top6,IAM | 10 | 194523 | 37004 c |
Abbreviations for sample preparation: Alb = albumin depletion, Ig = Immunoglobulin depletion, Top6 = Depletion of 6 highest-abundance serum proteins, Gly: glycocapture enrichment, Cys: cysteinyl chemistry enrichment, IAM: alkylation of cysteines by iodoacetamide, SCX: strong cation exchange, pI: fractionation based on isoelectric point, Size: fractionation based on size, HIC: hydrophobic interaction chromatography, WCX: weak cation exchange.
SEQUEST identifications with PeptideProphet-estimated probabilities at or above 0.9.
Searched against human IPI (International Protein Index) database version 3.21;
Searched against human IPI database version 3.17;
Searched against human IPI database version 3.16.
Identifications of MS/MS Spectra by Sequence Searching
A total of about 16 million MS/MS spectra are acquired in the 40 datasets used in this study. The raw data files are converted to mzXML 2.0 format using converters available with the Trans Proteomic Pipeline (16). SEQUEST (version 27) is employed to identify the query spectra by searching against a human IPI protein sequence database (31) (see Table 1), with the following search parameters: +/− 3 Da parent average mass window, at least 1 tryptic terminus, up to 5 missed internal tryptic cleavage sites, and variable methionine oxidation (+16.0 Da). If applicable, cysteine alkylation modifications are also specified, depending on the sample preparation of each individual dataset. A deamidation modification (−1 Da) on asparagine is also specified for glyco-capture datasets. Exact search parameters used are available alongside the datasets in the PeptideAtlas repository.
The SEQUEST search results of each dataset are analyzed through the Trans Proteomic Pipeline. Mainly, PeptideProphet is used to validate the identifications and assign probabilities to them, and ProteinProphet (32) is used to infer the set of proteins present in the samples based on peptide identifications. A PeptideProphet probability above 0.9 is required for a peptide identification to be included in the PeptideAtlas. A total of 1.3 million spectra are identified with PeptideProphet probability above 0.9. The PeptideProphet-estimated false discovery rate for these 1.3 million identifications is 1.2%. The data are available for download and browsing as Human Plasma PeptideAtlas Build 2007-04 at http://www.peptideatlas.org/.
Library Building
A. Extraction of Experimental Spectra
The SEQUEST-searched, and PeptideProphet-processed results of all 40 datasets are filtered by SpectraST for confident identifications. A default PeptideProphet probability cutoff of 0.9 is used in this study, yielding a total of 1.3 million identifications. For each of these confident identifications, SpectraST extracts the corresponding MS/MS spectrum, and imports it into a raw spectral library. Each spectrum is normalized such that the base peak (most intense peak) has an intensity of 10000.0. Each library entry contains the identification (peptide sequence, charge state, modifications if any), the parent mass-to-charge ratio, the peak list of the experimental spectrum, and measures of confidence such as sequence search scores and PeptideProphet probabilities. The isotopically averaged parent mass-to-charge ratio of the library entry is calculated based on the peptide sequence.
B. Creation of Consensus Spectra
The raw spectral library generated as described in the previous section contains non-unique entries resulting from multiple observations of the same peptide ion. Spectra with the same peptide identification are termed replicates. Where available, replicates are combined to create a “consensus” spectrum that is representative of the peptide ion through a series of steps:
Remove dissimilar replicates – Pairwise dot products among replicates are calculated, and replicates that do not resemble the rest of the replicates are discarded.
Rank the remaining replicates by quality -- The remaining replicates are then ranked by their signal-to-noise ratio (defined here as the average intensity of the 2nd to 6th highest peaks divided by the median intensity).
Align the replicates -- For each replicate, alignment is performed for each peak, starting from the base peak, by looking for matching peaks in all other replicate spectra within an adaptive m/z tolerance that is inversely proportional to the intensity rank of the matched peak (+/− 0.8 Th at maximum). This helps limit the undesirable matching of noise peaks while allowing significant peaks to be aligned easily. This process is repeated for each replicate, starting from the top-ranked (highest signal-to-noise ratio), and for each remaining unaligned peak.
Remove noise peaks -- A peak “voting” scheme is adopted, whereby the aligned peak will be included in the final consensus spectrum if and only if it is present in more than 60% of the replicate spectra. In other words, the resulting consensus spectrum only contains peaks that are consistently present in a majority of the replicates, and therefore should be largely devoid of random noise or spurious impurity peaks.
Average peak m/z and intensities -- The consensus m/z and intensity values are calculated as weighted averages of the respective values of the corresponding peaks in the replicates. The weight used is the signal-to-noise ratio of the replicate, so that the consensus spectrum resembles the higher-quality replicates more than the lower-quality ones.
Perform book-keeping – Various types of information, including the sample sources and sequence searching scores are combined and copied over to the consensus library entry, such that valuable information of the originating datasets is preserved for future reference.
It should be noted that the above procedure for creating the consensus spectrum is devised in the hope that it will work reasonably well under less than ideal circumstances, such as when the number of replicates is small or when some replicates are of poor quality. The details of the methodology were developed by trail-and-error and manual inspection of many consensus spectra created with different methods and parameters, and were found to be effective. Due to the open-source nature of the software, the user is encouraged and empowered to further optimize the method as needed in different circumstances.
C. Quality filters
Even with a stringent probability cutoff and a deliberate and conservative approach in creating consensus spectra, the resulting consensus spectral library still contains occasional false positive identifications and low-quality spectra. To ensure that one does not propagate the error made in the initial identification by sequence searching, or induce rampant false positive matches to noisy spectra, the library is then subjected to various quality filters. Three different quality filters were implemented in SpectraST, and are described below. The user can select the desired quality level by turning on or off these qualiy filters. In this study, the same spectral library is filtered at different quality levels and the results compared in the Results and Discussion Section.
Impure spectra -- Impure spectra refer to spectra having an abnormally high number of intense but unexplained peaks given the peptide identification. These are determined by first attempting to annotate all the peaks as common fragment ions from the peptide identified, and then calculating the fraction of intensity that remains unannotated. SpectraST annotates each library spectrum using a comprehensive list of fragment ion types, including neutral losses from the parent ion, b-, and y-type ions and their neutral losses, a-type ions, and frequently observed fragments from alkylated cysteines. For each possible fragment ion, the spectrum is scanned for the most intense peak within +/− 0.8 Th of the theoretical monoisotopic m/z value of that fragment ion. If found, the peak is assigned the respective fragment ion annotation, and any present higher isotopic peaks (up to +2 Da from the monoisotopic peak) are also annotated as such. All remaining peaks are considered unannotated. We found that the quality filter is most effective if it only considers the 20 most intense peaks of a spectrum. The intensities of the unannotated peaks among the top 20 peaks are summed, and if this sum exceeds a default threshold of 40% of the total intensity of the top 20 peaks, the spectrum is considered impure and removed from the library. Note that since the annotation information is not used when creating the consensus spectra, no bias is introduced, and so the information can therefore be safely used for quality filter purposes.
Similar spectra having conflicting identifications -- Due to the presence of noise and other experimental artifacts, sequence searching can sometimes assign completely different identifications to highly similar spectra. Our experience suggests that one of the conflicting identifications is likely false. SpectraST detects these conflicting identifications by searching the library spectra against itself, and spotting any spectral matches (above a default dot product cutoff of 0.7) that do not occur between pairs of identical or homologous library entries. SpectraST will then decide which of the two identifications is more likely correct by comparing the number of replicates, whereby the identification made more times is favored. In case of a tie, the identification with the higher PeptideProphet probability is favored. The other spectrum with the conflicting identification is then removed from the library.
Singly observed spectra -- These spectra stem from peptide ions that are observed and identified only once among millions of identifications, and are often the result of false positive identifications by the sequence search engine. In SpectraST, the user can select whether to remove all singly observed spectra from the library, or to remove only the subset of singly observed spectra for which the identifications are unconfirmed by other library entries. To be considered confirmed, the identified sequence must either be identical to that of another library entry (but with a different charge state or modification), or share a sub-sequence with that of another library entry (e.g., a semitryptic peptide that is part of a tryptic peptide).
Library Evaluation by Spectral Searching
In order to test the libraries built as described above, the 40 datasets used to generate the spectral libraries are re-searched by spectral searching against the libraries using SpectraST. The search algorithm has been previously described (11). A precursor m/z tolerance of +/− 3.0 Th was used. In spectral searching, all candidate library spectra within the m/z tolerance, irrespective of the number of tryptic termini, charge state or modifications, are considered for each query spectrum. To compare library building strategies, we performed the same searches against 6 spectral libraries built from the same 40 datasets, as listed in Table 2.
Table 2.
Spectral libraries created from the 40 datasets listed in Table 1, and evaluated in this study.
| Library | Consensus/Best Replicate a | Removed by Quality Filter b | Max # Peaks c | # Spectra |
|---|---|---|---|---|
| Q0 | Consensus | No Filter | Full | 29109 |
| Q1 | Consensus | Impure, Conflicting ID | Full | 23841 |
| Q2 | Consensus | Impure, Conflicting ID, Singletons | Full | 16669 |
| Q2-BR | Best Replicate | Impure, Conflicting ID, Singletons | Full | 16669 |
| Q2-20p | Consensus | Impure, Conflicting ID, Singletons | Top 20 | 16669 |
| Q2-50p | Consensus | Impure, Conflicting ID, Singletons | Top 50 | 16669 |
Consensus (described in Section x) or Best-Replicate spectral libraries; in the latter, the replicate with the highest signal-to-noise ratio is selected as best for each peptide ion.
Types of spectra removed by the quality filters described in Section x.
Spectrum simplification: Full = no simplication; Top N = keeping only the N most intense peaks in each consensus spectrum.
The search result of each dataset was then run through the Trans Proteomic Pipeline. Specifically, PeptideProphet was employed to assign probabilities to the top-scoring hit of each query spectrum. The probability threshold, above which the search results were considered positive, was selected separately for each dataset to yield a dataset-wide false discovery rate of 1%, as modeled by PeptideProphet. The same analysis was performed for search results of each of the 6 spectral libraries. Receiver operator characteristics (ROC) curves were generated by aggregating the PeptideProphet model statistics across all 40 datatsets.
Results
Creation of Consensus Spectra
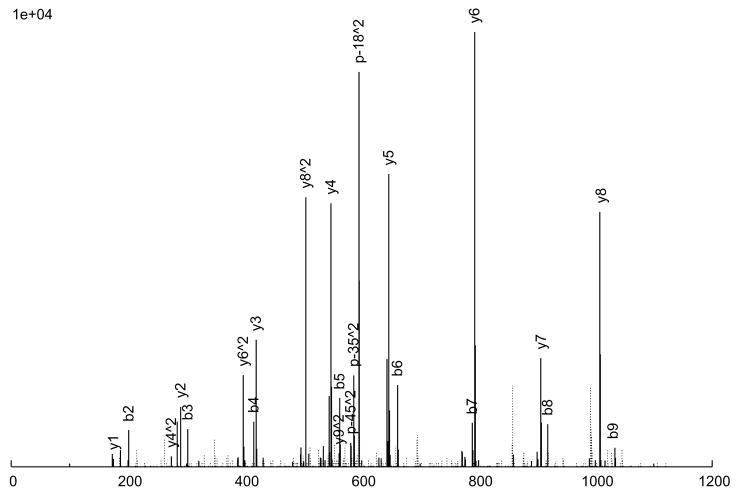
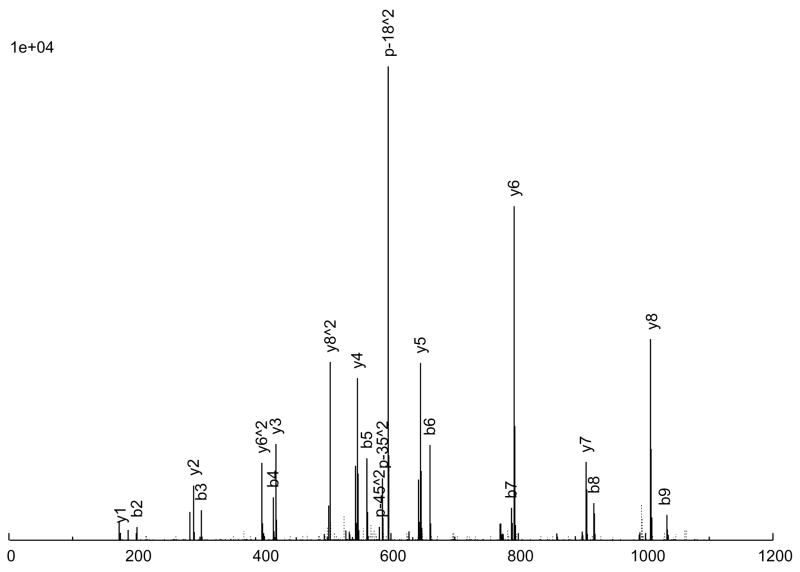
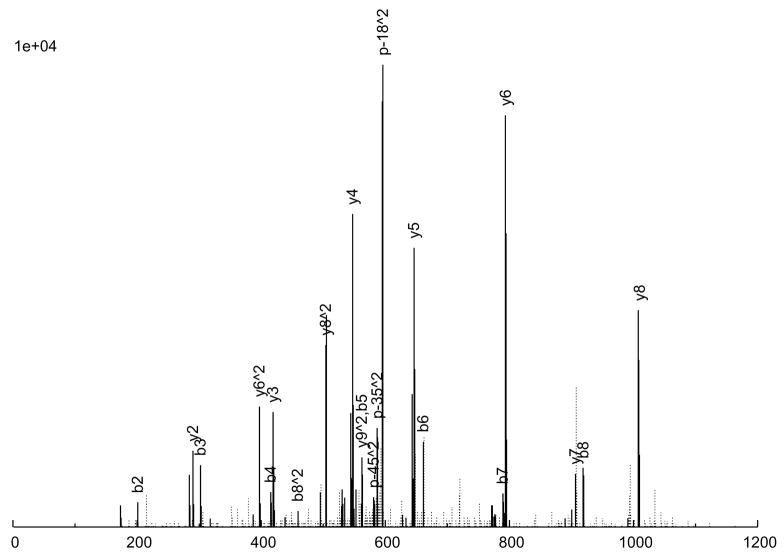
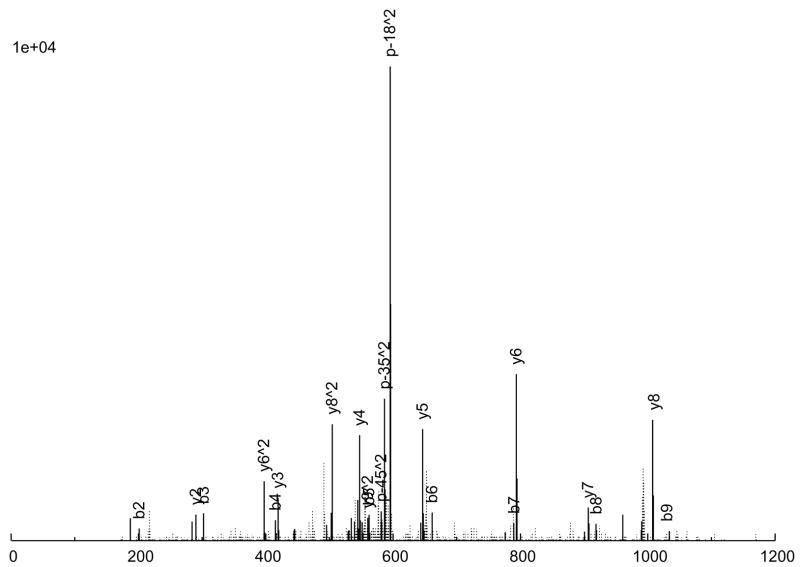
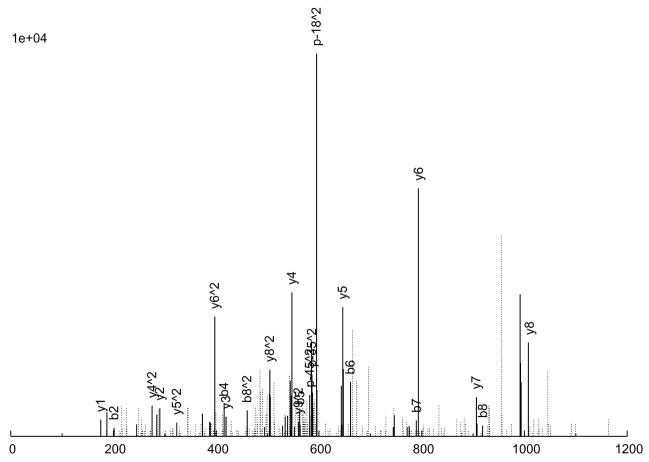
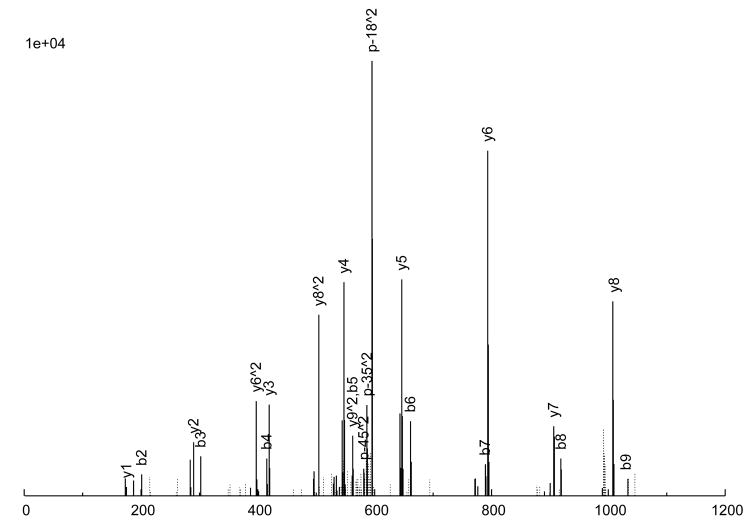
The consensus spectrum creation process is illustrated in an example in Figure 2 A peptide ion, SITLFVQEDR (charge +2), was observed 6 times (Figure 2a through 2f), with various quality measures listed in Table 3. As can be seen, 5 of the 6 replicate spectra (Figures 2a through 2e) are largely similar, but differ a great deal in quality. Figure 2a is probably the highest quality spectrum, with the best signal-to-noise ratio, and Figure 2e is the worst. Considering the peak intensities, large peaks are generally large across the board, but there are significant variations in the actual intensities among the replicates. Figure 2f, on the other hand, is an anomaly; it does not quite resemble the other 5 replicates at all, but was nevertheless assigned to the same peptide ion, by SEQUEST. From our experience, this degree of variation among replicate spectra is fairly typical.
Figure 2.
An example of consensus spectrum building. (a–f) Raw replicate spectra assigned to the same peptide ion SITLFVQEDR (charge +2) by SEQUEST at probabilities above 0.9. (g) Resulting consensus spectrum created for this peptide ion by SpectraST. Solid lines: annotated peaks (annotations shown for common ions); Dotted lines: unannotated peaks. Various quality measures of the replicates are listed in Table 2. All 6 replicates are from the same dataset HUPOPPP34/HUPO34_b1-SERUM, acquired on a ThermoFinnigan LTQ at a collision energy of 25.
Table 3.
Quality statistics of the 6 replicate spectra identified to the peptide ion SITLFVQEDR (+2) in Figure 2.
| % Unassigned Inte | Dot Productsf | |||||||
|---|---|---|---|---|---|---|---|---|
| Spectrum | Used?a | Probabilityb | xcorrc | S/Nd | Top 20 | All | vs Consensus (2g) | vs Best replicate (2a) |
| 2a | Y | 0.9995 | 2.77 | 72.3 | 6% | 26% | 0.913 | 1.000 |
| 2b | Y | 0.9985 | 3.12 | 63.3 | 4% | 16% | 0.920 | 0.867 |
| 2c | Y | 0.9885 | 3.60 | 55.3 | 12% | 30% | 0.914 | 0.843 |
| 2d | Y | 0.9846 | 2.12 | 27.2 | 38% | 49% | 0.785 | 0.731 |
| 2e | Y | 0.9117 | 1.86 | 14.5 | 44% | 50% | 0.650 | 0.654 |
| 2f | N | 0.9824 | 2.37 | 28.3 | 67% | 68% | 0.469 | 0.466 |
Whether of not that replicate is used in consensus creation.
PeptideProphet probability of the initial sequence search.
SEQUEST xcorr score of the initial sequence search.
Signal-to-noise ratio as defined in Methods section.
Percentage of intensities that have no annotation among the top 20 peaks and among all peaks.
The consensus spectrum generated by SpectraST is shown in Figure 2g. Several features of the consensus creation process are worth noting. First, the variation among replicate data can be rather large, and a successful consensus building strategy must effectively deal with this variability. This is true even for data acquired in the same instrument (ThermoFinnigan LTQ) in the same experiment (HUPOPPP34/HUPO34_b1-SERUM) as in this example. SpectraST was able to detect and remove the spectrum in Figure 2f from consideration, an extreme but not uncommon example of this inherent variability. On average, about 8% of replicate spectra are removed in this manner.
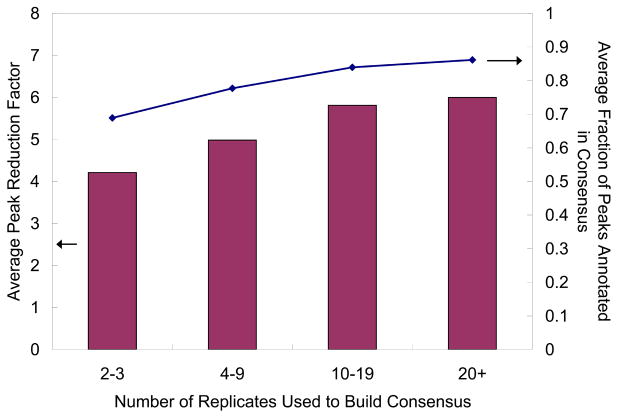
Second, the consensus spectrum (Figure 2g) is clearly much less noisy than any of the replicates, with significantly fewer unannotated peaks. This can be attributed largely to the peak voting scheme that selectively retains annotated peaks, even those within the noise regime, by virtue of their consistent presence in multiple observations. Figure 3 illustrates the noise reduction effect of the consensus creation process. Even for peptide ions with as few as 2 or 3 replicates, the number of peaks in the consensus spectrum is only about a quarter of those in the individual replicates; at the same time, the fraction of annotated peaks is much higher in the consensus spectrum (69%) than that in the individual replicates (42%). As more replicates are available, the peak reduction ratio increases until it plateaus at about 6, and the fraction of assigned peaks plateaus at about 86%. Therefore, it appears that the availability of more replicates improves the quality of the consensus spectrum, but the incremental increase is minimal after about 20 replicates. This is to be expected, as once a reliably representative consensus can be formed, introducing additional replicates to it should not add much information.
Figure 3.
Reduction of noise after consensus creation, by the number of replicates used. The average peak reduction factor (bars, left axis) is the average, over all library entries in that bin, of the peak reduction factor, which is defined as the average number of peaks in the replicate spectra divided by that in the consensus spectrum. The average fraction of peaks annotated in consensus (line, right axis) is the average, over all library entries in that bin, of the fraction of peaks that are annotated in the consensus spectrum. Note also that the average fraction of annotated peaks in the raw replicate spectra is about 42% (not shown in the figure).
Third, the overall appearance of the consensus spectrum resembles the higher-quality replicates, properly reflecting the difference in confidence in the accuracy of the observations. Quantitatively this can be seen in the second-to-last column of Table 3. This desirable effect is achieved by weighted-averaging the aligned peak intensities by a measure of replicate quality. Intuitively, uneven weighting is especially important in cases when only a handful of replicates are available, and some are of poor quality, as in the example shown in Figure 2.
In summary, building a consensus spectrum is analogous to the scientific practice of averaging multiple measurements of a quantity of interest, in order to obtain a reliable measurement closer to the truth by minimizing experimental noise and artifacts. Therefore, the consensus spectrum is not only a better representation of the expected fragmentation pattern of the peptide ion, but is often of higher quality than the individual observed spectra, as demonstrated.
Quality Control of the Spectral Library
In this study, the spectral library generated is subject to careful quality control. The motivation for this step is two-fold. First, because the spectral libraries are derived from sequence search results, one must be cognizant of the fact that some of the identifications are incorrect. Including these misidentified spectra in spectral libraries can potentially propagate the error of the sequence search engines and generate false positives in the spectral searching step. Second, even with the noise filtering mechanisms employed, some low-quality spectra still remain. These spectra may have been identified correctly by the sequence search engine, but are not likely to be representative of the peptide ion. The signal-to-noise ratio may be very poor, such that future matches to a spectrum are as likely to result from matching signals as from matching noise. Or there may be significant contamination due to coeluting peptides or other impurities, such that some intense peaks in the spectra do not come from the peptide ion identified. It is important to note that when creating a spectral library, the correctness of the identifications is essential, but not sufficient. The library spectra must also be high-quality and truly representative observations of the originating peptide ions in a relatively pure form, so that one can be confident that future matches to these library spectra necessarily imply the observations of the same peptide ions in the sample. Therefore special care must be taken to ensure the accuracy and quality of the library spectra.
We implemented three different quality filters for SpectraST to achieve the goal of pinpointing questionable spectra and removing them from our libraries. First, impure spectra, in which there are numerous intense unannotated peaks, for which no straightforward explanation can be found given the peptide identification, are detected and removed. In addition to weeding out many false positives, this also filters out extremely noisy spectra and spectra from highly contaminated peptide ions. Second, SpectraST also detects highly similar spectra which are assigned completely different identifications by the sequence search engine. Our experience suggests that one of the two conflicting identifications is likely a false positive, usually caused by the presence of noise that confuses the search engine. If these questionable spectra are allowed to remain in the library, they will not only propagate the false positives in spectral searching, but also cause false negatives when the questionable library spectra come up as high-scoring second hits, due to high spectral similarity to the corresponding correctly identified spectra. In this case, the top scoring hit will be erroneously considered insignificant and discarded, leading to false negatives. Third, as a conservative and simple approach, SpectraST also allows the user to remove all singly observed spectra. In a large enough body of data such as the Human Plasma PeptideAtlas, the odds are against observing a certain peptide ion only once among millions of acquired MS/MS spectra. On the other hand, false positive identifications, which can be thought of as randomly distributed in the search space, often end up being singly observed. In fact, removing all the so-called “one-hit wonders” from the set of identifications is a popular method to reduce the false discovery rates in large datasets. Moreover, in the context of spectral library building, the singly observed spectra should be treated with special caution, since no additional replicate is available to help remove random noise and ascertain the peak intensities. They are therefore of lower quality and less likely to be truly representative of their respective peptide ions.
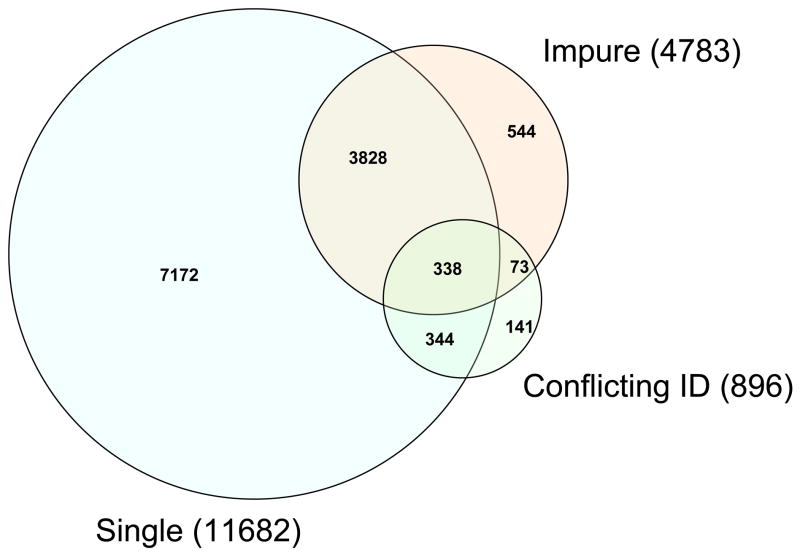
Some statistics of the consensus spectral libraries created from the Human Plasma PeptideAtlas datasets (Table 1) are presented in Table 4. The three columns represent the spectral libraries at different quality levels: Q0 (no quality control; all spectra are included), Q1 (intermediate quality level; impure spectra and spectra having spectrally similar counterparts with conflicting identifications are removed) and Q2 (high quality level; singly observed spectra are also removed in addition to those removed at Q1). As shown, the quality filters reduced the size of the library by 18% at the intermediate quality level, and 43% at the high quality level. Importantly, considering the breakdown by probability of correct identification (as estimated by PeptideProphet), the lower the probability, the more likely the spectrum will be removed by the quality filters. In addition, among the spectra removed at Q1, 86% are singly observed spectra, and 95% are observed in only one dataset. This is in line with the expectation that a good majority of the removed spectra should be false positives and thus should have lower probabilities and be more likely to be singly observed and only found in one dataset. This can also be seen in Figure 4, a Venn diagram of the 3 categories of questionable spectra determined by SpectraST. As shown, there is considerable overlap among the 3 groups, suggesting that many questionable spectra fail multiple filters, providing some cross-validation among the three filters based on different criteria. Manual inspection of many of the removed spectra confirmed that most of them are either misidentified or of poor quality.
Table 4.
Statistics of Consensus Spectral Libraries at different quality levels.
| Spectral library quality levels a | Q0 | Q1 (% decrease from Q0) | Q2 (% decrease from Q0) |
|---|---|---|---|
| Total number of spectra | 29109 | 23841 (18%) | 16669 (43%) |
| By peptide termini | |||
| Tryptic | 18265 | 14234 (22%) | 10448 (43%) |
| Semitryptic | 10844 | 9607 (11%) | 6221 (43%) |
| By charge state | |||
| +1 | 1841 | 1818 (1%) | 1152 (37%) |
| +2 | 18023 | 14237 (21%) | 10175 (44%) |
| +3 | 9245 | 7786 (16%) | 5342 (42%) |
| By probability b | |||
| >0.9999 | 9129 | 8973 (2%) | 8195 (10%) |
| 0.999–0.9999 | 3821 | 3648 (5%) | 2965 (22%) |
| 0.99–0.999 | 5432 | 4811 (11%) | 3291 (39%) |
| 0.9–0.99 | 10727 | 6409 (40%) | 2218 (79%) |
| By number of replicates | |||
| 1 | 11682 | 7172 (39%) | 0 (100%) |
| 2–3 | 4973 | 4493 (10%) | 4493 (10%) |
| 4–9 | 4663 | 4470 (4%) | 4470 (4%) |
| 10–19 | 2477 | 2441 (1%) | 2441 (1%) |
| 20+ | 5314 | 5265 (1%) | 5265 (1%) |
| By number of originating datasets | |||
| 1 | 17980 | 12992 (28%) | 5820 (68%) |
| 2–3 | 6590 | 6329 (4%) | 6329 (4%) |
| 4–9 | 3442 | 3424 (1%) | 3424 (1%) |
| 10–19 | 930 | 929 (0%) | 929 (0%) |
| 20+ | 167 | 167 (0%) | 167 (0%) |
Definition of the quality levels: Q0 = no filter; Q1 = impure spectra and spectra having similar counterparts with conflicting identifications are removed; Q2 = spectra from only one observation are also removed in addition to those removed at Q1.
Maximum probability among the originating replicates as estimated by PeptideProphet.
Figure 4.
Venn diagram of quality-filtered spectra. The three categories of questionable spectra (Impure, Conflicting ID, and Single) as determined by SpectraST are described in the Experimental Procedure Section.
Library Evaluation by Spectral Searching
One of the outstanding challenges in developing a method for spectral library building is the difficulty of assessing the quality of the resulting libraries, which are often too big for manual inspection. We propose that the quality of the libraries can be evaluated by the following two-step strategy. First, libraries are built from the sequence search results of a predefined set of datasets, employing different strategies such as those outlined above. Second, the same datasets are searched against the spectral libraries, and the spectral search results compared. The metric we use is the number of spectra identified at fixed false discovery rates. Given that all the identifiable peptide ions in those datasets are represented in the library, the performance of the spectral searches will be solely determined by the effectiveness of library building methods, free from the influence of incomplete library coverage. Naturally, a “better” library would allow the spectral search engine to better discriminate the correct and incorrect hits, resulting in a greater number of spectra identified at fixed false discovery rates. We therefore compare the search results against the 6 spectral libraries in Table 2 and summarize the results below.
A. Effect of Quality Level
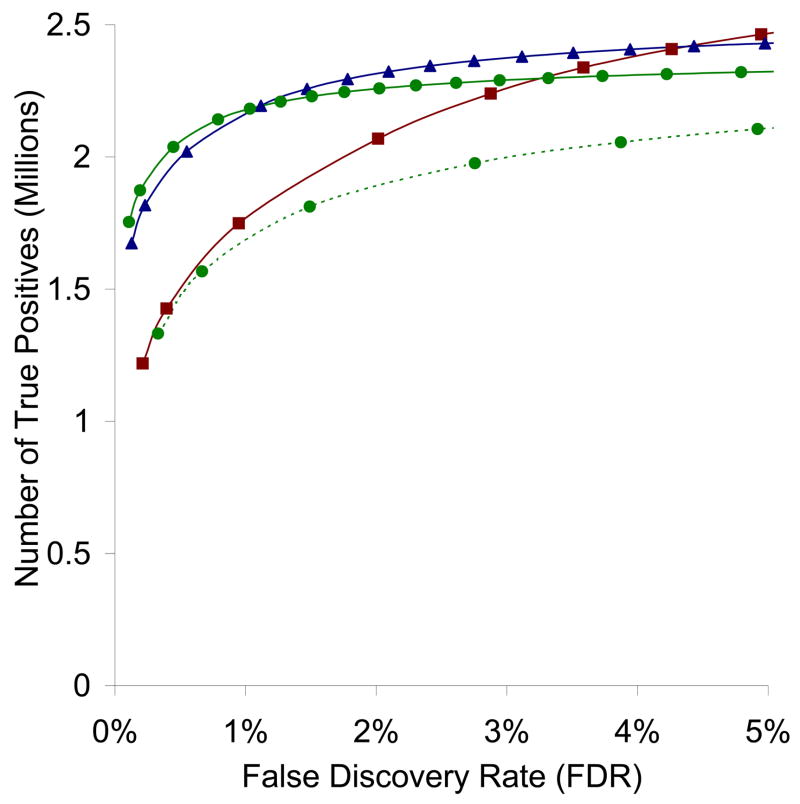
We observe a strong dependence on the quality level of the library. As shown in Figure 5, at a constant false discovery rate of 1%, the more stringent the quality level, the higher number of identified spectra, although the difference between quality levels Q1 and Q2 is very small. At first glance this may be counterintuitive, since the unfiltered library Q0 has the maximum coverage, and so should be able to match more spectra. However, if one factors in the confidence of the spectral match, the larger number of noisy and impure spectra in Q0 contributes to a higher background similarity score due to matching of noise peaks, resulting in diminished discriminating power.
Figure 5.
Receiver operator characteristic (ROC) curves for SpectraST searches against consensus spectral libraries of three different quality levels – Q0 (squares), Q1 (triangles), Q2 (circles, solid curve) and against a best-replicate spectral library Q2-BR (circles, dotted curve), of all 40 datasets used in the study, as estimated by PeptideProphet.
While we obtained the best performance with the most stringently filtered library Q2, we feel that a better balance between discriminating power and coverage can be found at the intermediate quality level Q1, which performs only slightly worse than Q2. In fact, removing all the singly observed spectra is perhaps too conservative, as this reduces the library size by over 40% and results in a significant loss of coverage. One can determine, by manual inspection, that a significant number of the singly observed spectra are actually correctly identified, and are observed only once probably due to the rarity of the peptide in the samples. The quality filters of SpectraST, therefore, allow the user to selectively retain these potentially interesting spectra while maintaining similar level of performance and discriminating power.
B. Consensus vs Best-Replicate
The use of so-called best-replicate libraries are previously proposed (13). This has the advantage of simplicity over consensus approaches. We therefore sought to compare the search results against the consensus spectral library (at quality level Q2) and those against the corresponding best-replicate library (Q2-BR). The two libraries contain exactly the same peptide ions; the former contains consensus spectra, and the latter the highest-quality (with highest signal-to-noise ratio) spectrum among the replicates observed for each peptide ion.
As shown in Figure 5, the sensitivity and false discovery rate of the search against Q2-BR is significantly inferior to that against Q2. This is in fact not surprising in light of the last two columns of Table 3, which show that the non-best individual replicates are generally more similar to the consensus spectrum than to the best replicate. In other words, the consensus spectrum is a truer representation of the characteristic fragmentation pattern of the peptide ion than the best replicate, which is still subject to experimental variations and other random artifacts. This is especially true when the number of replicates is small and none of them is of particularly good quality. Combining mediocre replicates to form a consensus spectrum, which removes noise and averages out experimental variations, is a much more robust strategy than selecting any of the replicates to include in the library.
C. Full versus Reduced Consensus Spectra
It has been proposed in previous attempts in spectral library building that the library spectra be simplified by retaining only a fixed maximum number of peaks (12). This has the benefits of smaller library size and quicker searches; however, some information that can potentially be used to aid discrimination will be lost. To study the effect of number of peaks retained, reduced libraries Q2-20p and Q2-50p from the consensus library Q2 are created by retaining the most intense 20 and 50 peaks, respectively, in each spectrum, and their performances in spectral searching compared.
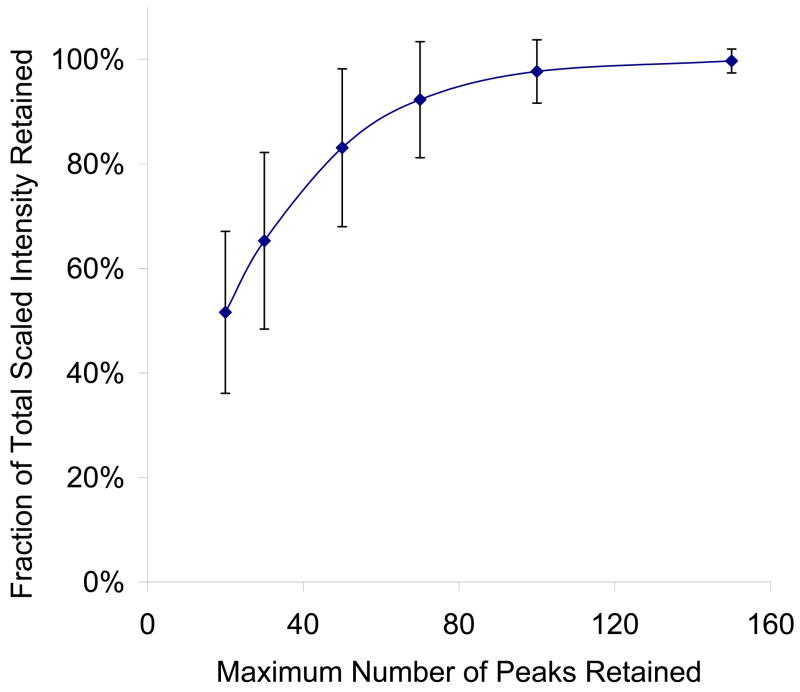
Figure 6 shows the proportion of total scaled intensity retained at different peak number cutoff, for the consensus library Q2. Because, in principle, all peaks included in the consensus spectrum are present in a majority of replicates, and there is no singly observed spectrum in Q2, one can assume that most, if not all, of the peaks included represent useful information about the expected fragmentation of the peptide ion. As shown, only about 50% of the total intensity is retained if 20 peaks are kept, and about 80% is retained if 50 peaks are kept. It takes about 100 peaks to retain over 95% of the total intensity. Therefore one expects some loss of discriminating power if we simplify spectra in this manner, and the question is if the loss is significant enough to cause a noticeable drop in performance.
Figure 6.
Average fraction of scaled intensity retained at different maximum number of peaks retained per library spectrum, across all spectra in the Q2 library. Scaled intensity is defined as the square root of the raw intensity; it is the measure used to calculate dot products during spectral searching (Ref 11). Error bars represent one standard deviation of values calculated for all spectra in the Q2 library.
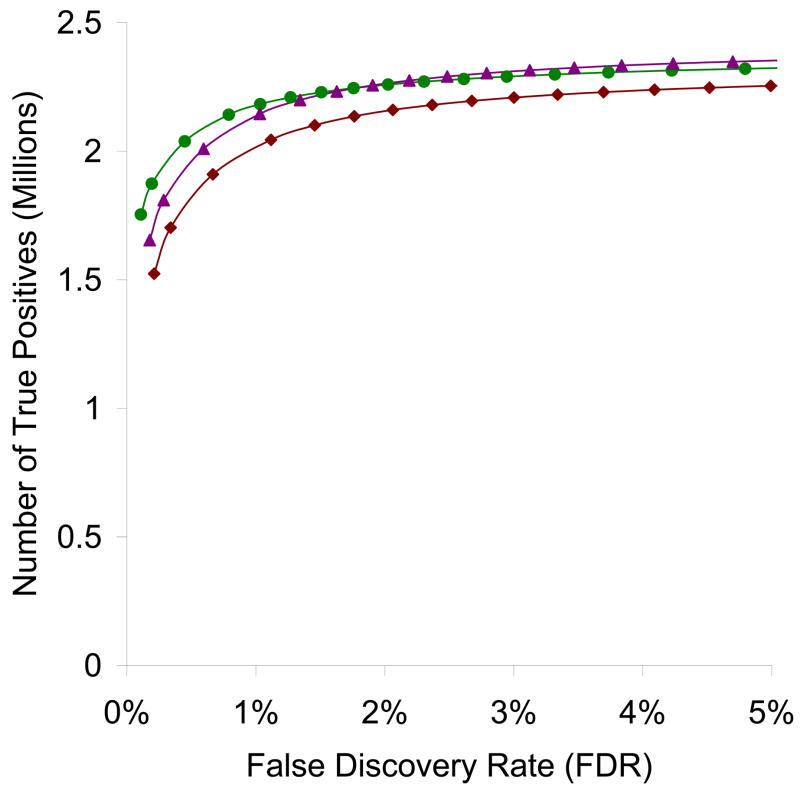
Figure 7 shows the ROC curves for the spectral searches against the libraries Q2, Q2-20p and Q2-50p. It is clear that Q2-20p suffers from a significant drop in performance, whereas Q2 and Q2-50p offer largely similar performance except at very stringent FDR cutoff. In examining the score histograms (not shown), we observed decreasing separation between the positive and negative distributions modeled by PeptideProphet for the search against Q2-20p. Therefore, it appears that reducing library spectra to only the top 20 peaks is an over-aggressive simplification. Keeping the top 50 peaks, on the other hand, seems to be acceptable for spectral searching purposes under the conditions studied. However, as with the NIST public libraries, we would still advocate maintaining the full spectra for the sake of completeness. In fact, the computational cost of using the full spectra is minimal, as we do not observe a significant speed gain with the reduced libraries, probably because reading and processing the library spectra is only performed once and represents a small fraction of the total search time.
Figure 7.
Receiver operating characteristic (ROC) curves for the 3 SpectraST searches illustrating the effect of library spectrum simplification, against consensus spectral libraries at three maximum number of peaks retained – Q2 (full spectra retained, circles), Q2-20p (top 20 peaks retained, diamonds), Q2-50p (top 50 peaks retained, triangles), of all 40 datasets used in the study, as estimated by PeptideProphet.
Discussion
We believe that spectral searching, with its many advantages already discussed elsewhere, is primed to take a prominent role in proteomics data analysis, especially in larger-scale studies of many repeated samplings, and targeted approaches in which is the researcher is actively looking for known targets in the sample. For these increasingly popular experiments, where discovery of novel peptides is not the goal, it makes sense to learn from the past. Spectral library building and searching is a straightforward and logical approach to take advantage of previous experiments to improve the efficiency and sensitivity of future data analyses.
We have developed an easy-to-deploy, open-source software toolkit, SpectraST, to enable proteomics researchers to integrate spectral library building and searching into their data analysis pipeline. SpectraST is an open-source program that allows the user to build spectral libraries in a variety of ways, and to utilize them to identify newly acquired spectra by spectral searching. We then proceeded to evaluate several library building strategies by a re-analysis of the Human Plasma PeptideAtlas datasets, totaling over 16 million spectra in 40 datasets, contributed by researchers from all over the world. Among our key findings is the importance of quality control, a critical aspect of spectral library building that, we believe, can be easily overlooked, for the naïve goal of the library builder is often to make the libraries as comprehensive as possible.
Lastly, we would like to emphasize again that while there are ongoing and rapidly progressing endeavors to build public, comprehensive spectral libraries, library building need not and should not be restricted to the experts. Because SpectraST, unlike competing tools for library building, takes special care to preserve the linkage between the library and the originating datasets, a spectral library built in this manner is simply a concise summary of previous experiments and their data analyses, and is a much more accessible and useful resource than the raw data files themselves. The easy-to-use software presented in this paper should enable smaller and more specialized research effort to build their own spectral libraries, and in doing so, better organize and condense huge amounts of largely unusable raw data into an easily retrievable manner for future reference and data analysis.
Acknowledgments
We are grateful to all the data contributors to PeptideAtlas, who have made this study possible. This study was supported in part with federal funds from the National Heart, Lung, and Blood Institute, National Institutes of Health, under contract No. N01-HV-28179.
Abbreviations
- Th
Thomson unit of mass-to-charge ratio (Da/e)
Footnotes
Publisher's Disclaimer: Disclaimer
Certain commercial equipment, instruments, or materials are identified in this paper in order to specify the experimental procedure adequately. Such identification is not intended to imply recommendation or endorsement by the NIST, nor it is intended to imply that the materials or equipment identified are necessarily the best available for this purpose.
References
- 1.Aebersold R, Mann M. Mass spectrometry-based proteomics. Nature. 2003;422:198–207. doi: 10.1038/nature01511. [DOI] [PubMed] [Google Scholar]
- 2.Sadygov RG, Cociorva D, Yates JR., III Large-scale database searching using tandem mass spectra: looking up the answer in the back of the book. Nat Methods. 2004;1:195–202. doi: 10.1038/nmeth725. [DOI] [PubMed] [Google Scholar]
- 3.Steen H, Mann M. The ABC’s (and XYZ’s) of peptide sequencing. Nat Rev Mol Cell Biol. 2004;5:699–711. doi: 10.1038/nrm1468. [DOI] [PubMed] [Google Scholar]
- 4.Eng JK, McCormack AL, Yates JR., III An approach to correlate tandem mass spectral data of peptides with amino acid sequences in a protein database. J Am Soc Mass Spectrom. 1994;5:976–989. doi: 10.1016/1044-0305(94)80016-2. [DOI] [PubMed] [Google Scholar]
- 5.Domon B, Aebersold R. Challenges and opportunities in proteomics data analysis. Mol Cell Proteomics. 2006;5:1921–1926. doi: 10.1074/mcp.R600012-MCP200. [DOI] [PubMed] [Google Scholar]
- 6.Patterson SD. Data analysis – the Achilles heel of proteomics. Nat Biotechnol. 2003;21:221–222. doi: 10.1038/nbt0303-221. [DOI] [PubMed] [Google Scholar]
- 7.Yates JR, III, Morgan SF, Gatlin CL, Griffin PR, Eng JK. Method to compare collision-induced dissociation spectra of peptides: potential for library searching and subtractive analysis. Anal Chem. 1998;70:3557–3565. doi: 10.1021/ac980122y. [DOI] [PubMed] [Google Scholar]
- 8.Domokos L, Hennberg D, Weimann B. Computer-aided identification of compounds by comparison of mass spectra. Anal Chim Acta. 1984;165:61–74. [Google Scholar]
- 9.Stein SE, Scott DR. Optimization and Testing of Mass Spectral Library Search Algorithms for Compound Identification. J Am Soc Mass Spectrom. 1994;5:859–866. doi: 10.1016/1044-0305(94)87009-8. [DOI] [PubMed] [Google Scholar]
- 10.Ausloos P, Clifton CL, Lias SG, Mikaya AI, Stein SE, Tchekhovskoi DV, Sparkman OD, Zaikin V, Zhu D. The critical evaluation of a comprehensive mass spectral library. J Am Soc Mass Spectrom. 1998;10:287–299. doi: 10.1016/S1044-0305(98)00159-7. [DOI] [PubMed] [Google Scholar]
- 11.Lam H, Deutsch EW, Eddes JS, Eng JK, King N, Stein SE, Aebersold R. Development and validation of a spectral library searching method for peptide identification from MS/MS. Proteomics. 2007;7:655–667. doi: 10.1002/pmic.200600625. [DOI] [PubMed] [Google Scholar]
- 12.Craig R, Cortens JC, Fenyo D, Beavis RC. Using annotated peptide mass spectrum libraries for protein identification. J Proteome Res. 2006;5:1843–1849. doi: 10.1021/pr0602085. [DOI] [PubMed] [Google Scholar]
- 13.Frewen BE, Merrihew GE, Wu CC, Noble WS, MacCoss MJ. Analysis of peptide MS/MS spectra from large-scale proteomics experiments using spectrum libraries. Anal Chem. 2006;78:5678–5684. doi: 10.1021/ac060279n. [DOI] [PubMed] [Google Scholar]
- 14.Liu J, Bell AW, Bergeron JJM, Yanofsky CM, Carrillo B, Beaudrie CEH, Kearney RE. Methods for peptide identification by spectral comparison. Proteome Sci. 2007;5:3. doi: 10.1186/1477-5956-5-3. [DOI] [PMC free article] [PubMed] [Google Scholar]
- 15.The NIST Library of Peptide Ion Fragmentation Spectra, June 2006 Version, along with detailed documentation, is freely available for download at PeptideAtlas (http://www.peptideatlas.org/speclib/) or ProteomeCommons (http://www.proteomecommons.org/). The library will be periodically updated.
- 16.Keller A, Eng J, Zhang N, Li XJ, Aebersold R. A uniform proteomics MS/MS analysis platform utilizing open XML file formats. Mol Syst Biol. 2005;1:17. doi: 10.1038/msb4100024. [DOI] [PMC free article] [PubMed] [Google Scholar]
- 17.Perkins DN, Pappin DJ, Creasy DM, Cottrell JS. Probability-based protein identification by searching sequence databases using mass spectrometry data. Electrophoresis. 1999;20:3551–3567. doi: 10.1002/(SICI)1522-2683(19991201)20:18<3551::AID-ELPS3551>3.0.CO;2-2. [DOI] [PubMed] [Google Scholar]
- 18.Craig R, Beavis RC. TANDEM: matching proteins with tandem mass spectra. Bioinformatics. 2004;20:1466–1467. doi: 10.1093/bioinformatics/bth092. [DOI] [PubMed] [Google Scholar]
- 19.Colinge J, Masselot A, Cusin I, Mahe E, Niknejad A, Argoud-Puy G, Reffas S, Bederr N, Gleizes A, Rey PA, Bougueleret L. High-performance peptide identification by tandem mass spectrometry allows reliable automatic data processing in proteomics. Proteomics. 2004;4:1977–1984. doi: 10.1002/pmic.200300708. [DOI] [PubMed] [Google Scholar]
- 20.Zhang N, Aebersold R, Schwikowski B. ProbID: a probabilistic algorithm to identify peptides through sequence database searching using tandem mass spectral data. Proteomics. 2002;2:1406–1412. doi: 10.1002/1615-9861(200210)2:10<1406::AID-PROT1406>3.0.CO;2-9. [DOI] [PubMed] [Google Scholar]
- 21.Pedrioli PG, Eng JK, Hubley R, Vogelzang M, Deutsch EW, Raught B, Pratt B, Nilsson E, Angeletti RH, Apweiler R, Cheung K, Costello CE, Hermjakob H, Huang S, Julian RK, Kapp E, McComb ME, Oliver SG, Omenn G, Paton NW, Simpson R, Smith R, Taylor CF, Zhu W, Aebersold R. A common open representation of mass spectrometry data and its application to proteomics research. Nat Biotechnol. 2004;22:1459–1466. doi: 10.1038/nbt1031. [DOI] [PubMed] [Google Scholar]
- 22.Keller A, Nesvizhskii AI, Kolker E, Aebersold R. Empirical statistical model to estimate the accuracy of peptide identifications made by MS/MS and database search. Anal Chem. 2002;74:5383–5392. doi: 10.1021/ac025747h. [DOI] [PubMed] [Google Scholar]
- 23.SpectraST is available as part of the Trans Proteomic Pipeline, for both LINUX and Windows, at http://tools.proteomecenter.org/software.php, and is continuously maintained and updated. Detailed instructions on how to use the software can be found at http://tools.proteomecenter.org/wiki/index.php?title=Software:SpectraST.
- 24.Deutsch EW, Eng JK, Zhang H, King NL, Nesvizhskii AI, Lin B, Lee H, Yi EC, Ossola R, Aebersold R. Human Plasma PeptideAtlas. Proteomics. 2005;5:3497–3500. doi: 10.1002/pmic.200500160. [DOI] [PubMed] [Google Scholar]
- 25.Desiere F, Deutsch EW, Nesvizhskii AI, Mallick P, King NL, Eng JK, Aderem A, Boyle R, Brunner E, Donohoe S, Fausto N, Hafen E, Hood L, Katze MG, Kennedy KA, Kregenow F, Lee H, Lin B, Martin D, Ranish JA, Rawlings DJ, Samelson LE, Shiio Y, Watts JD, Wollscheid B, Wright ME, Yan W, Yang L, Yi EC, Zhang H, Aebersold R. Integration with the human genome of peptide sequences obtained by high-throughput mass spectrometry. Genome Biol. 2004;6:R9. doi: 10.1186/gb-2004-6-1-r9. [DOI] [PMC free article] [PubMed] [Google Scholar]
- 26.Desiere F, Deutsch EW, King NL, Nesvizhskii AI, Mallick P, Eng J, Chen S, Eddes J, Loevenich SN, Aebersold R. The PeptideAtlas project. Nucleic Acids Res. 2006;34:D655–D658. doi: 10.1093/nar/gkj040. [DOI] [PMC free article] [PubMed] [Google Scholar]
- 27.Omenn GS, States DJ, Adamski M, Blackwell TW, Menon R, Hermjakob H, Apweiler R, Haab BB, Simpson RJ, Eddes JS, Kapp EA, Moritz RL, Chan DW, Rai AJ, Admon A, Aebersold R, Eng J, Hancock WS, Hefta SA, Meyer H, Paik Y, Yoo J, Ping P, Pounds J, Adkins J, Qian X, Wang R, Wasinger V, Wu CY, Zhao X, Zeng R, Archakov A, Tsugita A, Beer I, Pandey A, Pisano M, Andrews P, Tammen H, Speicher DW, Hanash SM. Overview of the HUPO Plasma Proteome Project: Results from the pilot phase with 35 collaborating laboratories and multiple analytical groups, generating a core dataset of 3020 proteins and a publicly-available database. Proteomics. 2005;5:3226–3245. doi: 10.1002/pmic.200500358. [DOI] [PubMed] [Google Scholar]
- 28.Qian W, Monroe ME, Liu T, Jacobs JM, Anderson GA, Shen Y, Moore RJ, Anderson DJ, Zhang R, Calvano SE, Lowry SF, Xiao W, Moldawer LL, Davis RW, Tompkins RG, Camp DG, II, Smith RD. Quantitative proteome analysis of human plasma following in vivo lipopolysaccharide administration using 16O/18O labeling and the accurate mass and time tag approach. Mol Cell Proteomics. 2005;4:700–709. doi: 10.1074/mcp.M500045-MCP200. [DOI] [PMC free article] [PubMed] [Google Scholar]
- 29.Information about the Novartis-GeneProt datasets can be found in: Armandola, E. A. (2003) Proteome profiling in body fluids and in cancer cell signaling. From Medscape General Medicine (http://www.medscape.com/viewarticle/455452).
- 30.Whiteaker JR, Zhang H, Eng JK, Fang R, Piening BD, Feng L, Lorentzen TD, Schoenherr RM, Keane JF, Holzman T, Fitzgibbon M, Lin C, Zhang H, Cooke K, Liu T, Camp DG, II, Anderson L, Watts J, Smith RD, McIntosh MW, Paulovich AG. Head-to-head comparison of serum fractionation techniques. J Proteome Res. 2007;6:828–836. doi: 10.1021/pr0604920. [DOI] [PubMed] [Google Scholar]
- 31.Kersey PJ, Duarte J, Williams A, Karavidopoulou Y, Birney E, Apweiler R. The International Protein Index: An integrated database for proteomics experiments. Proteomics. 2004;4:1985–1988. doi: 10.1002/pmic.200300721. [DOI] [PubMed] [Google Scholar]
- 32.Nesvizhskii AI, Keller A, Kolker E, Aebersold R. A statistical model for identifying proteins by tandem mass spectrometry. Anal Chem. 2003;75:4646–4658. doi: 10.1021/ac0341261. [DOI] [PubMed] [Google Scholar]


