

Abstract
A new class of multifunctional nanoparticles that combine properties of polymeric drug carriers, ultrasound imaging contrast agents, and enhancers of ultrasound-mediated drug delivery has been developed. At room temperature, the developed systems comprise perfluorocarbon nanodroplets stabilized by the walls made of biodegradable block copolymers. Upon heating to physiological temperatures, the nanodroplets convert into nano/microbubbles. The phase state of the systems and bubble size may be controlled by the copolymer/perfluorocarbon volume ratio. Upon intravenous injections, a long-lasting, strong and selective ultrasound contrast is observed in the tumor volume indicating nanobubble extravasation through the defective tumor microvasculature, suggesting their coalescence into larger, highly echogenic microbubbles in the tumor tissue. Under the action of tumor-directed ultrasound, microbubbles cavitate and collapse resulting in a release of the encapsulated drug and dramatically enhanced intracellular drug uptake by the tumor cells. This effect is tumor-selective; no accumulation of echogenic microbubbles is observed in other organs. Effective chemotherapy of the MDA MB231 breast cancer tumors has been achieved using this technique.
Keywords: Nanobubbles, cavitation, collapse, coalescence, contrast-enhanced ultrasonography, targeted chemotherapy
Introduction
All energy-based tumor treatment modalities, including thermal treatments, require prior imaging. The field of thermal tumor therapy has advanced rapidly, particularly for high intensity focused ultrasound (HIFU), which causes tumor ablation by coagulative necrosis of tumor tissue. Some other clinical applications of thermal therapy such as adjuvant hyperthermia with radiation therapy, drug and gene delivery, or coagulation of tumor blood vessels can be envisioned [1].
For most systems, MRI remains the imaging modality of choice due to the possibility of combining tumor imaging with MRI thermometry, which would eventually allow development of feedback treatment control systems; MRI imaging is used for example, in the ExAblate® 2000 (InSightec, Israel) system for the treatment of uterine fibroids. However, the possibility for combining diagnostic and therapeutic ultrasound for tumor imaging and treatment appears more attractive, for reasons of simplicity, time and cost-effectiveness. Dual-modality ultrasound imaging-treatment systems have recently entered the market (e.g. Ablatherm (EDAP, Lyon, France); and Sonablate (Focus Surgery, Indianapolis, Indiana) for treating prostate cancer; HIFU JC Tumor Therapy System (Chongqing HIFU Technology, Chongqing, China) for treating a vide variety of tumors); a miniature ultrasound-based dual-modality device for image guided soft tissue ablation (Guided Therapy Systems, Mesa, Arizona) and some other instruments are in the development stage.
However, ablative techniques present a number of problems related to the precise control of heat deposition. Patient motion and breathing during the treatment are also problematic. Currently, long treatment times, incomplete treatment of large targets, a non-uniform thermal dose distribution, and unintended normal tissue damage continue to impede broad penetration of HIFU therapies into clinical practice.
Here, we describe a therapeutic technique that utilizes non-thermal mechanisms of ultrasound interaction for targeted drug delivery and tumor imaging. This technique may rely on the same instruments that are used for HIFU, but driven at substantially lower ultrasound energies. In addition, thermal treatment and ultrasound-mediated drug delivery may complement each other because drug delivery works well in the highly perfused regions of a tumor (generally the periphery), while HIFU can destroy a poorly perfused tumor core. Again, tumor imaging prior to treatment is a crucial element of the proposed technique.
Contrast-enhanced ultrasonic tumor imaging is still in its infancy. Development of ultrasound contrast agents and the concomitant use of harmonic ultrasound imaging has made possible imaging of liver [2], breast, [3], and prostate tumors [4]. Recently, ultrasound-stimulated acoustic emission of microbubbles has been used for color Doppler imaging of liver metastases [5]. Polymeric ultrasound contrast agents with targeting potential have been explored by the Wheatley group [6 – 9]. Molecularly targeted microbubbles have been successfully used for the ultrasonic imaging of angiogenesis [10 – 16]. Bubble targeting using ultrasound radiation force has also been developed [17 – 20].
Combining contrast-enhanced ultrasound tumor imaging with targeted drug delivery is a challenging task; drug loading onto lipid-coated microbubbles has been investigated for this purpose [21 – 23]. We have recently developed novel ultrasound-sensitive multifunctional nanoparticles composed of nanoscale polymeric micelles that function as drug carriers and nano-or micro-scale echogenic bubbles that combine the properties of drug carriers, enhancers of the ultrasound-mediated drug delivery, and long-lasting ultrasound contrast agents [24, 25]. Drug carrying, tumor-targeting, and retention in the tumor volume are functions of the micelles and/or nanobubbles; ultrasound contrast properties are provided by the microbubbles formed in a tumor volume by the coalescence of nanobubbles. The structure and properties of these systems are discussed below.
Materials and Methods
Block copolymers
Biodegradable diblock copolymers poly(ethylene oxide)-block-poly(L-lactide) (PEG-PLLA) and poly(ethylene oxide)-block- poly(caprolactone) (PEG-PCL) in which the molecular weight of either block was 2000 D were bought from JCS Biopolytech Inc., Toronto, Ontario, Canada.
Nanoemulsion Preparation
Perfluoropentane (PFP) nanoemulsions dispersed in a solution of polymeric micelles were produced by introducing an aliquot of a sterilized PFP into a micellar solution of a copolymer in sterilized plastic test tubes that were immersed in a sonication bath (cup-horn installation, Sonics, Newtown, CT); the samples were sonicated for 60 s by 20-kHz ultrasound at about 0.9 MPa acoustic pressure, which was above the cavitation threshold for 20-kHz ultrasound as determined by a high broadband noise level. Initially, sonication was performed at room temperature. Later, the samples were sonicated in ice-cold water to reduce foam formation. Preliminary data showed that extending sonication time beyond 60 s did not change the properties of the micelle/nanoemulsion systems produced. Due to sterility requirements, the preparation of drug-loaded nanoemulsion proceeded in three steps. In the first step, drug was loaded into micelles (see below); the micellar solutions were then sterilized by filtration through 200 nm filters. In the second step, liquid perfluorocarbon was sterilized by filtration and an aliquot of sterilized perfluorocarbon was added to the sterilized solution of drug-loaded micelles. In the third step, the mixture was sonicated by externally applied 20-kHz ultrasound to produce nano- or microemulsions. The nanoemulsion droplets are heavier than water and precipitate to the bottom of the test tube (in contrast to Optison® microbubbles, which float). Therefore, before taking an aliquot of a nanoemulsion sample, it was stirred extensively by pipetting.
Micelles (empty or drug-loaded) were formed using a solvent exchange technique. Copolymer (PEG-PLLA or PEG-PCL) with or without doxorubicin (DOX) was dissolved in dimethylsulfoxide or tetrahydrofurane, and the solution was dialyzed through a membrane with a molecular weight cutoff of 3000 D (Spectra/Por, Spectrum Medical Industries, Inc., CA) against PBS to form micelles. The copolymer concentration in the micelle preparations ranged from 0.1% to 1.0%. In the drug uptake and biodistribution experiments, the copolymer concentration was 5 mg/ml (i.e. 0.5%) and DOX concentration was 0.75 mg/ml. For fluorescence microscopy, a DOX concentration of 50 g/ml was used. The final DOX concentration in the micelles was measured by HPLC.
Measurement of nanoparticle size distribution
The measurement of particle size distribution was based on dynamic light scattering at an angle of 90° using a Malvern Zetasizer 3000 HSA instrument equipped with a 633 nm helium/neon laser and a temperature controller (Malvern Instruments, Inc. Southboro, MA). Measurements were performed at room temperature and at a physiological temperature range for various combinations of copolymer and PFP concentrations. The instrument allowed measurement of a particle size distribution in the range of 20 nm to 3 µm; microparticles larger than 3 µm could escape registration. However, visual monitoring of the samples at room temperature using an inverted microscope and haemocytometer (model 3200, Hauser Scientific, Horsham, PA) indicated very small (if any) number of microdroplets larger than 3 µm. A haemocytometer was also used for measuring mean microdroplet concentration.
Optical and Fluorescence imaging
For visual monitoring of nanodroplet and microbubble behavior, the formulations were placed in the closed plastic capillaries (internal diameter of 340 µm) of snake mixer slides (XXS, Zweibrucken, Germany) and examined using a Nikon Fluophot fluorescence microscope (Nikon USA, Melville, NY, USA) equipped with a sample heating stage TCS-100 (AmScope, Chino, CA, USA) that provided for sample heating up to 50 °C.
Sonication
Two types of ultrasound transducers were used. Unfocused 1-MHz or 3-MHz ultrasound beams were generated using an Omnisound 3000 system (Accelerated Care Plus Inc., Sparks, NV) equipped with a 1 cm2 piezoceramic crystal and 5 cm2 transducer head. Focused 1.1-MHz or 3.3-MHz ultrasound was generated using a submersible focused piezoceramic transducer (model H-101 S/N-29, Sonic Concepts, Woodinville, WA).
Monitoring of Cavitation Activity
The microbubble formulation was placed in Samco polyethylene transfer pipette (5 mm i.d., 0.3 mm wall thickness, and 1.5 cm height, Fisher Scientific, Pittsburg, PA). Using a three-way micropositioner (Velmex, Bloomfield, NY), the transfer pipette was positioned within the focal zone of the focusing transducer. The transducer was submerged in an open glass tank (31 × 28 × 51 cm.) containing approximately 20 L of filtered distilled water maintained at room temperature (23–24 °C) or 37 °C. To minimize possible standing wave formation, a 2.5-cm thick rubber liner was mounted opposite the transducer. A sinusoidal waveform of 1.1-MHz frequency was generated by a programmable generator (model F33, Interstate Electronics Corporation, Anaheim, CA), triggered by a function generator (model 3314A, Hewlett Packard, Loveland, CO). The signal was amplified by a power amplifier (model 240L, Electronic Navigation Industries, Rochester, NY). Ultrasound pressure was varied by altering the amplitude of the drive signal to the transducer.
For measurement of the ultrasound energy, the negative pressure (P) was measured at the focal site of the transducer using a piezoceramic needle hydrophone with diameter 1.5 mm (model TNU100A, NTR Systems, Seattle, WA). With the focused beam, the sonication volume was more than order of magnitude smaller than the total volume of the sample (400 µl); however, ultrasound-induced microstreaming caused sample stirring, which somewhat reduced non-uniformity of the sonication throughout the sample volume.
For measuring the cavitation intensity in the unfocused ultrasound beam, the Omnisound 3000 transducer probe was positioned at a distance of 1 cm from the hydrophone immersed in a water tank at 37 °C, and the acoustic pressure was measured; the hydrophone was then replaced with the sample in a Samco transfer pipette, as described above for the experiments with the focusing transducer.
To monitor possible generation of harmonic frequencies, signals recorded by the hydrophone positioned at the distance of 1 cm behind the sonicated sample were Fourier-transformed.
The cavitation intensity was characterized according to a micelle/microbubble volume ratio as described in the text.
The drug-loaded sonicated samples were dialyzed against PBS in order to study if the drug that is released upon microbubble collapse remains free in solution or is re-encapsulated by the reformed micelles. The DOX dialysis rates were compared to those of free DOX and micelle-encapsulated DOX.
Animal Procedures
Four to six week old nu/nu mice were bought from Charles River (Wilmington, MA). Animals were housed in accordance with the Guide for the Care and Use of Laboratory Animals adopted by the National Institutes of Health.
Breast cancer MDA MB231 or ovarian cancer A2780 cells suspended in 100 µl serum-free RPMI 1640 medium were inoculated subcutaneously to the flanks of unanaesthetized mice (2 × 10⁶ cells per mouse).
Measurement of Intracellular Drug Uptake
The MDA MB231 breast cancer or A2780 ovarian carcinoma cell suspensions were placed in Samco polyethylene transfer pipettes filled with 400 µl micellar or nanoemulsion DOX formulation. The transfer pipettes were placed in the water tank maintained at 37 °C as described above for the measuring of cavitation activity. Ultrasound was generated by Omnisound 3000 transducer probe positioned at a distance of 1 cm of the sample. The samples were incubated from 15 min to 45 min at 37 °C in the appropriate formulation prior to ultrasound application. “Sham” control exposures were conducted using the same protocol, but no ultrasound was applied.
Ten minutes after the completion of sonication, the cells were separated by centrifugation, washed with cold PBS, and fixed with 2.5% glutaraldehyde. After filtration through nylon mesh, cell fluorescence was measured by flow cytometry (FACSCAN, Becton Dickinson). It has been shown in control experiments that the intracellular DOX fluorescence was proportional to the intracellular DOX uptake (4). Note that the flow cytometry does not provide absolute fluorescence values; the measured value for the same sample may vary from day to day due to the variations in the instrument setting and sensitivity. Therefore flow cytometry histograms for a particular series of samples were recorded on the same day with the same instrument settings.
Measurement of drug distribution and tumor growth in vivo
All animal experiments were performed in accordance with the guidelines of the Institutional Animal Care and Use Committee of the University of Utah (Protocol 05-01002). MDA MB231 breast cancer tumors were grown in nu/nu mice by subcutaneous inoculation of 2×10⁶ cells. Drug distribution experiments were performed when tumors reached a size of about 500 mm3. A micellar or nanoemulsion DOX formulation was injected intravenously into the mouse tail vein at a DOX dose of 3 mg/kg. Four hours after the injection, tumors were sonicated with unfocused 3-MHz ultrasound at 2 W/cm2 SATA power density and 20% duty cycle with a 2-ms burst for a total of 150 s to produce a total ultrasound exposure of 30 s; ultrasound was applied to the tumor through Aquasonic coupling gel (Parker Laboratories, INC. Orange, N.J.). “Sham” exposures were conducted using the same protocol, but no ultrasound was applied.
Ten minutes after the completion of sonication, tumors and other organs (heart, liver, and kidney) of all mice were excised, cut into small pieces, trypsinized to produce individual cells and treated as described above for the in vitro experiments into intracellular drug uptake.
Ultrasound imaging
Imaging experiments were performed in vivo using a 14-MHz linear transducer (Acuson Sequoia 512) on MDA MB231 breast cancer or A2780 ovarian cancer bearing mice; the microbubble formulations were injected intravenously or intratumorally (injection volume was 100 µl or 200 µl, concentration of microbubbles as counted on a haemocytometer 108 to 109/ml; since only microbubbles could be counted using an optical microscope, the actual total concentration of injected micro- and nanobubbles may have been much higher).
Results
Phase diagrams of the micelle/microbubble systems
The phase state of the designed systems at room temperature was evaluated for two biodegradable micelle-forming copolymers, PEG-PLLA and PEG-PCL, for various copolymer/PFP concentrations and concentration ratios. The phase diagram is presented schematically in Figure 1. The three zones in the phase diagram along the direction of increasing PFP concentration correspond to: zone (1) - micelles only (no nanodroplets); PFP is dissolved in the micelle cores; zone (2) – micelles coexist with nano- or microdroplets; and zone (3) – nanodroplets only (no micelles). Depending on the copolymer/PFP ratio, zone (3) may be characterized by a mono- or bimodal droplet size distribution. For a bimodal distribution, “small” nanodroplets(ø ≤250 nm) co-exist with “large” nanodroplets (ø ≥750 nm); for a monomodal distribution, only small (hundreds of nanometer scale) or “large” (1 to 3 µm) droplets are formed. At a fixed copolymer concentration that is above the critical micelle concentration (CMC), the following phase transitions proceed with increasing PFP concentration: zone (1) → zone (2) → bimodal zone (3) → monomodal zone (3). The size and number of nanodroplets may be controlled by a copolymer/PFP ratio. As a general rule, for a fixed PFP concentration, the higher the copolymer concentration, the smaller the droplet sizes; for a fixed copolymer concentration, the higher the PFP concentration, the larger the droplet sizes. Our data show that upon introduction of PFP into the micellar copolymer solution and system sonication, some copolymer molecules are transferred from the micelles onto the droplet surface to form droplet walls, which results in gradual micelle degradation (this corresponds to zone 2). At some PFP/copolymer ratio, all copolymer molecules are used for droplet stabilization and micelles are completely destroyed (zone 3, first monomodal part corresponding to small droplets). With further increasing PFP concentration, larger droplets (i.e. microdroplets) start being formed in order to decrease the surface-to-volume ratio; at some PFP/copolymer ratios, only large microdroplets can be formed due to the lack of the stablizing copolymer. An example of a phase state and particle size distribution for a PEG-PLLA system at a number of copolymer and PFP concentrations is shown in Table 1. Note that for the PEG-PLLA/PFP system, micelles and droplets coexist in a narrow range of copolymer/PFP concentrations and only at a copolymer concentration of 1.0% (Table 1).
Figure 1.

Schematic representation of a phase diagram of a micelle/nanoemulsion system at room temperature. Zone 1 – micelles with dissolved perfluoropentane (PFP); zone 2 – coexistence of micelles and nanodroplets; zone 3 – nanodroplets only.
Table 1.
Effect of a PEG-PLLA and PFP concentration on the formulation phase state and droplet sizes (micelles are shown in bold fonts; volume fractions are shown in parentheses). Note that the number fraction of particles is proportional to the volume fraction divided by D3, where D is a particle diameter. Therefore a high volume fraction of large droplets may correspond to a small number of the droplets in the formulation; also, presence of large droplets in the formulation may “mask” the presence of micelles; therefore the presence or absence of micelles have been verified by number fraction values.
| Copolymer Concentration | PFP Concentration | Micelle/Droplet Coexistence |
Particle Type and Size |
|---|---|---|---|
| 0.2% | 0.1% | No | Droplets 450 nm and 1509 nm |
| 0.5% | No | Droplets 454 nm / 1750 nm | |
| 1.0% | No | Droplets 451 nm / 2147 nm | |
| 0.5% | 0.1% | No | Droplets 110 nm and 440 nm |
| 0.5% | No | Droplets 170 nm and 540 nm | |
| 1.0% | No | Droplets 250 nm and 1328 nm | |
| 1.0% | 0.1% | Yes | Micelles 22.8 nm (87%) and 70.2 nm (3.7%) and droplets 277 (1.2%) and1236 nm (8.1%) |
| 0.5% | Yes | Micelles 24.0 nm and droplets 400–900 nm | |
| 1.0% | No | Droplets 226 nm and 834 nm |
For therapeutic applications, the micelle/nanodroplet coexistence range (zone 2) and nanodroplet-comprising part of zone 3 appear the most useful because drug-loaded micelles and small nanobubbles are expected to extravasate through the defective tumor microvasculature and accumulate in the tumor interstitium as shown schematically in Figure 2. Bubble accumulation results in strong ultrasound contrast in tumor ultrasonography. After the completion of ultrasound imaging, the application of therapeutic ultrasound to the tumor triggers drug release from the micelles and bubbles, thus providing for localized drug internalization by tumor cells. Thus, injection of drug-loaded formulations provides the potential for combining ultrasound tumor imaging with ultrasound-mediated targeted chemotherapy.
Figure 2.

Schematic representation of a drug targeting through the defective tumor microvasculature using an echogenic drug delivery system. The system comprises polymeric micelles (small circles), nanobubbles (stars), and microbubbles (large circles). Micelles are formed by a biodegradable block copolymer (e.g., PEG-PLLA or PEG-PCL); bubbles are formed by perfluorocarbon (e.g., perfluoropentane) stabilized by the same biodegradable block copolymer. Lipophilic drug (e.g., doxorubicin) is localized in the micelle cores and the walls of nano/microbubbles. Tight junctions between endothelial cells in blood vessels of normal tissues not allow extravasation of drug-loaded micelles or nano/microbubbles (indicated by cross ). In contrast, tumors are characterized by defective vasculature with large gaps between the endothelial cells, which allow extravasation of drug-loaded micelles and small nanobubbles, resulting in their accumulation in the tumor interstitium. On accumulation in the tumor tissue, small nanobubbles coalesce into larger, highly echogenic microbubbles that release their drug load in response to therapeutic ultrasound.
Nanodroplet/microbubble conversion upon heating to physiological temperatures
Upon heating to physiological temperatures, nanodroplets are converted into larger nanobubbles due to the vaporization of PFP inside the bubble walls (Figure 3). The initial nanodroplets or nanobubbles were not resolved at the x100 magnification that was the maximum available for our fluorescence microscopy system (Figure 4A). In addition to reversible nanodroplet/nanobubble conversion, a small number of microbubbles were formed irreversibly at 37 °C through coalescence of nanobubbles (Figure 4B). Sample overheating to hyperthermia temperatures (44 °C or higher) resulted in a significant coalescence of the nanobubbles into larger microbubbles whose size and number increased with time (Figure 4C); this effect was irreversible, as shown in the sequence of photographs presented in Figure 4 C – F.
Figure 3.

Nanodroplet/microbubble conversion on heating of the 1% PEG-PLLA/0.5% PFP system to 42 °C for 5 min; the nanodroplets (691 nm) converted into microbubbles (1.24 µm). The effect was reversible; upon cooling to room temperature, the initial size distribution shown in panel (A) was restored.
Figure 4.

Optical images of a 0.75 mg/mL Dox/0.5% PEG-PLLA/2% perfluoropentane (PFP) formulation placed in a closed plastic capillary (internal diameter 340 mm) of a snake mixer slide (XXS). The sample was visualized during a heating/cooling/heating cycle using a heating stage (AmScope, Chino, CA) and a Nikon Fluophot fluorescence microscope (Nikon USA, Melville, NY). (A) - At 26 °C, nanodroplets of the initial 0.5%PEG-PLLA/2% PFP formulation were not resolved at the highest available magnification (x100). (B and C) - Upon heating to 37 °C (B) and 50 °C (C), larger bubbles grew by attraction and coalescence of small bubbles. (D) - After cooling back to room temperature, the initial sample structure was not restored; a large number of small microdroplets were formed through disintegration of large microbubbles and PFP condensation. (E and F) - During a second heating step to 37 °C and 50 °C, respectively, the growth of large microbubbles through the attraction and coalescence with small microbubbles was manifested by a progressive decrease in the number of small microbubbles.
Large microbubbles, formed under hyperthermic conditions may potentially be useful for localized occlusion of tumor blood vessels.
Cavitation Effects
In the context of drug delivery and tumor therapy, inducing localized cavitation in the tumor volume is desirable because it triggers drug release from carriers and perturbs cell membranes thus considerably enhancing the intracellular drug uptake. Based on our earlier experience, drug release from micelles starts below the inertial cavitation threshold but is substantially increased by inertial cavitation (25, 26).
For the systems investigated here, under some ultrasound conditions, sonication induced collapse of the microbubbles, resulting in a release of the bubble-stabilizing copolymer molecules and their self-assembly into micelles. This resulted in a decrease of the microbubble volume fraction and an increase of the micelle volume fraction as illustrated in Figure 5 for PEG-PCL stabilized nanoparticles. Therefore the micelle/microbubble volume ratio may serve as an indicator of the inertial cavitation activity in the systems. In the experiments performed at different ultrasound pressures, using systems that were initially composed exclusively of nano- or microdroplets, the onset of the generation of visible oscillating bubbles coincided with the appearance of higher harmonics (Figure 6). The following sequence of events was anticipated: upon heating from room temperature to 37 °C, overheated nano- and microdroplets and nano- and microbubbles were formed; at some critical ultrasound pressure, the overheated nano- and microdroplets converted into microbubbles due to acoustic droplet vaporization [27, 28]. The microbubbles oscillated in the ultrasound field thus generating higher harmonics. The acoustic pressure that resulted in the onset of higher harmonics depended on bubble size and the type of the bubble stabilizing copolymer. Some microbubbles collapsed in the ultrasound field, resulting in the micelle formation. In addition to microbubble collapse, ultrasound also induced bubble coalescence into larger microbubbles (Figure 5). The ratio between microbubble collapse and coalescence depended on ultrasound frequency, power density, and type of a bubble-stabilizing copolymer. Lower power densities and a lower frequency (i.e. 1 MHz vs. 3 MHz) favored bubble coalescence over collapse (data not shown). Under equivalent ultrasound conditions, the bubbles stabilized by a PEG-PLLA copolymer exhibited a more pronounced coalescence compared to bubbles stabilized by a PEG-PCL copolymer. For studied copolymers, bubble collapse and micelle formation at 37 °C was greater for 3-MHz compared to 1-MHz ultrasound at the same acoustic pressure; this was true for both copolymers. Therefore 3-MHz ultrasound was chosen for the studies of the ultrasound effects on the intracellular drug uptake and in vivo chemotherapy.
Figure 5.

Nanobubble collapse (manifested by micelle formation) and coalescence (manifested by increase of bubble size) induced by CW focused 3.3-MHz ultrasound. The 1% PEG-PCL/2.5% PFP formulation was sonicated for 5 min at 2.4 MPa negative pressure at 37 °C.
Figure 6.
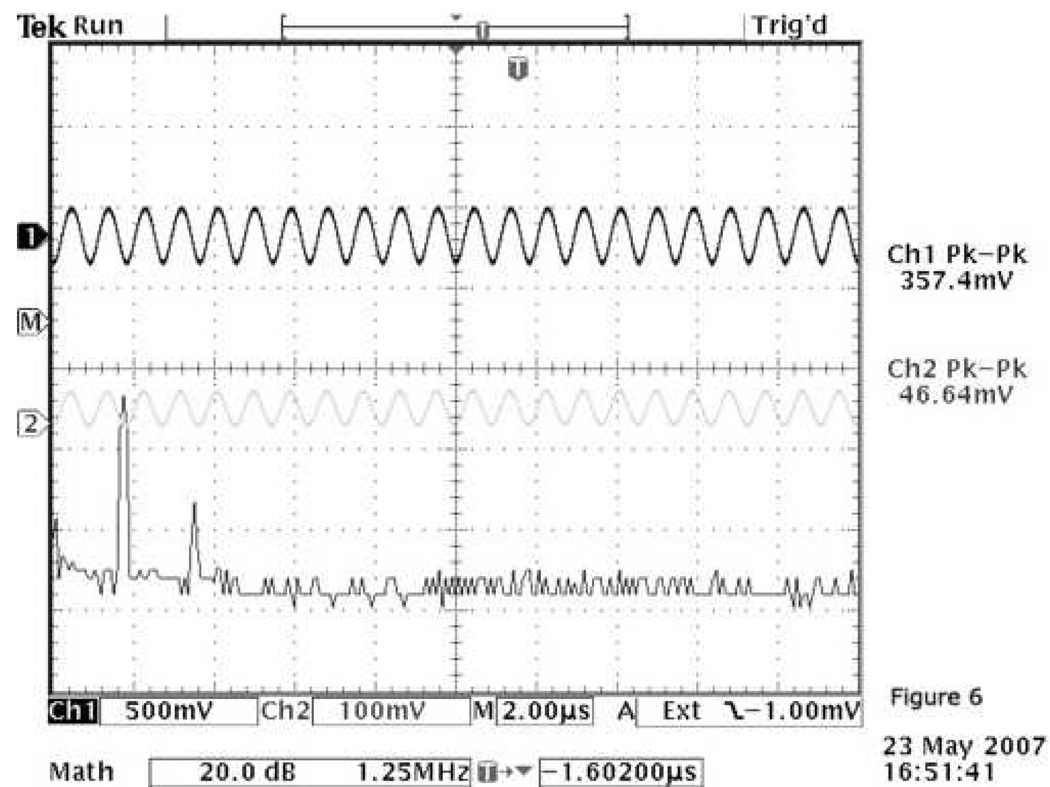
Generation of a second harmonic as shown on the oscilloscope screen; 1% PEG-PCL/ 2.5% PFP formulation was sonicated for 5 min by CW focused 1.1-MHz ultrasound at 2.63 MPa negative pressure. The generation of a second harmonic coincides with the appearance of visible bubble oscillation. The channel 2 and channel 1 voltages on the screen correspond to the input voltage and that measured by the hydrophone placed I cm behind the sonicated sample, respectively.
For contrast-enhanced ultrasound imaging, nanobubble coalescence into hyperechoic microbubbles is an advantageous phenomenon; on the other hand, for the drug delivery application, microbubble collapse under the action of ultrasound would be preferred (see below). Mixing PEG-PLLA and PEG-PCL stabilized bubbles may be advantageous for the anticipated imaging/chemotherapy application. This requires further investigation.
Bubble stability upon heating to physiological temperatures
While some nanobubble coalesced into larger microbubbles at physiological temperatures, the remaining nanobubbles showed remarkable size stability; mean bubble size change in the nanoscale region was less than 15% (770±86 nm in the initial sample and 674±72 nm after heating for 4 hours at 37°C). Long-term preservation of the nanobubbles at physiological temperatures is a very important feature that is required for bubble accumulation in tumor tissue.
Nano/microbubbles as ultrasound-responsive drug delivery agents
In the nanobubbles, the drug (doxorubicin, Dox) was localized in the bubble wall formed by the stabilizing copolymer, as indicated by fluorescence imaging (Figure 7A). When bubbles were incubated with the cells at 37 °C without the application of ultrasound, no decrease of bubble fluorescence or increase of cell fluorescence was observed, thus indicating strong drug retention by the microbubble wall. The application of ultrasound resulted in a decrease of bubble fluorescence and increase of cell fluorescence (Figure 7B) indicating drug transfer from the bubbles to the cells.
Figure 7.

Fluorescence images of the 0.75 mg/mL Dox/0.5% PEG-PLLA/2% perfluoropentane (PFP) formulation placed in a plastic capillary (internal diameter 340 mm) of a snake mixer slide. (A) The formulation was heated to 46 °C to generate visible microbubbles; the doxorubicin-derived fluorescence (red) of the microbubbles was localized in the bubble walls formed by the bubble-stabilizing copolymer. (B) The MDA MB231 cells incubated with DOX-loaded microbubbles at 37°C did not fluoresce during 30-minute incubation (data not shown). Under the action of ultrasound, the cells (shown by a thick arrow) acquired strong fluorescence while the fluorescence of microbubbles (indicated by thin arrow) was substantially decreased; 3-MHz unfocused ultrasound was applied to the slide through the Aquasonic coupling gel for 150 seconds at a 2 W/cm2 nominal SATA power density and a 20% duty cycle (the actual power density experienced by the sample may be different from the nominal because the sonication took place in the ultrasound near field). The data indicate that without ultrasound, DOX was strongly retained in microbubble walls; however, under the ultrasonic action DOX was released from the bubbles and internalized by the cells.
For a wide variety of tumor samples and ultrasound parameters, the ultrasound-mediated intracellular drug uptake was substantially enhanced in the presence of microbubbles compared to that of micelles; the effect of the microbubbles was statistically significant [25]. A typical example is shown in Figure 8.
Figure 8.

Effect of microbubbles and ultrasound on the intracellular DOX uptake by A2780 ovarian carcinoma cells in suspension as demonstrated by fluorescence histograms (cell fluorescence on the x-axis; corresponding cell number on the y-axis); DOX at a concentration of 0.75 mg/ml was encapsulated in either 0.5% PEG-PLLA micelles (upper graph) or 0.5%PEG-PLLA /2% PFP microbubbles; microbubble concentration was 5×10⁸/ml. Continuous wave focused 1.1 MHz ultrasound was applied for 30 s at a peak negative pressure of 2.9 MPa. The effect of ultrasound on intracellular DOX uptake was much greater for the microbubbles than for the micelles.
Due to the ultrasound-enhanced intracellular drug uptake, drug-loaded microbubbles proved effective in tumor chemotherapy in vivo. Two MDA MB231 tumors were inoculated to the right and left flanks of a mouse (the tumors are indicated by arrows in Figure 9A which shows the tumors before the start of the treatment). At the start of the treatment, the right tumor was larger than the left tumor; the right tumor was selected for the ultrasound treatment. Control mice had one tumor in either the right or left flank. Two intravenous tail vein injections of drug-loaded microbubbles that were separated by one week were administered to the experimental mouse. The right (larger) tumor was sonicated for 150 s with 3-MHz ultrasound at a nominal SATA power density of 2 W/cm2 and duty cycle of 20% while the left tumor was not sonicated. The non-sonicated left tumor grew at almost the same rate as control tumors while the sonicated tumor size regressed (Figure 9B). However, the tumor on the right flank has regrown approximately two months after the treatment (Figure 9C) indicating that two treatments were not sufficient for killing all tumor cells.
Figure 9.

(A) - Photograph of a mouse with two tumors on the right and left flanks taken before the start of the treatment. (B) – Photograph of the same mouse taken a month and a half after the treatment. The mouse was treated by intravenous injections of DOX-loaded microbubbles (0.75 mg/ml DOX /0.5% PEG-PLLA/2%PFP) once weekly for a total of two treatments; four hours after the drug injection, the right tumor was sonicated for a 30-s exposure time by unfocused 3-MHz ultrasound at a 2 W/cm2 nominal SATA power density and 20% duty cycle; the left tumor was not sonicated. The left tumor grew at the same rate as the controls while the right (sonicated) tumor regressed in size in about two weeks after the first treatment. (C) – Re-growth of the tumor on the right flank was observed about two months after the treatment.
These data suggested that (i) without ultrasound, the drug was tightly retained by the nano/microbubbles in vivo and (ii) sonication induced a release of the drug from the nano/microbubbles which resulted in the tumor regression.
Nano/microbubbles as ultrasound contrast agents
Intratumoral injections of nanobubbles produced long-lasting hyperechoic “dots” in the ultrasound scans of the MDA MB231 breast cancer or A2780 ovarian carcinoma tumors grown subcutaneously in nu/nu mice (Figure 10). The generation of hyperechoic sites in the tumors was also observed after the intravenous injections of the nanobubbles (Figure 11) [25]. Because the functional cutoff size of the endothelial gaps in the tumor capillaries does not exceed 1 µm [29, 30], the observation of echoes in the tumors of intravenously injected mice suggested that nanobubbles were extravasated into the tumor tissue. Because high echogenicity could not be expected from the nanoscaled bubbles at 14 MHz, the observation of the echoes shown in Figure 11 suggested that the injected nanobubbles coalesced into highly echogenic microbubbles inside the tumor tissue. No hyperechoic entities were observed in the kidney or liver of intravenously injected mice suggesting that the nanobubble extravasation was tumor-selective.
Figure 10.

B-mode ultrasound images of MDA MB231 human breast cancer tumor; (A) - before the intra-tumoral contrast injection; (B) - 4 h after the intratumoral injection of 100 µl 0.5% PEG-PLLA/ 2% PFP formulation. Images were taken using a 14-MHz linear Acuson Sequoia 512 transducer. Strong ultrasound contrast in the tumor persisted for several days.
Figure 11.

B-mode ultrasound images of a MDA MB 231 breast cancer bearing nu/nu mouse following intravenous contrast injection; (A) tumor image taken 4.5 h after the intravenous injection of 100 µl 0.5% PEG-PLLA/2% PFP formulation; (B) – trans-torso image of the same mouse showing a tumor (designated as “mass”), kidneys, and spine. The images show that echogenic microbubbles were accumulated in the tumor but not in the kidney.
Discussion
The compositions developed allowed contrast-enhanced tumor imaging and targeted drug delivery to be provided by the same multifunctional drug carrier system. Drug carrying, tumor-targeting, and retention in the tumor volume were provided by the nanobubbles; ultrasound contrast agent properties were provided by the microbubbles of micron size formed by coalescence of the nanobubbles in tumor tissue. The microbubbles also served as enhancers of ultrasound-mediated drug delivery.
The microbubbles of this study were produced in situ upon the injection of specially designed nanoemulsions; the emulsion nanodroplets were formed by the PFP and stabilized by biodegradable diblock, triblock copolymers, or their mixtures. Because PFP has a boiling point of 29 °C, upon heating to physiological temperatures, PFP droplets evaporated inside the copolymer walls resulting in conversion of nanodroplets into nano/microbubbles.
The nanobubbles accumulated in the tumor tissue by way of a passive targeting due to a higher permeability of tumor blood vessels than that of normal tissue vasculature, as illustrated in Figure 2. The functional cutoff size of the endothelial lining of the blood vessels in normal tissues is only 7 nm, which precludes the penetration of drug-loaded micelles or nano/microbubbles; in contrast, tumors are characterized by defective vasculature with large gaps between the endothelial cells (up to 750 nm or even larger, depending on the tumor type) [29, 30]. This results in extravasation and accumulation of drug-loaded nanoparticles in the tumor interstitium. After extravasation, the nanobubbles coalesced into larger microbubbles, which provided strong ultrasound contrast. Under the action of tumor-directed therapeutic ultrasound, the microbubbles oscillated and collapsed, thus triggering drug release from the bubbles and micelles and perturbing cell membranes [31], which resulted in substantially enhanced intracellular drug uptake. Therefore the microbubbles were active in both, diagnostic and therapeutic ultrasound modes.
In the tumor treatment modality described, drug was delivered predominantly to the sites irradiated by ultrasound. In the megahertz frequency range, localization of acoustic energy is possible into millimeter and even sub-millimeter volumes allowing precise spatial control of drug delivery.
The microbubbles developed in this work differ in a number of ways from ultrasound contrast agents currently on the market (such as Optison® from Amersham Health or Definity® from Bristol-Meyers Squibb): (i) the microbubbles are produced in situ upon injection of specially designed microemulsion; (ii) the microbubbles have strong walls produced by a biodegradable diblock copolymer that stabilizes the microbubbles thus resulting in long-lasting ultrasonic contrast; (iii) the same diblock copolymer that forms the walls of the microbubbles also forms polymeric micelles which encapsulate chemotherapeutic agents and act as drug carriers; (iv) upon drug injection, localized ultrasonic irradiation of the tumor in the presence of microbubbles provides for effective intracellular drug uptake by the tumor cells.
The formation of large microbubbles from coalescence of small bubbles during tumor-localized hyperthermia or ultrasound irradiation as shown in Figure 4, though potentially useful for occluding tumor capillaries, may raise concerns if not strictly localized. In our numerous mouse experiments with intravenously injected bubbles, we have not observed any adverse effects. Still, this problem requires further investigation in larger animals.
Conclusions
The polymeric copolymer-stabilized perfluoropentane nanoemulsion systems undergo nanodroplet/microbubble conversion in vivo, accumulate locally in tumor tissue and coalesce into larger, highly echogenic microbubbles, which provide for long-lasting ultrasound contrast in the tumor, and allows on-demand release of the encapsulated drug under the action of therapeutic ultrasound.
Acknowledgments
This work was supported by the NIH R01 EB1033 grant to NR.
Footnotes
Publisher's Disclaimer: This is a PDF file of an unedited manuscript that has been accepted for publication. As a service to our customers we are providing this early version of the manuscript. The manuscript will undergo copyediting, typesetting, and review of the resulting proof before it is published in its final citable form. Please note that during the production process errors may be discovered which could affect the content, and all legal disclaimers that apply to the journal pertain.
References
- 1.terHaar G, Coussios C. Int. J. Hyperthermia. 2007;23(2):85–87. doi: 10.1080/02656730601185924. [DOI] [PubMed] [Google Scholar]
- 2.Wilson SR, Burnes PN, Muradali D, Wilson JA, Lai X. Radiology. 2000;215:153–161. doi: 10.1148/radiology.215.1.r00ap08153. [DOI] [PubMed] [Google Scholar]
- 3.Kedar RP, Cosgrove D, McCready VR, Bamber JC, Carter ER. Radiology. 1996;198:679–686. doi: 10.1148/radiology.198.3.8628854. [DOI] [PubMed] [Google Scholar]
- 4.Halpern EJ, Rosenberg M, Gomella LG. Radiology. 2002;219:219–225. doi: 10.1148/radiology.219.1.r01ap21219. [DOI] [PubMed] [Google Scholar]
- 5.Bauer A, Becher H, Borges A, Cosgrove D, Leen E, Schlief R, Tiemann K. Acad. Radiol. 2002;9:46–51. doi: 10.1016/s1076-6332(03)80394-x. [DOI] [PubMed] [Google Scholar]
- 6.Lathia JD, Leodore L, Wheatley MA. Ultrasonics. 2004;42:763–768. doi: 10.1016/j.ultras.2003.12.018. [DOI] [PubMed] [Google Scholar]
- 7.El-Sherif DM, Wheatley MA. J. Biomed. Mater. Res. 2003;66:347–355. doi: 10.1002/jbm.a.10586. [DOI] [PubMed] [Google Scholar]
- 8.El-Sherif DM, Lathia JD, Le NT, Wheatley MA. J. Biomed. Mater. Res. 2004;68:71–78. doi: 10.1002/jbm.a.20032. [DOI] [PubMed] [Google Scholar]
- 9.Basude R, Wheatley MA. Ultrasonics. 2001;39:437–444. doi: 10.1016/s0041-624x(01)00080-4. [DOI] [PubMed] [Google Scholar]
- 10.Takalkar AM, Klibanov AL, Rychak JJ, Lindner JR, Ley K. J. Control. Release. 2004;96:473–482. doi: 10.1016/j.jconrel.2004.03.002. [DOI] [PubMed] [Google Scholar]
- 11.Rychak JJ, Li B, Acton ST, Leppanen A, Cummings RD, Ley K, Klibanov AL. Mol Pharm. 2006;3:516–524. doi: 10.1021/mp0600541. [DOI] [PubMed] [Google Scholar]
- 12.Lankford M, Behm CZ, Yeh J, Klibanov AL, Robinson P, Lindner JR. Invest Radiol. 2006;41:721–728. doi: 10.1097/01.rli.0000236825.72344.a9. [DOI] [PubMed] [Google Scholar]
- 13.Rychak JJ, Lindner JR, Ley K, Klibanov AL. J Control Release. 2006;3:288–299. doi: 10.1016/j.jconrel.2006.06.008. [DOI] [PubMed] [Google Scholar]
- 14.Weller GE, Wong MK, Modzelewski RA, Lu E, Klibanov AL, Wagner WR. F.S. VillanuevaCancer Res. 2005;65:533–539. [PubMed] [Google Scholar]
- 15.Klibanov AL. Bioconjug Chem. 2005;16:9–17. doi: 10.1021/bc049898y. [DOI] [PubMed] [Google Scholar]
- 16.Rychak JJ, Klibanov AL, Ley KF, Hossack JA. Ultrasound Med Biol. 2007 Apr 17; doi: 10.1016/j.ultrasmedbio.2007.01.005. [Epub ahead of print] [DOI] [PubMed] [Google Scholar]
- 17.Bloch SH, Dayton PA, Ferrara KW. IEEE Eng Med Biol Mag. 2004;23:18–29. doi: 10.1109/memb.2004.1360405. [DOI] [PubMed] [Google Scholar]
- 18.Dayton PA, Ferrara KW. J Magn Reson Imaging. 2002;16:362–377. doi: 10.1002/jmri.10173. [DOI] [PubMed] [Google Scholar]
- 19.Bloch SH, Short RE, Ferrara KW, Wisner ER. Ultrasound Med Biol. 2005;31:439–444. doi: 10.1016/j.ultrasmedbio.2004.12.016. [DOI] [PubMed] [Google Scholar]
- 20.Zhao S, Borden M, Bloch SH, Kruse D, Ferrara KW, Dayton PA. Mol. Imaging. 2004;3:135–148. doi: 10.1162/1535350042380317. [DOI] [PMC free article] [PubMed] [Google Scholar]
- 21.Ungar EC, Porter T, Culp W, Labell R, Matsunaga T, Zutshi R. Advanced Drug Delivery Reviews. 2004;56:1291–1314. doi: 10.1016/j.addr.2003.12.006. [DOI] [PubMed] [Google Scholar]
- 22.Lum AFH, Borden MA, Dayton PA, Kruse DE, Simon SI, Ferrara KW. J. Control. Release. 2006;111:128–134. doi: 10.1016/j.jconrel.2005.11.006. [DOI] [PMC free article] [PubMed] [Google Scholar]
- 23.Shortencarier MJ, Dayton PA, Bloch SH, Schumann PA, Matsunaga TO, Ferrara KW. IEEE Trans Ultrason Ferroelectr Freq Control. 2004;51:822–831. doi: 10.1109/tuffc.2004.1320741. [DOI] [PubMed] [Google Scholar]
- 24.Rapoport N, Gao Z. WO 2006/127953 A2. 2006 priority data 60/683,829 23/05/2005. [Google Scholar]
- 25.Rapoport N, Kennedy A, Gao Z. J. Natl. Cancer Inst. 2007;99:1–12. doi: 10.1093/jnci/djm043. [DOI] [PubMed] [Google Scholar]
- 26.Rapoport N, Marin A, Christensen D. Drug Delivery Systems and Sciences. 2002;2:37–46. [Google Scholar]
- 27.Kripfgans O, Fabiilli M, Carson P, Fowlkes J. J Acoust Soc Am. 2004;116:272–281. doi: 10.1121/1.1755236. [DOI] [PubMed] [Google Scholar]
- 28.Kripfgans O, Fowlkes J, Miller D, Eldevik O, Carson P. Ultrasound Med Biol. 2000;26:1177–1189. doi: 10.1016/s0301-5629(00)00262-3. [DOI] [PubMed] [Google Scholar]
- 29.Hobbs SK, Monsky WL, Yuan F, Roberts G, Griffith L, Torchilin VP, Jain R. Regulation of trasport pathways in tumor vessels: Role of tumor type and microenvironment. PNAS. 1998;95:4507–4612. doi: 10.1073/pnas.95.8.4607. [DOI] [PMC free article] [PubMed] [Google Scholar]
- 30.Campbell RB. Tumor Physiology and Delivery of Nanopharmaceuticals. Anti-Cancer Agents in Medicinal Chemistry. 2006;6:503–512. doi: 10.2174/187152006778699077. [DOI] [PubMed] [Google Scholar]
- 31.Kamaev P, Rapoport N. Effect of anticancer drug on cell sensitivity to ultrasound in vitro and in vivo. Am J Physics. 2006;829:543–545. [Google Scholar]