

Abstract
Despite considerable evidence for contributions of both Zn2+ and Ca2+ in ischemic brain damage, the relative importance of each cation to very early events in injury cascades is not well known. We examined Ca2+ and Zn2+ dynamics in hippocampal slices subjected to oxygen–glucose deprivation (OGD). When single CA1 pyramidal neurons were loaded via a patch pipette with a Ca2+-sensitive indicator (fura-6F) and an ion-insensitive indicator (AlexaFluor-488), small dendritic fura-6F signals were noted after several (∼6–8) minutes of OGD, followed shortly by sharp somatic signals, which were attributed to Ca2+ (“Ca2+ deregulation”). At close to the time of Ca2+ deregulation, neurons underwent a terminal increase in plasma membrane permeability, indicated by loss of AlexaFluor-488 fluorescence. In neurons coloaded with fura-6F and a Zn2+-selective indicator (FluoZin-3), progressive rises in cytosolic Zn2+ levels were detected before Ca2+ deregulation. Addition of the Zn2+ chelator N,N,N′,N′-tetrakis(2-pyridylmethyl)ethylenediamine (TPEN) significantly delayed both Ca2+ deregulation and the plasma membrane permeability increases, indicating that Zn2+ contributes to the degenerative signaling. Present observations further indicate that Zn2+ is rapidly taken up into mitochondria, contributing to their early depolarization. Also, TPEN facilitated recovery of the mitochondrial membrane potential and of field EPSPs after transient OGD, and combined removal of Ca2+ and Zn2+ markedly extended the duration of OGD tolerated. These data provide new clues that Zn2+ accumulates rapidly in neurons during slice OGD, is taken up by mitochondria, and contributes to consequent mitochondrial dysfunction, cessation of synaptic transmission, Ca2+ deregulation, and cell death.
Keywords: hippocampal slice, mitochondria, zinc, calcium, Ca2+, ischemia
Introduction
Relatively short periods of cerebral ischemia can result in irreversible neuronal damage. Critical triggering mechanisms are proposed to include uncontrolled glutamate release, influx and intracellular accumulation of Ca2+, and the occurrence of repetitive waves of profound neuronal depolarization (Rothman and Olney, 1986; Siesjö, 1988; Dohmen et al., 2008). A sustained rise in intracellular Ca2+ in neuronal somata (“Ca2+ deregulation”) has often been considered predictive of cell death (Randall and Thayer, 1992; Nicholls and Budd, 2000; Shuttleworth and Connor, 2001; Vander Jagt et al., 2008).
Zn2+ is present at high concentrations in brain, where it is sequestered in presynaptic vesicles of certain excitatory pathways, and can be released into the synapse following neuronal stimulation. After ischemia or prolonged seizures, Zn2+ accumulates in hippocampal pyramidal neurons (Frederickson et al., 1989; Tønder et al., 1990) likely due to a combination of presynaptic Zn2+ release and entry into postsynaptic neurons (“translocation”), and release from stores already present within neurons. In vitro studies indicate that Zn2+ can potently disrupt mitochondrial function (Skulachev et al., 1967; Link and von Jagow, 1995; Manev et al., 1997; Brown et al., 2000; Weiss et al., 2000; Dineley et al., 2003; Gazaryan et al., 2007). In transient forebrain ischemia, observations that Zn2+ chelation protects hippocampal CA1 neurons implicate Zn2+ as a contributor to their injury (Koh et al., 1996; Calderone et al., 2004); further in vivo studies have suggested that Zn2+ may act in part via disruption of mitochondrial function following ischemia (Calderone et al., 2004; Bonanni et al., 2006).
However, as previous studies have generally examined Zn2+ accumulation or effects of its chelation on outcome hours to days after the ischemic event, little is known about Zn2+ contributions to the initiation of death cascades. These mechanisms can be studied using brain slices subjected to oxygen–glucose deprivation (OGD), a procedure that mimics some aspects of stroke. In hippocampal slice models, extracellular and intracellular Zn2+ levels increase shortly after onset of OGD (Wei et al., 2004; Stork and Li, 2006), and application of high concentrations of the Zn2+-selective chelator TPEN decreased subsequent cell death (Stork and Li, 2006).
In light of the ability of many Ca2+ indicators to detect Zn2+ rises (Cheng and Reynolds, 1998; Devinney et al., 2005), and recent observations suggesting that Zn2+ rises contributed substantially to measured fluorescence changes of a Ca2+ indicator in hippocampal slices subjected to OGD (Stork and Li, 2006), a key aim of present studies was to simultaneously visualize Zn2+ and Ca2+ dynamics in individual CA1 neurons in slices subjected to OGD, to clarify their respective contributions to the induction of cell death. Our studies indicate that OGD induces rapid Zn2+ accumulation in neurons and its uptake into mitochondria, and that the Zn2+ contributes to sequelae including Ca2+ deregulation. The Ca2+ deregulation contributes to a terminal loss of membrane integrity and cell death. Thus, interventions targeting neuronal Zn2+ accumulation and its interaction with mitochondria may offer critical benefits when delivered in the acute phases of ischemia.
Materials and Methods
Animals.
Animal procedures were conducted in accordance with the National Institutes of Health Guide for the Care and Use of Laboratory Animals and with protocols approved by the Institutional Animal Care and Use Committee of the University of California at Irvine. Efforts were made to minimize animal suffering and number of mice used.
Preparation of acute hippocampal slices.
Hippocampal slices were prepared from 4-week-old Swiss Webster mice (Hilltop Lab Animals). Mice were deeply anesthetized with isoflurane and decapitated, and the brain was rapidly removed. Hippocampal slices (300 μm) were cut with a vibratome (VT-1200, Leica Microsystems) in chilled cutting solution, containing (in mm) 3 KCl, 1.25 NaH2PO4, 0.2 CaCl2, 6 MgSO4, 26 NaHCO3, 220 sucrose, 10 glucose, and 0.43 ketamine (pH 7.35, 310 mOsm, equilibrated with 95% O2/5% CO2) and then transferred into artificial CSF (ACSF) containing (in mm) 126 NaCl, 3 KCl, 1.25 NaH2PO4, 2 CaCl2, 1 MgSO4, 26 NaHCO3, and 10 glucose (pH 7.35, 310 mOsm, adjusted with sucrose and equilibrated with 95% O2/5% CO2). After preincubation for 1 h at 34°C, all slices were placed in a holding chamber at room temperature for at least 1 h before being transferred to a recording chamber; throughout, slices were submerged in ACSF.
Loading individual hippocampal CA1 neurons with fluorescent indicators and fluorescence measurements.
For recordings slices were placed in a flow-through chamber (RC-27L chamber with plastic slice anchor (Warner Instruments) mounted on the stage of an upright microscope (BX51WI, Olympus) and superfused with oxygenated ACSF (95% O2/5% CO2) at 2 ml/min. Experiments were performed at 32 ± 0.5°C. Whole-cell patch-clamp recordings were obtained using a patch-clamp amplifier (Axopatch 200B) and an analog-to-digital converter Digidata 1322A (Molecular Devices). Patch pipettes (5–7 MΩ) were pulled from borosilicate glass with filament (World Precision Instruments) on a P-87 micropipette puller (Sutter Instruments) and filled with the following solution (mm): 125 K-gluconate, 10 KCl, 3 Mg-ATP, 1 MgCl2, 10 HEPES, pH 7.25 with KOH (290 mOsm with sucrose). Fluorescent indicators were dissolved in pipette solution (FluoZin-3, 1 mm; fura-6F, 1 mm; AlexaFluor-488, 0.5 mm) and loaded into the pipette tip (1 μl) before backfilling with pipette solution. Neurons were loaded with fluorescent indicators via patch pipettes by holding neurons in the whole-cell configuration at −60 mV for ∼5 min. The pipettes were then slowly withdrawn from the cell. This technique of loading with a small volume of concentrated indicator in the pipette tip is similar to that used and discussed in a recent study (Vander Jagt et al., 2008) and provides the benefit of good loading of dendritic processes while minimizing cellular dialysis. Successful pipette removal was judged by monitoring both the formation of an outside-out patch and Ca2+ levels in neuronal somata. If the patch was formed successfully (leakage current less then 30 pA) and [Ca2+]i did not increase, cells were considered healthy and used for experiment after a 30 min recovery.
For simultaneous measurements of intracellular Ca2+ and Zn2+ dynamics cells were coloaded with the low-affinity Ca2+-sensitive indicator fura-6F (KdCa ∼5.3 μm), and the high-affinity Zn2+-sensitive indicator FluoZin-3 (KdZn ∼15 nm). To assess changes in membrane integrity, the ion-insensitive indicator AlexaFluor-488 hydrazide was coloaded with fura-6F. Fluorescence was alternately excited at 340 (20), 380 (20), and 482 (20) nm via a 40× water-immersion objective [numerical aperture (NA) 0.8, Olympus], using a xenon light source (Sutter Instruments), and emission collected at 532 (40) nm using a CCD camera (Hamamatsu). (All filters are bandpass with bandwidths indicated in parentheses.) Images were acquired at 5 or 30 s intervals and analyzed, after background subtraction, with METAFLUOR 7.0 software (Molecular Devices). For figure presentation, background-subtracted 340/380 ratio images were masked using the 482 nm AlexaFluor-488 images (if available) or the 380 nm fluorescent images. [Ca2+]i values are presented as the 340/380 nm ratio, and [Zn2+]i changes are presented as ΔF/F0 = (F − F0)/F0, where F is the current fluorescence intensity and F0 is the baseline fluorescence intensity. AlexaFluor-488 changes are presented as F/F0.
To access changes in mitochondrial potential (ΔΨm) slices were bulk loaded with the ΔΨm-sensitive probe, Rhodamine 123 (Rh123, 26 μm, 30 min at 22–25°C) before OGD and regions of interest monitored in the CA1 pyramidal cell layer and in the apical dendritic fields. This charged rhodamine derivative is taken up into polarized mitochondria, and when sufficient concentrations are used, fluorescence is quenched; under these conditions upon loss of ΔΨm the dye is released from mitochondria into the cytosol and cytosolic fluorescence increases (Duchen et al., 2003). Rh123 was excited at 540 (25) nm, emitted fluorescence was collected at 605 (55) nm, and images were collected at 0.03 Hz. Data are presented as ΔF/F0 = (F − F0)/F0, where F is the current fluorescence intensity and F0 is the baseline fluorescence.
Extracellular recording.
Field EPSPs (fEPSPs) were recorded from CA1b stratum radiatum by using a single glass pipette (2–3 MΩ). Slices were superfused at 1.2 ml/min (32°C), and experiments were performed at 32 ± 0.5°C. Orthodromic stimulation was delivered in the Schaffer collateral–commissural projections. Pulses were administered to the stimulating electrode at 0.05 Hz using a current that elicited a 50% maximal response. Extracellular evoked responses and DC potential shifts (to assess spreading depression-like events) were recorded by a DC amplifier (A-M System). Data were stored and analyzed using the PCLAMP software (Molecular Devices) via a 16-bit data acquisition system (Digidata 1320A or 1322A, Molecular Devices) at a sampling rate of 5 kHz (fEPSP) or 1 kHz (DC potential).
Oxygen–glucose deprivation in slices and nominally Ca-free experiments.
To simulate hypoxic-hypoglycemic conditions ACSF was replaced with identical solution but lacking glucose (glucose was substituted with an equimolar concentration of sucrose) and equilibrated with 95% N2/5% CO2. For Ca2+ removal, Ca2+ was substituted with 2 mm Mg2+ (Ca-free ACSF).
Reagents.
N,N,N′,N-tetrakis(2-pyridylmethyl)ethylenediamine (TPEN) 20 mm stock solution was made freshly every day in 95% ethanol and then diluted to final concentration of 40 μm in ACSF. Carbonylcyanide-4-(trifluoromethoxy)-phenylhydrazone (FCCP) was used at 5 μm prepared from 10 mm stock (in DMSO). Fura-6F, FluoZin-3, bis-fura-2, and AlexaFluor-488 were obtained from Invitrogen. FCCP was purchased from Tocris Bioscience. All other reagents were purchased from Sigma.
Data analysis.
In OGD experiments FluoZin-3 fluorescence decreased slightly due to photobleaching. To determine the onset of OGD-induced Zn2+ rises, the baseline was linearly fitted and the Zn2+ rise onset determined as the intersection of this line with a linear extrapolation of the maximum slope of the first Zn2+ rise exceeding 20% over baseline. The onset time of Ca2+ deregulation, was determined from the intersection of the linear extrapolation of the baseline and a linear fit of the maximum slope of the fura-6F ratio 340/380 increase as it rose ≥6-fold. Differences between groups were tested using Student's t test (or paired t test as indicated). All comparisons reflect sets of data substantially interleaved in time, and were based on 4–10 slices from ≥4 animals each condition (numbers of cells and slices are indicated for each expt).
Results
Ca2+ deregulation and loss of membrane integrity in CA1 neurons during OGD
A number of past studies have examined contributions of Ca2+ accumulation to hippocampal neuronal injury in slice OGD models of ischemia (Lobner and Lipton, 1993; Tanaka et al., 1997; Lipski et al., 2006). Our first aim was to ascertain the specific relationship between cytosolic Ca2+ increases in individual CA1 neurons subjected to OGD, and the occurrence of irreversible injury as indicated by a loss of membrane integrity. CA1 pyramidal neurons were loaded via patch pipettes with the low-affinity Ca2+-sensitive indicator, fura-6F and an ion-insensitive fluorescent compound, AlexaFluor-488 (see Materials and Methods). After removal of the loading pipette, cells were monitored for ∼40 min, and if baseline Ca2+ levels appeared stable, subjected to 15 min of oxygen–glucose deprivation (OGD).
Approximately 6–10 min following the onset of OGD, fura-6F ratio increases were noted to begin within apical dendrites (sometimes with an associated small transient rise in the soma), followed within 1–3 min by large abrupt fura-6F increases in somata (“Ca2+ deregulation”; onset at 9.0 ± 0.34 min, n = 10 cells from 8 slices, 8 mice) (Fig. 1). Somatic Ca2+ deregulation was always accompanied by the onset of a severe loss of AlexaFluor-488 fluorescence, and there was no recovery of fura-6F ratio after this time point. These data are indicative of an increase in membrane permeability and loss of neuronal viability (Randall and Thayer, 1992; Vander Jagt et al., 2008). In another set of slices, an extracellular recording electrode was placed in the adjacent dendritic fields to assess the occurrence of a spreading depression (SD)-like event (Dietz et al., 2008). In 4 slices in which SD was recorded while monitoring Ca2+ rises in individual CA1 neurons, the SD (peak at 7.27 ± 0.92 min) always preceded the initial dendritic Ca2+ rise (at 8.18 ± 1.03 min; p < 0.05 by paired t test).
Figure 1.

OGD induces Ca2+ deregulation followed by loss of membrane integrity in CA1 neurons. A, Fluorescence images of an individual CA1 neuron coloaded via a patch pipette with a ratiometric Ca2+-sensitive indicator (top panels; 340/380 nm fura-6F ratio images) and an ion-insensitive fluorescent marker (bottom panels; AlexaFluor-488 fluorescence). Arrow indicates the location of the dendritic measurements, and numbers indicate time (in minutes) following onset of OGD. B, Traces show somatic fura-6F ratio (black) and AlexaFluor-488 (red) fluorescence changes in the same neuron illustrated in A. The gray trace shows the fura-6F changes in the dendrite. C, Traces show mean fluorescence changes (±SEM) from the somata of 10 CA1 neurons (black: fura-6F ratio, red: AlexaFluor-488). Individual responses have been aligned to the onset of an irrecoverable fura-6F ratio increases (“Ca2+ deregulation”) in each neuron (dashed line, 9.0 ± 0.34 min). The OGD bar shows the time of OGD exposure (±SEM). Note the abrupt acceleration in the loss of AlexaFluor-488 fluorescence, indicative of a terminal loss of membrane integrity, starting close to the time of Ca2+ deregulation.
Although we refer to the irrecoverable fura-6F ratio increases described above as a “Ca2+ deregulation” event, in light of previous studies reporting that Zn2+ may contribute substantially to Ca2+ indicator signals during OGD, we performed additional ion substitution (Ca2+ removal) and Zn2+ chelation studies to further clarify the ionic basis of the event, and its contribution to the induction of the terminal loss of membrane integrity. First, we performed prolonged (30 min) OGD exposures in nominally Ca2+-free ACSF, monitoring neuronal fura-6F and AlexaFluor-488 fluorescence changes as above. Superfusion with Ca2+-free ACSF was started 5 min before the OGD, and slices were reexposed to normal ACSF (with 2 mm Ca2+) 5 min after the OGD exposure was terminated. Under these conditions, there was either no demonstrable fura-6F ratio change throughout the OGD, or (in 4/8 cells) there was a small ratio increase (<1) between 25 and 30 min of OGD. There was also a slow decrease in AlexaFluor-488 fluorescence throughout the OGD which seemed to be due to enhanced cell swelling upon OGD in the absence of Ca2+ ions, causing dilution of the signal. However, in all neurons, Ca2+ deregulation (with >6-fold ratio increase) and an associated sharp acceleration of AlexaFluor-488 fluorescence loss occurred almost immediately following restoration of 2 mm Ca2+ (after 1.5 ± 0.58 min, n = 8 cells, 8 slices, 8 mice) (Fig. 2A). These results support a direct contribution of Ca2+ to the loss of membrane integrity, much as was recently reported in a study of prolonged excitotoxic activation (Vander Jagt et al., 2008). Furthermore, these data are consistent with the idea that large increases in cytosolic Ca2+ (rather than Zn2+) are responsible for the abrupt and irrecoverable fura-6F signal increases. However, it remained possible that intracellular Zn2+ could accumulate (and then bind to fura-6F) in a manner that was dependent on extracellular Ca2+.
Figure 2.
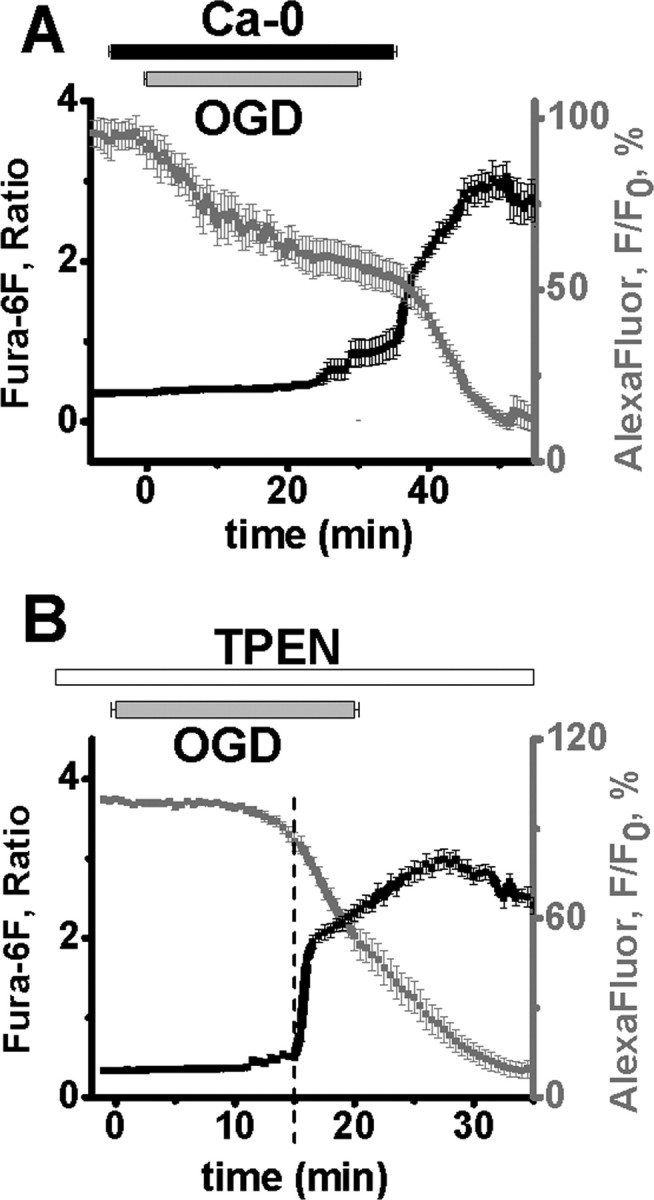
Zn2+ and Ca2+ contribute to OGD-induced damage of CA1 pyramidal neurons. A, Ca2+ removal during OGD prevents the Ca2+ deregulation. CA1 neurons were loaded with fura-6F (black) and AlexaFluor-488 (gray). Slices were superfused with Ca2+-free ACSF for 5 min before, during, and for 5 min after a 30 min episode of OGD. In cells exposed to OGD for 30 min, Ca2+ deregulation occurred almost immediately (1.5 ± 0.6 min, n = 8) after restoration of Ca2+ to the media, and as previously observed with Ca2+ containing ACSF, was accompanied by an abrupt acceleration in the rate of AlexaFluor-488 fluorescence loss, indicative of a terminal loss of membrane integrity. The slow loss of AlexaFluor-488 fluorescence throughout the OGD appeared to be largely attributable to enhanced cell swelling during zero-Ca2+ OGD. Individual responses (±SEM) have been aligned to the onset of Ca2+ deregulation, and the OGD bar shows the time of OGD exposure (±SEM), as above. B, TPEN significantly delays OGD-evoked Ca2+ deregulation. Neurons were loaded with fura-6F (black) and AlexaFluor-488 (gray), and exposed to TPEN (40 μm) before and during OGD exposure in normal Ca2+ containing ACSF (n = 12). Fura-6F signal increases and loss of membrane integrity (indicated by loss of AlexaFluor-488 fluorescence) (±SEM) still occurred, but were significantly delayed compared with responses in normal ACSF (see Fig. 1C). Individual responses have been aligned to the onset of Ca2+ deregulation, and the OGD bar shows the time of OGD exposure (±SEM), as above.
To test this possibility, we examined the effects of a high-affinity chelator of Zn2+ (TPEN, 40 μm; 15 min preexposure and present throughout OGD) on fura-6F signals during OGD. (Of note, although TPEN is routinely used as a Zn2+ chelator, it can bind other metals including Cu2+ and Fe2+, and we cannot rule out that interactions with these trace metals could contribute to its effects.) Under these conditions, irrecoverable fura-6F increases still occurred, but were significantly delayed [occurring at 15.45 ± 0.77 min, n = 12 cells from 9 slices, 8 mice (Fig. 2B), compared with 9.0 ± 0.34 min in the absence of TPEN (Fig. 1C), p < 0.001], and were still closely linked to an irrecoverable increase in plasma membrane permeability. Thus, the occurrence of this event despite the presence of a Zn2+ chelator supports the inference that Ca2+ is the primarily ionic contributor to the large fura-6F signals (which will be referred to below as “Ca2+ deregulation” events).
Although TPEN is a very weak Ca2+ chelator (Kd ∼4 × 10⁻⁵ m) (Arslan et al., 1985), additional control experiments were performed to verify that the TPEN exposures used did not substantially buffer intracellular Ca2+ rises. CA1 neurons were loaded with the relatively high-affinity Ca2+ indicator bis-fura-2 (Kd ∼370 nm) and subjected to step depolarizations (from −60 to 0 mV, 1 s) before, after 10 min exposure to, and after 10 min washout of 40 μm TPEN. TPEN had no significant effect on the magnitude of the bis-fura-2 ratio increase (ctrl: 100 ± 6.7%; TPEN: 84.5 ± 9.1%; washout: 74.3 ± 5.9%; ctrl vs TPEN p = 0.33, n = 4). Thus, TPEN has little effect on depolarization-induced Ca2+ rises, which were far lower than those we detect with fura-6F, and the delay of Ca2+ deregulation-induced by TPEN is most likely due to Zn2+ chelation.
Slow Zn2+ rises generally precede and contribute to the induction of the Ca2+ deregulation
We next set out to measure OGD-induced changes in intracellular Zn2+ levels in relationship to the time of Ca2+ deregulation. OGD exposures (15 min) were performed as above, but after loading individual CA1 neurons with fura-6F along with a Zn2+ selective indicator (FluoZin-3) (Gee et al., 2002). A similar approach was recently reported to enable discrimination between Ca2+ and Zn2+ rises in cultured neurons (Devinney et al., 2005) and in hippocampal slices (Dietz et al., 2008). Under these conditions, a slow and progressive increase in somatic FluoZin-3 fluorescence began 5–10 min after onset of OGD (starting at 7.74 ± 0.23 min; 9 cells from 8 slices, 5 mice), which was followed at 10.27 ± 0.32 min by Ca2+ deregulation (Fig. 3). Notably, the initial slow Zn2+ rise preceded the Ca2+ deregulation in all cells examined, and generally preceded even the initial dendritic fura-6F signals (which occurred at 8.8 ± 0.51 min; p < 0.05 vs Zn2+ rise by paired t test). After the sharp signal increases in both indicators there was a loss of FluoZin-3 fluorescence, likely reflecting loss of indicator from cells. Indeed, while the fura-6F ratio remained high, the absolute fluorescence signals for this indicator progressively decreased at both 340 and 380 nm wavelengths, indicative of membrane disruption as previously described (Vander Jagt et al., 2008). Finally, to further confirm that the FluoZin-3 signal does indeed represent a cytosolic Zn2+ rise, neurons were loaded with FluoZin-3 and fura-6F as above, and exposed to OGD in the presence of TPEN. Preexposure of slices to TPEN caused a substantial drop in basal FluoZin-3 fluorescence (80 ± 3.2% in 10 min; 6 cells from 5 slices, 4 mice), and virtually eliminated FluoZin-3 signals seen during OGD (Fig. 4A), while having little effect on the Ca2+ deregulation (other than it being delayed compared with control). Thus, these observations support the idea that slow cytosolic Zn2+ rises precede and contribute to the occurrence of Ca2+ deregulation, which in turn is linked to loss of membrane integrity and cell death.
Figure 3.

OGD-evoked Zn2+ rises precede the Ca2+ deregulation. A, Fluorescence images of an individual CA1 neuron coloaded via a patch pipette with a ratiometric Ca2+-sensitive indicator (top panels; 340/380 nm fura-6F ratio images) and a Zn2+ selective indicator (bottom panels; FluoZin-3). Arrow indicates the location of the dendritic measurements, and numbers indicate time (in minutes) following onset of OGD. B, Traces show somatic FluoZin-3 fluorescence (blue) and fura-6F ratio (black) changes in the same neuron illustrated in A. The gray trace shows the fura-6F changes in the dendrite. C, Traces show mean somatic FluoZin-3 fluorescence (blue) and fura-6F ratio (black) changes from 9 CA1 neurons, and are aligned for the onset of the Ca2+ deregulation. The OGD bar shows the time of OGD exposure (±SEM). The onset of the Zn2+ rise (7.74 ± 0.23 min) preceded the Ca2+ deregulation (10.27 ± 0.32 min) in all neurons.
Figure 4.
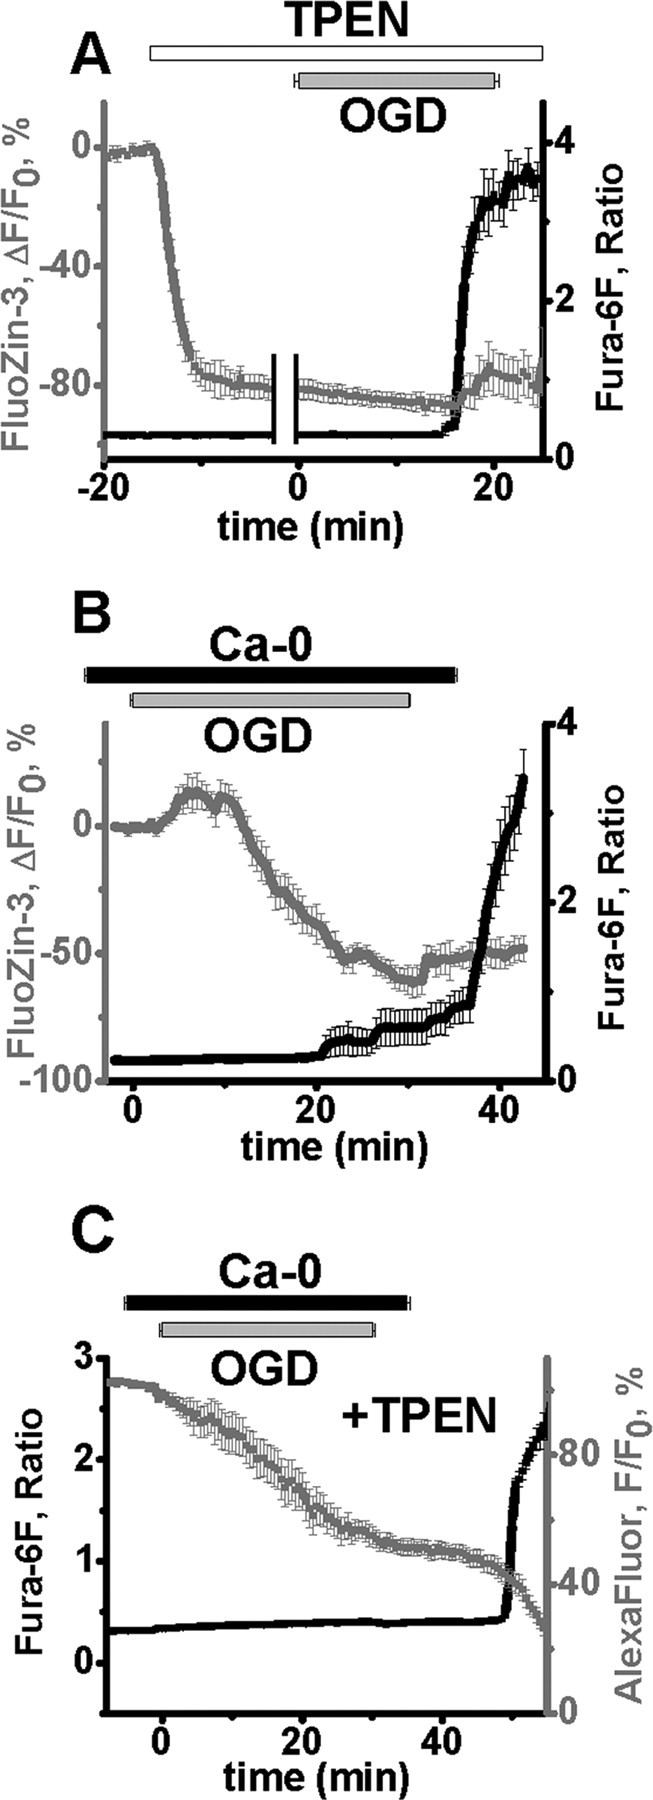
Ca2+ and Zn2+ both are involved in triggering of OGD evoked Ca2+ deregulation. A, Bath application of TPEN effectively chelates intraneuronal Zn2+ and significantly delays OGD-evoked Ca2+ deregulation. Neurons were coloaded with FluoZin-3 and fura-6F, and exposed to TPEN (40 μm) for 15 min before and during OGD. TPEN decreased basal FluoZin-3 fluorescence by 80 ± 3.2% within 10 min of application (gray), without affecting the fura-6F 340/380 nm ratio (black) (left side of panel; traces aligned to the addition of TPEN). Subsequent OGD exposures evoked Ca2+ deregulation (as indicated by a sharp fura-6F ratio increase), which was significantly delayed (n = 6, 16.0 ± 0.91 vs 10.27 ± 0.32 min in control, n = 9), but greatly reduced changes in FluoZin-3 fluorescence (which remained well below basal fluorescence) (right side of panel; traces aligned to onset of Ca2+ deregulation). All data (±SEM) are obtained from the same 6 CA1 neurons. B, OGD-induced Zn2+ rises still occur despite removal of extracellular Ca2+. Neurons were coloaded with FluoZin-3 and fura-6F and slices superfused with Ca2+-free ACSF for 5 min before, during and for 5 min after a 30 min episode of OGD. During prolonged OGD in Ca2+-free ACSF, Zn2+ rises still occurred after 5–10 min (as in the presence of Ca2+) (Fig. 3). However, under these conditions the peak FluoZin-3 fluorescence increase seemed to be blunted, followed by a slow decrease in fluorescence due to enhanced cell swelling which occurred during OGD exposures in Ca2+-free ACSF. The Ca2+ deregulation occurred shortly after replacement of Ca2+, and was unaccompanied by major changes in the FluoZin-3 fluorescence. Traces show mean values ± SEM. C, TPEN significantly delays the Ca2+ deregulation after prolonged OGD in Ca2+-free ACSF. CA1 neurons were subjected to OGD in nominally Ca2+-free ACSF as in Figure 2A, but in the presence of TPEN (40 μm). Under these conditions the Ca2+ deregulation and associated abrupt loss of AlexaFluor-488 fluorescence still occurred, but were markedly delayed (14.2 ± 1.5 min after Ca2+ replacement, p < 0.001 vs no TPEN condition; n = 7 cells, ±SEM).
Additional experiments were performed to resolve the contribution of the Zn2+ increase to Ca2+ deregulation. First, to investigate the dependence of the early Zn2+ rise upon influx of Ca2+ ions, CA1 neurons were loaded with FluoZin-3 and fura-6F and subjected to OGD for 30 min in nominally Ca2+-free ACSF (Fig. 4B). Under these conditions, FluoZin-3 fluorescence increases still occurred between 5 and 10 min, although they were blunted, and as described above for AlexaFluor-488 in the case of zero-Ca2+ OGD exposures, were followed by slow fluorescence decreases due to neuronal swelling (see Fig. 2). Also, as in Figure 2A, a small fura-6F signal was noted in some (3/7, 6 slices, 6 mice) cells during the OGD, and Ca2+ deregulation occurred very shortly after restoration of Ca2+ to the ACSF (1.73 ± 0.65 min) (Fig. 4B).
Cumulative results above suggest that a Zn2+ rise occurring after several min of OGD contributes to the induction of Ca2+ deregulation, which in turn is causally linked to a loss of membrane integrity. To further clarify the role of each of these ions in the subsequent cell death, we loaded CA1 neurons with fura-6F and AlexaFluor-488, and performed 30 min OGD exposures in which both cations were transiently removed (Ca2+-free ACSF + TPEN). Under these conditions, the Ca2+ deregulation was still linked to a sharp decrease in AlexaFluor-488 fluorescence, but was markedly delayed, occurring 14.24 ± 1.55 min after Ca2+ replacement (n = 7 cells from 6 slices, 6 mice vs 1.5 ± 0.58 min in control, p < 0.001) (Fig. 4C). Thus, the ability of TPEN to significantly delay the degenerative events regardless of the presence of extracellular Ca2+ suggests an important role for Zn2+ accumulation during the period of OGD in the initiation of the injury response.
Zn2+ and Ca2+ both contribute to an irreversible loss of synaptic transmission
We next examined the contribution of Zn2+ to a functional consequence of OGD, specifically the failure of synaptic transmission, by recording presynaptic fiber volleys and field EPSPs (fEPSPs) evoked by Schaffer collateral afferent stimulation (Fig. 5). For initial studies, we selected OGD exposure times of 10 min, which is modestly longer than the time to Ca2+ deregulation in the absence of TPEN (9.0 ± 0.34 min), with the expectation that this exposure would likely produce loss of synaptic function, while allowing a good chance of rescue by Zn2+ chelation. Of note, as it likely takes 1–2 min after restoration of normal ACSF to reverse the effects of OGD, the effective duration of this insult is likely somewhat longer. Presynaptic fiber volleys decreased by >90% within several min of OGD, but largely recovered (to 64.6 ± 9.23% of baseline, n = 9) within 30 min after the OGD exposure. Postsynaptic responses were also promptly depressed, but unlike presynaptic signals, fEPSPs showed no significant recovery over the time course assessed (5.7 ± 3.65% of baseline at 8 min of OGD, 6.8 ± 2.81% of baseline after 1 h reperfusion). TPEN (40 μm) had no effect on basal transmission (presynaptic fiber volley or fEPSP amplitude), the loss or recovery of the fiber volley, or the initial loss of the fEPSP amplitude; however it markedly enhanced the recovery of the fEPSP after slices were reexposed to normal ACSF (to 59.3 ± 10.16%, of baseline within 1 h, n = 11, p < 0.001) (Fig. 5B). In contrast, with 15 min OGD, there was no recovery in the fEPSP regardless of the presence of TPEN (data not shown), likely consistent with the occurrence of Ca2+ deregulation at close to 15 min of OGD when TPEN was present (Fig. 2B).
Figure 5.

Ca2+ and Zn2+ both contribute to the loss of synaptic transmission after OGD. Extracellular stimulating and recording electrodes were placed in the Schaffer collateral pathway and stimuli delivered every 20 s, before, during, and after OGD. A, Representative traces at baseline, at the end of a 10 min period of OGD, and after 30 min recovery, in the absence (left) and presence (right) of TPEN. Arrow shows the presynaptic fiber volley, preceding the fEPSP. Note that TPEN enhances recovery of the fEPSP. B, Zn2+ contributes to the loss of synaptic transmission with 10 min OGD. OGD caused a rapid loss of both the presynaptic fiber volley (left) and the fEPSP (right). Note that the fiber volley recovered regardless of the presence of TPEN, but that the fEPSP did not recover unless TPEN was present. C, Zn2+ also contributes to the loss of synaptic transmission with longer (15 min) OGD in Ca2+-free ACSF. With 15 min OGD in normal ACSF, there was no recovery of the fEPSP regardless of the presence of TPEN (data not shown). To examine possible interactions between Zn2+ and Ca2+ in the loss of transmission, slices were perfused with Ca2+-free ACSF for 5 min before and after a 15 min episode of OGD. As above, OGD caused a rapid loss of both the presynaptic fiber volley (left) and the fEPSP (right), with the fiber volley recovering regardless of the presence of TPEN, but recovery of the fEPSP greatly improved in the presence of TPEN. Thus, with this longer period of OGD, both Ca2+ and Zn2+ contribute to the irreversible loss of transmission. All traces show normalized amplitudes ± SEM.
To investigate interactions between Zn2+ and Ca2+ in the loss of synaptic transmission, we next examined the effects of Ca2+ removal during the 15 min OGD (see Materials and Methods). Similar Ca2+ removal has been found to enhance recovery of synaptic transmission after transient NMDA exposure (Hoskison and Shuttleworth, 2006). Under these conditions the transient loss and recovery of the presynaptic fiber volley was largely unaffected. Notably, the perfusion of Ca2+-free ACSF caused >70% loss of the fEPSP even before onset of the OGD, and >97% loss at the end of the 15 min OGD. The fEPSP partially recovered within 1 h after the OGD (to 24.5 ± 7.40.6% of baseline, n = 11). However, when TPEN was added with the Ca2+-free ACSF, the recovery of the fEPSP was substantially improved (to 70.6 ± 8.97%, n = 14, p < 0.001) (Fig. 5C). In control experiments, transient exposures to Ca2+-free ACSF caused no significant lasting loss of either the fiber volley or the fEPSP (data not shown). Thus, with this longer 15 min episode of OGD, both Zn2+ and Ca2+ seem to contribute critically to the irreversible loss of synaptic function.
OGD induces Zn2+ uptake into mitochondria
We tested the hypothesis that OGD-evoked cytosolic Zn2+ rises are buffered by uptake into mitochondria, and that these organelles might be a crucial site of the initial deleterious effects of Zn2+. To examine possible Zn2+ uptake into mitochondria, slices were briefly preexposed to the mitochondrial uncoupler, FCCP (5 μm, 5 min). FCCP dissipates the proton gradient across the inner mitochondrial membrane, resulting in loss of the mitochondrial potential (ΔΨm), thereby impairing electrogenic uptake of Zn2+ into mitochondria and also inducing release of Zn2+ already present in mitochondria (Sensi et al., 2002, 2003). Under these conditions, cytosolic Zn2+ rises were significantly accelerated, occurring in most cells within the first minute of OGD (n = 10 cells, from 10 slices, 8 mice, 0.79 ± 0.50 vs 7.9 ± 0.44 min, n = 9 control cells matched in time, p < 0.001) (Fig. 6A,B). Although FCCP can induce proton flux across any membranes, FCCP alone (5 min, without subsequent OGD) caused no significant rise in Zn2+ or Ca2+ during the exposure or over the ensuing 10 min (n = 6 cells, 6 slices, 6 mice, data not shown), but does cause prompt loss of ΔΨm (see Fig. 7, below). Thus, the accelerated cytosolic Zn2+ rise most likely is due to diminished uptake into mitochondria, thereby revealing cellular accumulation of free Zn2+ to occur very rapidly after onset of OGD. Under these conditions, the Ca2+ deregulation was also accelerated by FCCP, occurring 5.3 ± 0.38 min from OGD onset (n = 10, vs 10.1 ± 0.56, n = 9 control cells matched in time, p < 0.001). Furthermore, in cells loaded with fura-6F and AlexaFluor-488, and exposed to FCCP before OGD, the Ca2+ deregulation (at 4.9 ± 0.29 min, n = 10, 9 slices, 8 mice) (Fig. 6C) was still associated with an acceleration in loss of AlexaFluor-488 fluorescence.
Figure 6.
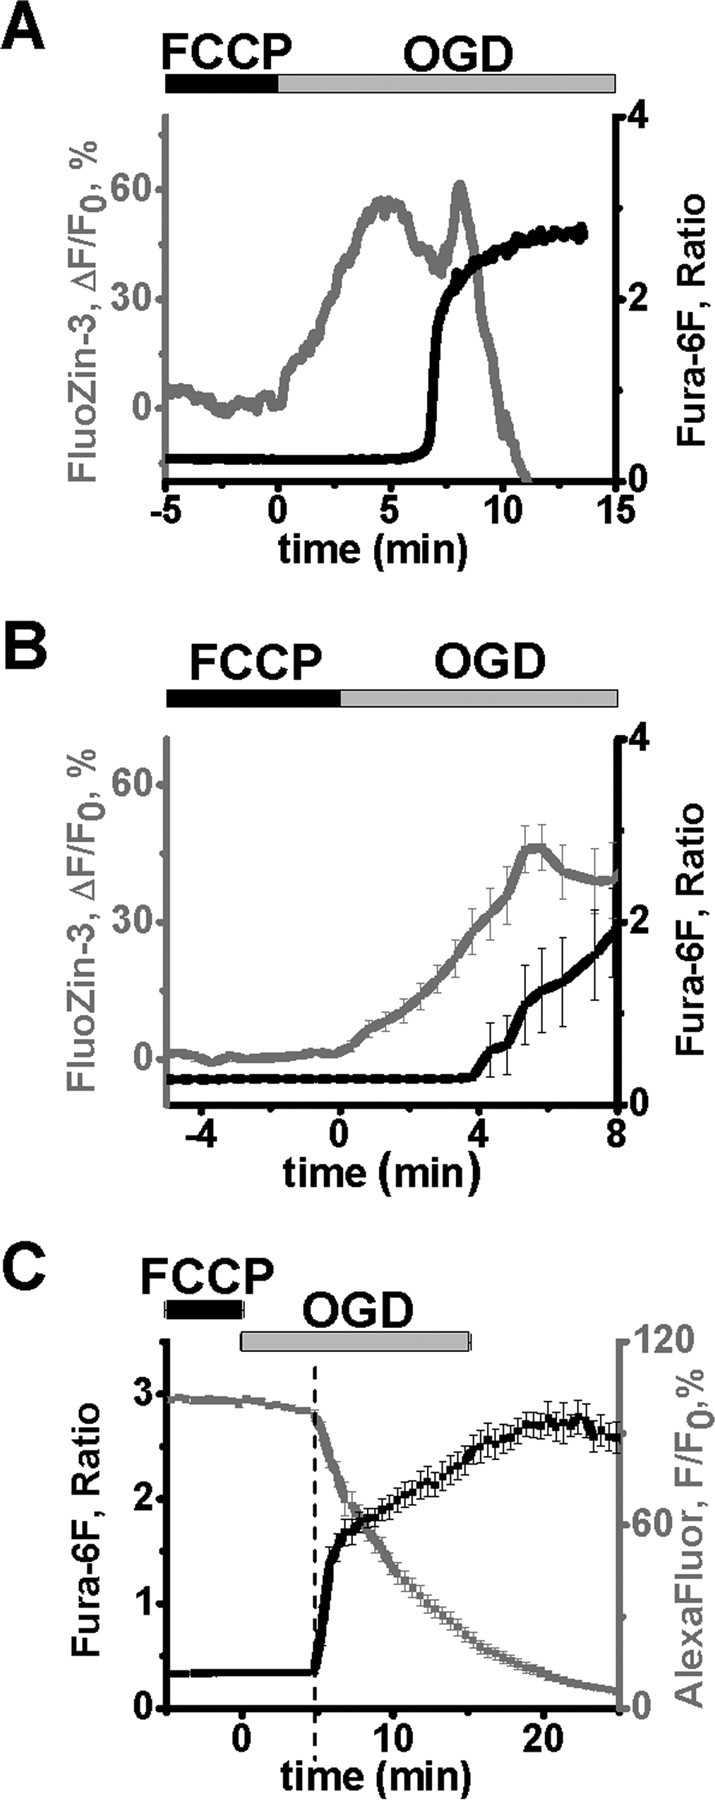
Partial mitochondrial uncoupling results in accelerated OGD-induced Zn2+ rises and Ca2+ deregulation. Neurons were loaded as indicated and exposed to FCCP (5 μm) for 5 min, followed by 15 min OGD. A, Traces from a representative neuron show that both the initial Zn2+ rise (gray) and the Ca2+ deregulation (black) were substantially accelerated, with the Zn2+ rise beginning within the first minute of OGD. B, Average traces (±SEM) from 10 CA1 neurons show the Zn2+ rise (gray; at 0.79 ± 0.50 min) and the Ca2+ deregulation (black, 5.3 ± 0.38 min). Data are aligned to the OGD onset to show the start of early [Zn2+]I rise. C, The accelerated OGD-induced Ca2+ deregulation after FCCP exposure is still linked to a membrane permeability increase. CA1 neurons were loaded with fura-6F and AlexaFluor-488, and exposed to FCCP before 15 min OGD as above. Traces (±SEM) are aligned to the start of the Ca2+ deregulation (4.9 ± 0.29 min, n = 10 cells).
Figure 7.
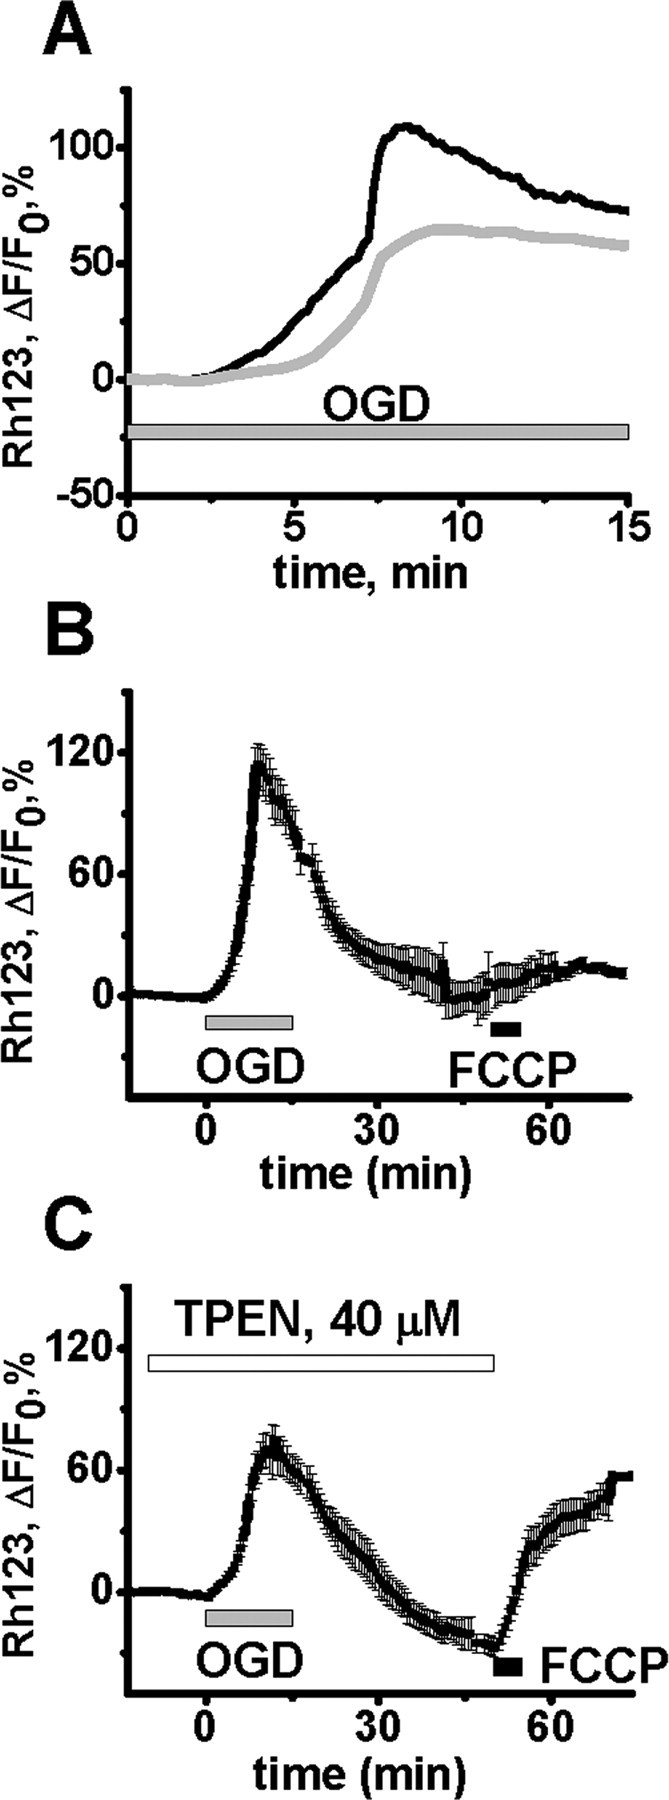
Zn2+ contributes to mitochondrial depolarization during OGD. Slices were bath loaded with the mitochondrial potential (ΔΨm)-sensitive indicator Rhodamine 123 (Rh123), and subjected to 15 min of OGD in the absence or presence of TPEN (40 μm). A, Trace shows representative OGD-induced Rh123 fluorescence changes in the CA1 pyramidal cell layer of a control slice (black), and one in which TPEN was present (gray). An increase in fluorescence indicates loss of ΔΨm. B, OGD induces a long lasting loss of ΔΨm. After 15 min OGD, slices were allowed to recover for 35 min before exposure to 5 μm FCCP, to directly induce loss of ΔΨm (peak ΔF/F0 during OGD, 107 ± 7.35%; peak increase after FCCP, 14.1 ± 4.7%, n = 6). C, TPEN improves recovery of ΔΨm after OGD. Slices were subjected to 15 min OGD as above but in the additional presence of TPEN, and 35 min later exposed to FCCP. The presence of TPEN resulted in a decreased peak ΔF/F0 during OGD (73 ± 6.96%, p < 0.01 vs no TPEN), and an increased response to FCCP (65.9 ± 7.2%, p < 0.01 vs no TPEN, n = 7), indicating a substantial recovery of ΔΨm after OGD. In B and C, traces show mean values ± SEM.
Interestingly, despite the acceleration of both the cytosolic Zn2+ accumulation and the Ca2+ deregulation after FCCP exposure, the interval between the onset of the Zn2+ rise and the Ca2+ deregulation was significantly increased (control, 2.1 ± 0.33 min; FCCP, 4.5 ± 0.59 min, n = 9 and 10 cells, p < 0.005). Furthermore, in the presence of FCCP, addition of TPEN did not significantly affect the time of Ca2+ deregulation (occurring at 5.5 ± 0.55 min, n = 4, 4 slices, 4 mice compared with 4.8 ± 0.38 min, n = 5 for matched in time control cells, 5 slices, 5 mice, p = 0.36), suggesting that in this case the acceleration of Ca2+ deregulation was not due to Zn2+, and thus was likely due to direct effects of FCCP on mitochondrial function. These data suggest that Zn2+ accumulation within the mitochondria may be more effective than cytosolic Zn2+ at triggering the Ca2+ deregulation, and thus lend support to functional significance of the mitochondrial Zn2+ accumulation.
Zn2+ contributes to a progressive mitochondrial depolarization during OGD
Rhodamine 123 (Rh123) was used to assess changes in ΔΨm during OGD (see Materials and Methods). During 15 min OGD exposures, an initial fluorescence increase began shortly after onset of OGD and was followed after several minutes by a distinct acceleration in fluorescence increase (Fig. 7A) (Bahar et al., 2000). Compared with control slices, TPEN significantly slowed the initial phase of the Rh123 fluorescence increase (ΔF/F0 increase from 2 to 5 min of 16.3 ± 3.21% in controls vs 8 ± 1.41% with TPEN, n = 9 and 9 slices, p < 0.05) and also decreased the peak ΔΨm changes (107.3 ± 7.35% in control, and 73.0 ± 6.96% with TPEN, n = 10 and 10, p < 0.01), but did not alter the time to peak ΔΨm change (8.8 ± 0.52, control, 9.0 ± 0.34, TPEN, p = 0.75) (Fig. 7B,C). Thus, Zn2+ appears to contribute to the initial loss of ΔΨm during OGD, consistent with evidence that it accumulates within mitochondria during OGD.
Finally, to address the ability of mitochondria to recover after a 15 min period of OGD, Rh123-loaded slices were allowed to recover for ∼35 min after OGD, and then exposed to FCCP, to directly induce a loss of ΔΨm. In control slices, there was little ΔΨm change after FCCP, suggesting that the mitochondria were already depolarized (Fig. 7B). However, in the slices exposed to OGD in the presence of TPEN, FCCP induced a substantial ΔF, suggesting that Zn2+ chelation during OGD permitted considerable recovery of the ΔΨm after OGD (Fig. 7C).
Discussion
Neuronal Zn2+ rises are early triggers of the ischemic neurodegenerative cascade
Although many past studies have highlighted critical roles of Ca2+ entry in the induction of ischemic neuronal injury, other studies have emphasized apparent contributions of Zn2+ (Tønder et al., 1990; Koh et al., 1996; Yin et al., 2002; Calderone et al., 2004), and have demonstrated early neuronal Zn2+ accumulation during OGD (Wei et al., 2004). Furthermore, as discussed above, it was recently suggested that Zn2+ might actually mediate some effects previously attributed to Ca2+ (Stork and Li, 2006).
The present study, which is the first to simultaneously track changes in Zn2+ and Ca2+ in single neurons in acute slice models of ischemia, helps reconcile previous studies focusing primarily on either Ca2+ or Zn2+, by clarifying their respective contributions to neuronal death. First, in line with previous observations that persistent high Ca2+ rises are linked to irreversible injury (Choi, 1992), we find that the occurrence of Ca2+ deregulation during OGD is temporally and causatively linked to a progressive increase in membrane permeability indicative of irreversible neuronal injury [see also Randall and Thayer (1992) and Vander Jagt et al. (2008)]. However, a key new finding of these studies is that somatic Zn2+ rises occur distinctly before, and contribute to the occurrence of the Ca2+ deregulation. Similar results have also been observed with NMDA stimulation of CA1 dendrites (Vander Jagt et al., 2009). Other findings indicate that the Zn2+ accumulation contributes (along with Ca2+) to the loss of synaptic transmission during acute OGD, and lend support to the idea that mitochondria are important sites of these early Zn2+ effects.
Discrimination of Zn2+ versus Ca2+ rises
The ability of many Ca2+ indicators to respond to Zn2+ has presented a challenge to efforts to examine changes in Ca2+ (as well as Zn2+) during slice OGD, an issue recently highlighted by studies suggesting that Zn2+ may actually account for much of the increase in signals of the indicator Calcium Green-1 (Stork and Li, 2006). A recent cell culture study provided precedent for the feasibility of dual indicator imaging to discriminate between Zn2+ and Ca2+ rises (Devinney et al., 2005), and present results, like another recent slice study (Dietz et al., 2008) support the utility of dual dye loading of single neurons to discriminate Zn2+ from Ca2+ responses in slice. First, since FluoZin-3 is highly selective for Zn2+ (Gee et al., 2002; Devinney et al., 2005), and the FluoZin-3 signal is markedly diminished by TPEN, it seems that the FluoZin-3 signal, which preceded the fura-6F signal is indeed due to Zn2+.
Although fura family indicators can respond to Zn2+ as well as to Ca2+, present results further support the contention that most of the fura-6F signals we observe are substantially due to Ca2+. This conclusion is supported by observations that the fura-6F signal (and subsequent membrane permeability increases) is qualitatively unchanged in the presence of TPEN exposures which substantially abolish the FluoZin-3 signal. However, we cannot rule out the possibility that Zn2+ could contribute to some of the fura-6F signals, perhaps particularly in the Ca2+-free ACSF experiments when loss of dominant effects of Ca2+ binding may reveal a significant contribution of Zn2+ to fura signals.
Early interaction of Zn2+ with mitochondria during OGD
Prior culture studies have indicated that exogenously applied Zn2+ can be taken up into and induce potent effects on mitochondria, including loss of ΔΨm, release of reactive oxygen species (ROS) and of apoptotic mediators (like cytochrome C), and induction of mitochondrial swelling (Sensi et al., 1999; Jiang et al., 2001; Dineley et al., 2005). Subsequent observations that oxidant-induced mobilization of endogenous Zn2+ already in neurons also can interfere with mitochondrial function (Sensi et al., 2003; Bossy-Wetzel et al., 2004) further support the idea that mitochondria may be important targets of Zn2+ in ischemia. This idea was considerably strengthened by recent in vivo ischemia studies in which Zn2+ appears to contribute to postischemic mitochondrial dysfunction. Pretreatment of animals with an extracellular Zn2+ chelator (Ca-EDTA) decreased cytosolic accumulation of the mitochondrial proapoptotic peptides, cytochrome C and Smac/DIABLO, 12 h after ischemia, and decreased consequent caspase-3 activation (Calderone et al., 2004). Zn2+ also appeared to contribute to the appearance of large multiconductance channels in mitochondrial outer membranes 1 h after ischemia via a mechanism involving cleavage of the anti-apoptotic BCL-2 family member, BCL-xL (Bonanni et al., 2006).
Present studies extend these observations in two ways. First, they suggest that Zn2+/mitochondria interactions occur very early in simulated ischemia. Indeed, the finding that cytosolic Zn2+ accumulation occurs within the first minute of OGD if FCCP is present highlights the rapidity of the Zn2+ accumulation and suggests that under normal conditions, Zn2+ is taken up by mitochondria and accumulates therein for several minutes before the occurrence of measurable cytosolic Zn2+ rises.
Second, the studies suggest that this early Zn2+ accumulation, occurring even in the absence of extracellular Ca2+, can trigger a cellular failure which, when sufficiently progressed, results in the occurrence of a lethal Ca2+ deregulation event. Although further studies will be necessary to firmly establish the mechanisms of this cellular failure, present studies suggest that mitochondria are likely involved. First, the finding that TPEN enhances recovery of ΔΨm after OGD indicates that Zn2+ contributes to a rapid induction of persistent mitochondrial dysfunction. In addition, although FCCP led to an acceleration of both the early cytosolic Zn2+ rise and the Ca2+ deregulation, it significantly increased the interval between these events. Thus, present data argue against a predominant contribution of cytosolic Zn2+ to the Ca2+ deregulation, and favor the idea that intramitochondrial Zn2+ plays a role in the triggering of Ca2+ deregulation, via a mechanism that may be mimicked by FCCP exposure. Such a role of Zn2+ is compatible with previous findings on isolated mitochondria indicating that with nanomolar exposures, Zn2+ can enter mitochondria through the Ca2+ uniporter, inhibit critical mitochondrial enzymes and induce mitochondrial depolarization and swelling, likely in part via activation of the mitochondrial permeability transition pore (mPTP) (Saris and Niva, 1994; Jiang et al., 2001; Gazaryan et al., 2002, 2007; Sensi et al., 2003; Dineley et al., 2005), and that polarized mitochondria can buffer large Ca2+ loads (Werth and Thayer, 1994; Wang and Thayer, 1996).
Synergistic and sequential contributions of Zn2+ and Ca2+ to ischemic sequelae
Present studies indicate that somatic Zn2+ rises precede the Ca2+ deregulation, and highlight distinct contributions of each of these ions in the degenerative events. First, chelation studies indicate that Zn2+ contributes to the triggering of the terminal Ca2+ deregulation. However, as TPEN only delays but does not prevent the Ca2+ deregulation (if Ca2+ is present) it is apparent that the cellular failure resulting in Ca2+ deregulation can be induced by Ca2+ in the absence of Zn2+. Conversely, the observation that Zn2+ chelation markedly delays terminal Ca2+ deregulation after OGD without Ca2+ indicates that such failure can also be induced by Zn2+ acting largely in the absence of Ca2+. In contrast to the effects of Zn2+, observations that Ca2+ deregulation and linked loss of membrane integrity occur only after Ca2+ replacement after prolonged OGD indicates that Ca2+ plays a critical role in these terminal events, perhaps via activation of Ca2+-dependent catabolic enzymes (Siesjö, 1992). These conclusions as to respective roles of Zn2+ and Ca2+ are compatible with recent studies of events occurring during prolonged NMDA stimulation of slices (Vander Jagt et al., 2008, 2009).
Studies of the ionic dependence of synaptic failure after OGD show a similar cooperativity of these two ions, with Zn2+ removal alone permitting recovery after a shorter OGD (10 min) but combined removal of Zn2+ and Ca2+ (but not removal of either one alone) permitting recovery after longer (15 min) OGD.
Conclusion/future directions
Present studies provide new insights into the interactions between Zn2+ and Ca2+ in the triggering of acute ischemic neurodegeneration. Specifically, Zn2+ accumulates in neurons soon after the onset of ischemia, is taken up into mitochondria, and contributes to the dysfunction of these organelles as well as to events closely linked to the degenerative process including SD (see Dietz et al., 2008) and Ca2+ deregulation. In contrast, the Ca2+ deregulation is linked to an increase in membrane permeability.
However, important questions remain. One concerns the sources of the Zn2+ and their respective contributions to injury (Weiss et al., 2000; Yin et al., 2002; Lee et al., 2003). Another is the characterization of downstream injury pathways activated after cytosolic Zn2+ accumulation. Whereas present studies provide new evidence for a significant early interaction of Zn2+ with mitochondria, other studies have implicated diverse mechanisms including NADPH oxidase induction and PARP activation (Kim and Koh, 2002), K+ current-triggered apoptosis (McLaughlin et al., 2001), and increases in numbers of Ca2+- and Zn2+-permeable AMPA channels (Calderone et al., 2004; Noh et al., 2005) in delayed Zn2+-dependent neurodegeneration. Further understanding of the sources and targets of early Zn2+ accumulation and the linkage of these early events to downstream injury mechanisms should suggest improved approaches for ischemic neuroprotection.
Footnotes
This work was supported by National Institutes of Health Grants T32 NS45540 (Y.V.M.), NS36548 (J.H.W.), and NS051288 (C.W.S.). We thank Robert Dietz for performing initial experiments testing the effects of TPEN on Rh123 fluorescence signals and Thomas Vander Jagt for initial fura-6F/FluoZin-3 measurements during OGD, which motivated the studies described in this manuscript. We also thank Stefano Sensi for productive discussions.
References
- Arslan P, Di Virgilio F, Beltrame M, Tsien RY, Pozzan T. Cytosolic Ca2+ homeostasis in Ehrlich and Yoshida carcinomas. A new, membrane-permeant chelator of heavy metals reveals that these ascites tumor cell lines have normal cytosolic free Ca2+ J Biol Chem. 1985;260:2719–2727. [PubMed] [Google Scholar]
- Bahar S, Fayuk D, Somjen GG, Aitken PG, Turner DA. Mitochondrial and intrinsic optical signals imaged during hypoxia and spreading depression in rat hippocampal slices. J Neurophysiol. 2000;84:311–324. doi: 10.1152/jn.2000.84.1.311. [DOI] [PubMed] [Google Scholar]
- Bonanni L, Chachar M, Jover-Mengual T, Li H, Jones A, Yokota H, Ofengeim D, Flannery RJ, Miyawaki T, Cho CH, Polster BM, Pypaert M, Hardwick JM, Sensi SL, Zukin RS, Jonas EA. Zinc-dependent multi-conductance channel activity in mitochondria isolated from ischemic brain. J Neurosci. 2006;26:6851–6862. doi: 10.1523/JNEUROSCI.5444-05.2006. [DOI] [PMC free article] [PubMed] [Google Scholar]
- Bossy-Wetzel E, Talantova MV, Lee WD, Schölzke MN, Harrop A, Mathews E, Götz T, Han J, Ellisman MH, Perkins GA, Lipton SA. Crosstalk between nitric oxide and zinc pathways to neuronal cell death involving mitochondrial dysfunction and p38-activated K(+) channels. Neuron. 2004;41:351–365. doi: 10.1016/s0896-6273(04)00015-7. [DOI] [PubMed] [Google Scholar]
- Brown AM, Kristal BS, Effron MS, Shestopalov AI, Ullucci PA, Sheu KF, Blass JP, Cooper AJ. Zn2+ inhibits alpha-ketoglutarate-stimulated mitochondrial respiration and the isolated alpha-ketoglutarate dehydrogenase complex. J Biol Chem. 2000;275:13441–13447. doi: 10.1074/jbc.275.18.13441. [DOI] [PubMed] [Google Scholar]
- Calderone A, Jover T, Mashiko T, Noh KM, Tanaka H, Bennett MV, Zukin RS. Late calcium EDTA rescues hippocampal CA1 neurons from global ischemia-induced death. J Neurosci. 2004;24:9903–9913. doi: 10.1523/JNEUROSCI.1713-04.2004. [DOI] [PMC free article] [PubMed] [Google Scholar]
- Cheng C, Reynolds IJ. Calcium-sensitive fluorescent dyes can report increases in intracellular free zinc concentration in cultured forebrain neurons. J Neurochem. 1998;71:2401–2410. doi: 10.1046/j.1471-4159.1998.71062401.x. [DOI] [PubMed] [Google Scholar]
- Choi DW. Excitotoxic cell death. J Neurobiol. 1992;23:1261–1276. doi: 10.1002/neu.480230915. [DOI] [PubMed] [Google Scholar]
- Devinney MJ, 2nd, Reynolds IJ, Dineley KE. Simultaneous detection of intracellular free calcium and zinc using fura-2FF and FluoZin-3. Cell Calcium. 2005;37:225–232. doi: 10.1016/j.ceca.2004.10.003. [DOI] [PubMed] [Google Scholar]
- Dietz RM, Weiss JH, Shuttleworth CW. Zn2+ influx is critical for some forms of spreading depression in brain slices. J Neurosci. 2008;28:8014–8024. doi: 10.1523/JNEUROSCI.0765-08.2008. [DOI] [PMC free article] [PubMed] [Google Scholar]
- Dineley KE, Votyakova TV, Reynolds IJ. Zinc inhibition of cellular energy production: implications for mitochondria and neurodegeneration. J Neurochem. 2003;85:563–570. doi: 10.1046/j.1471-4159.2003.01678.x. [DOI] [PubMed] [Google Scholar]
- Dineley KE, Richards LL, Votyakova TV, Reynolds IJ. Zinc causes loss of membrane potential and elevates reactive oxygen species in rat brain mitochondria. Mitochondrion. 2005;5:55–65. doi: 10.1016/j.mito.2004.11.001. [DOI] [PubMed] [Google Scholar]
- Dohmen C, Sakowitz OW, Fabricius M, Bosche B, Reithmeier T, Ernestus RI, Brinker G, Dreier JP, Woitzik J, Strong AJ, Graf R. Spreading depolarizations occur in human ischemic stroke with high incidence. Ann Neurol. 2008;63:720–728. doi: 10.1002/ana.21390. [DOI] [PubMed] [Google Scholar]
- Duchen MR, Surin A, Jacobson J. Imaging mitochondrial function in intact cells. Methods Enzymol. 2003;361:353–389. doi: 10.1016/s0076-6879(03)61019-0. [DOI] [PubMed] [Google Scholar]
- Frederickson CJ, Hernandez MD, McGinty JF. Translocation of zinc may contribute to seizure-induced death of neurons. Brain Res. 1989;480:317–321. doi: 10.1016/0006-8993(89)90199-6. [DOI] [PubMed] [Google Scholar]
- Gazaryan IG, Krasnikov BF, Ashby GA, Thorneley RN, Kristal BS, Brown AM. Zinc is a potent inhibitor of thiol oxidoreductase activity and stimulates reactive oxygen species production by lipoamide dehydrogenase. J Biol Chem. 2002;277:10064–10072. doi: 10.1074/jbc.M108264200. [DOI] [PubMed] [Google Scholar]
- Gazaryan IG, Krasinskaya IP, Kristal BS, Brown AM. Zinc irreversibly damages major enzymes of energy production and antioxidant defense prior to mitochondrial permeability transition. J Biol Chem. 2007;282:24373–24380. doi: 10.1074/jbc.M611376200. [DOI] [PubMed] [Google Scholar]
- Gee KR, Zhou ZL, Ton-That D, Sensi SL, Weiss JH. Measuring zinc in living cells. A new generation of sensitive and selective fluorescent probes. Cell Calcium. 2002;31:245–251. doi: 10.1016/S0143-4160(02)00053-2. [DOI] [PubMed] [Google Scholar]
- Hoskison MM, Shuttleworth CW. Microtubule disruption, not calpain-dependent loss of MAP2, contributes to enduring NMDA-induced dendritic dysfunction in acute hippocampal slices. Exp Neurol. 2006;202:302–312. doi: 10.1016/j.expneurol.2006.06.010. [DOI] [PubMed] [Google Scholar]
- Jiang D, Sullivan PG, Sensi SL, Steward O, Weiss JH. Zn(2+) induces permeability transition pore opening and release of pro-apoptotic peptides from neuronal mitochondria. J Biol Chem. 2001;276:47524–47529. doi: 10.1074/jbc.M108834200. [DOI] [PubMed] [Google Scholar]
- Kim YH, Koh JY. The role of NADPH oxidase and neuronal nitric oxide synthase in zinc-induced poly(ADP-ribose) polymerase activation and cell death in cortical culture. Exp Neurol. 2002;177:407–418. doi: 10.1006/exnr.2002.7990. [DOI] [PubMed] [Google Scholar]
- Koh JY, Suh SW, Gwag BJ, He YY, Hsu CY, Choi DW. The role of zinc in selective neuronal death after transient global cerebral ischemia. Science. 1996;272:1013–1016. doi: 10.1126/science.272.5264.1013. [DOI] [PubMed] [Google Scholar]
- Lee JY, Kim JH, Palmiter RD, Koh JY. Zinc released from metallothionein-iii may contribute to hippocampal CA1 and thalamic neuronal death following acute brain injury. Exp Neurol. 2003;184:337–347. doi: 10.1016/s0014-4886(03)00382-0. [DOI] [PubMed] [Google Scholar]
- Link TA, von Jagow G. Zinc ions inhibit the QP center of bovine heart mitochondrial bc1 complex by blocking a protonatable group. J Biol Chem. 1995;270:25001–25006. doi: 10.1074/jbc.270.42.25001. [DOI] [PubMed] [Google Scholar]
- Lipski J, Park TI, Li D, Lee SC, Trevarton AJ, Chung KK, Freestone PS, Bai JZ. Involvement of TRP-like channels in the acute ischemic response of hippocampal CA1 neurons in brain slices. Brain Res. 2006;1077:187–199. doi: 10.1016/j.brainres.2006.01.016. [DOI] [PubMed] [Google Scholar]
- Lobner D, Lipton P. Intracellular calcium levels and calcium fluxes in the CA1 region of the rat hippocampal slice during in vitro ischemia: relationship to electrophysiological cell damage. J Neurosci. 1993;13:4861–4871. doi: 10.1523/JNEUROSCI.13-11-04861.1993. [DOI] [PMC free article] [PubMed] [Google Scholar]
- Manev H, Kharlamov E, Uz T, Mason RP, Cagnoli CM. Characterization of zinc-induced neuronal death in primary cultures of rat cerebellar granule cells. Exp Neurol. 1997;146:171–178. doi: 10.1006/exnr.1997.6510. [DOI] [PubMed] [Google Scholar]
- McLaughlin B, Pal S, Tran MP, Parsons AA, Barone FC, Erhardt JA, Aizenman E. p38 activation is required upstream of potassium current enhancement and caspase cleavage in thiol oxidant-induced neuronal apoptosis. J Neurosci. 2001;21:3303–3311. doi: 10.1523/JNEUROSCI.21-10-03303.2001. [DOI] [PMC free article] [PubMed] [Google Scholar]
- Nicholls DG, Budd SL. Mitochondria and neuronal survival. Physiol Rev. 2000;80:315–360. doi: 10.1152/physrev.2000.80.1.315. [DOI] [PubMed] [Google Scholar]
- Noh KM, Yokota H, Mashiko T, Castillo PE, Zukin RS, Bennett MV. Blockade of calcium-permeable AMPA receptors protects hippocampal neurons against global ischemia-induced death. Proc Natl Acad Sci U S A. 2005;102:12230–12235. doi: 10.1073/pnas.0505408102. [DOI] [PMC free article] [PubMed] [Google Scholar]
- Randall RD, Thayer SA. Glutamate-induced calcium transient triggers delayed calcium overload and neurotoxicity in rat hippocampal neurons. J Neurosci. 1992;12:1882–1895. doi: 10.1523/JNEUROSCI.12-05-01882.1992. [DOI] [PMC free article] [PubMed] [Google Scholar]
- Rothman SM, Olney JW. Glutamate and the pathophysiology of hypoxic–ischemic brain damage. Ann Neurol. 1986;19:105–111. doi: 10.1002/ana.410190202. [DOI] [PubMed] [Google Scholar]
- Saris NE, Niva K. Is Zn2+ transported by the mitochondrial calcium uniporter? FEBS Lett. 1994;356:195–198. doi: 10.1016/0014-5793(94)01256-3. [DOI] [PubMed] [Google Scholar]
- Sensi SL, Yin HZ, Carriedo SG, Rao SS, Weiss JH. Preferential Zn2+ influx through Ca2+-permeable AMPA/kainate channels triggers prolonged mitochondrial superoxide production. Proc Natl Acad Sci U S A. 1999;96:2414–2419. doi: 10.1073/pnas.96.5.2414. [DOI] [PMC free article] [PubMed] [Google Scholar]
- Sensi SL, Ton-That D, Weiss JH. Mitochondrial sequestration and Ca(2+)-dependent release of cytosolic Zn(2+) loads in cortical neurons. Neurobiol Dis. 2002;10:100–108. doi: 10.1006/nbdi.2002.0493. [DOI] [PubMed] [Google Scholar]
- Sensi SL, Ton-That D, Sullivan PG, Jonas EA, Gee KR, Kaczmarek LK, Weiss JH. Modulation of mitochondrial function by endogenous Zn2+ pools. Proc Natl Acad Sci U S A. 2003;100:6157–6162. doi: 10.1073/pnas.1031598100. [DOI] [PMC free article] [PubMed] [Google Scholar]
- Shuttleworth CW, Connor JA. Strain-dependent differences in calcium signaling predict excitotoxicity in murine hippocampal neurons. J Neurosci. 2001;21:4225–4236. doi: 10.1523/JNEUROSCI.21-12-04225.2001. [DOI] [PMC free article] [PubMed] [Google Scholar]
- Siesjö BK. Historical overview. Calcium, ischemia, and death of brain cells. Ann N Y Acad Sci. 1988;522:638–661. doi: 10.1111/j.1749-6632.1988.tb33410.x. [DOI] [PubMed] [Google Scholar]
- Siesjö BK. Pathophysiology and treatment of focal cerebral ischemia. Part II: Mechanisms of damage and treatment. J Neurosurg. 1992;77:337–354. doi: 10.3171/jns.1992.77.3.0337. [DOI] [PubMed] [Google Scholar]
- Skulachev VP, Chistyakov VV, Jasaitis AA, Smirnova EG. Inhibition of the respiratory chain by zinc ions. Biochem Biophys Res Commun. 1967;26:1–6. doi: 10.1016/0006-291x(67)90242-2. [DOI] [PubMed] [Google Scholar]
- Stork CJ, Li YV. Intracellular zinc elevation measured with a “calcium-specific” indicator during ischemia and reperfusion in rat hippocampus: a question on calcium overload. J Neurosci. 2006;26:10430–10437. doi: 10.1523/JNEUROSCI.1588-06.2006. [DOI] [PMC free article] [PubMed] [Google Scholar]
- Tanaka E, Yamamoto S, Kudo Y, Mihara S, Higashi H. Mechanisms underlying the rapid depolarization produced by deprivation of oxygen and glucose in rat hippocampal CA1 neurons in vitro. J Neurophysiol. 1997;78:891–902. doi: 10.1152/jn.1997.78.2.891. [DOI] [PubMed] [Google Scholar]
- Tønder N, Johansen FF, Frederickson CJ, Zimmer J, Diemer NH. Possible role of zinc in the selective degeneration of dentate hilar neurons after cerebral ischemia in the adult rat. Neurosci Lett. 1990;109:247–252. doi: 10.1016/0304-3940(90)90002-q. [DOI] [PubMed] [Google Scholar]
- Vander Jagt TA, Connor JA, Shuttleworth CW. Localized loss of Ca2+ homeostasis in neuronal dendrites is a downstream consequence of metabolic compromise during extended NMDA exposures. J Neurosci. 2008;28:5029–5039. doi: 10.1523/JNEUROSCI.5069-07.2008. [DOI] [PMC free article] [PubMed] [Google Scholar]
- Vander Jagt TA, Connor JA, Weiss JH, Shuttleworth CW. Intracellular Zn2+ increases contribute to the progression of excitotoxic Ca2+ increases in apical dendrites of CA1 pyramidal neurons. Neuroscience. 2009 doi: 10.1016/j.neuroscience.2008.11.052. [DOI] [PMC free article] [PubMed] [Google Scholar]
- Wang GJ, Thayer SA. Sequestration of glutamate-induced Ca2+ loads by mitochondria in cultured rat hippocampal neurons. J Neurophysiol. 1996;76:1611–1621. doi: 10.1152/jn.1996.76.3.1611. [DOI] [PubMed] [Google Scholar]
- Wei G, Hough CJ, Li Y, Sarvey JM. Characterization of extracellular accumulation of Zn2+ during ischemia and reperfusion of hippocampus slices in rat. Neuroscience. 2004;125:867–877. doi: 10.1016/j.neuroscience.2004.03.011. [DOI] [PubMed] [Google Scholar]
- Weiss JH, Sensi SL, Koh JY. Zn(2+): a novel ionic mediator of neural injury in brain disease. Trends Pharmacol Sci. 2000;21:395–401. doi: 10.1016/s0165-6147(00)01541-8. [DOI] [PubMed] [Google Scholar]
- Werth JL, Thayer SA. Mitochondria buffer physiological calcium loads in cultured rat dorsal root ganglion neurons. J Neurosci. 1994;14:348–356. doi: 10.1523/JNEUROSCI.14-01-00348.1994. [DOI] [PMC free article] [PubMed] [Google Scholar]
- Yin HZ, Sensi SL, Ogoshi F, Weiss JH. Blockade of Ca2+-permeable AMPA/kainate channels decreases oxygen-glucose deprivation-induced Zn2+ accumulation and neuronal loss in hippocampal pyramidal neurons. J Neurosci. 2002;22:1273–1279. doi: 10.1523/JNEUROSCI.22-04-01273.2002. [DOI] [PMC free article] [PubMed] [Google Scholar]