Abstract
Drug delivery to mucosal epithelia is severely limited by the mucus gel, which is a physical diffusion barrier as well as an enzymatic barrier in some sites. Loading of drug into polymer particles can protect drugs from degradation and enhance their stability. To improve efficacy of nanoparticulate drug carriers, it has been speculated that polymers such as poly(ethylene)glycol (PEG) incorporated on the particle surface will enhance transport in mucus. In the present study, we demonstrate the direct influence of PEG on surface properties of poly(lactic-co-glycolic)acid (PLGA) nanoparticles (d = 170 ± 57 nm). PEG of various molecular weights (MW = 2, 5, 10 kDa) were incorporated at a range of densities from 5 – 100% on the particle surface. Our results indicate PEG addition improves dispersion, neutralize charge, and enhance particle diffusion in cervical mucus in a manner strongly dependent on polymer MW and density. Diffusion of PEGylated particles was 3 – 10× higher than unmodified PLGA particles. These findings improve the understanding of, and confirm a possible direction for, the rational design of effective carriers for mucosal drug/vaccine delivery.
Keywords: mucosal transport, diffusion model, polymer nanoparticles, surface modification, stealth, drug delivery, mucin
Introduction
Efficiency of mucosal drug delivery is often limited by the mucus gel layer, a physical barrier separating the external environment and the body’s epithelial cells. The mucus gel consists mostly of linear, glycosylated mucin fibers that entangles into a dense network.1, 2 The mucin fibers’ composition (variable arrangement of hydrophobic serine-rich regions along backbone, heavily decorated with branching glycosaccharides in a bottle-brush configuration) allows it to form strong interactions with foreign molecules to inhibit or severely hinder their migration into the gel.3, 4 To achieve efficient drug delivery across the mucus gel, a drug carrier that quickly penetrates through the mucus gel offers clear advantages. Fast-diffusing carriers, which can avoid entrapment by mucus gel, should be available at higher quantities to be taken up by the underlining epithelium. In contrast, slow-diffusing drug carriers, while having better tissue-retention time (i.e. mucoadhesive), are not particularly useful when the drug target is within the host.
Fast transport through the mucus gel enables virus-like particles (VLPs) to transfect epithelial cells with higher efficiency than lipoplexes.5, 6 This stealth behavior of virus is attributed to the small size and net-neutral property of the viral capsid that allows the virus to easily negotiate the mucin fiber mesh while avoiding entrapment by size-occlusion (i.e. particle too large to pass through fibrous network) or ionic interactions (i.e. particles that adhere to mucin by charge.) A number of studies have shown that VLPs can diffuse quickly through mucus. Olmsted et al. reported essentially unhindered diffusion of small Norwalk and human papilloma virus (d = 38 – 55 nm) in human cervical mucus, while a larger virus particle, herpes simplex virus (d = 100 nm), exhibited some interaction with mucin and diffused slowly. Furthermore, the same study showed that polystyrene particles do not diffuse even for the smallest particle size (d = 59 – 1000 nm) due to their strong interaction with mucin fibers.7
Surface modification of polymer particles using poly(ethylene)glycol (PEG) to mimic virus-like diffusion for better transport/delivery through the mucosa has been demonstrated. This approach emulates ‘stealth’ migration of viruses that infect mucosal tissues, which avoid entrapment in the gel by minimizing strong interactions with mucus constituents. A recent study demonstrated that conjugation of PEG to COOH-functionalized polystyrene particles increased their diffusion in cervical mucus. Interestingly, particle effective diffusion coefficient in mucus compared with that in water, Dmuc/Dw, was enhanced more so for larger PEGylated 200nm and 500 nm particles than for smaller 100 nm particles.8
The above studies using virus and polystyrene particles emphasize the importance of reduced surface interactions in improving particle diffusion in mucus; however, these systems are not easily adapted for clinical drug delivery. Poly(lactic-co-glycolic)acid (PLGA) nanoparticles with chemically modifiable surfaces are biocompatible, degradable, and capable of drug encapsulation and controlled release, making them potential carriers for safe and efficient drug delivery. Encapsulation of drugs into particles protects them from premature degradation, an important function since mucus-protected tissues such as the nasal, oral, gastrointestinal and reproductive tracts are typically harsh environments with low pH and abundant digestive enzymes. Nanoparticles also act as reservoirs that can release their payload in a controlled manner, to sustain in vivo therapeutic dose over longer periods of time than drugs administered in bolus.9, 10 Furthermore, byproducts from PLGA degradation are natural substrate for cell metabolic processes, and sidestep the need for removing spent particles from the body.
Creating copolymers of PEG with PLA or PLGA, or by simple adsorption onto formed particles, can significantly alter properties of the polymer shell such as produce a smaller effective particle size and neutralize surface charge.11–15 While PEG modification is a promising approach for producing stealth polymer particles, there has not yet been a controlled and systematic study of PEG’s effect on the surface properties of PLGA nanoparticles (or any drug-loaded particles) and their diffusion in mucus gel. In the present study, we utilize PLGA particles that are loaded with agents and functionalized with avidin on the surface, forming a versatile and stable platform that allows binding of biotinylated molecules. The avidin platform allows: 1) strong/irreversible surface-presentation of biotinylated PEG of any molecular weight at easily controlled density and 2) quantification of PEG concentration on the particle by secondary probes.
Here, we investigated the dispersion properties, surface charge, and binding of particles to mucin fibers as a function of PEG density and molecular weight on the surface of tracer-loaded nanoparticles. Particle diffusion in human cervical mucus was observed by fluorescent microscopy, and Dmuc obtained by fitting the particle concentration profiles to a mass transport model. Based on our findings on the relationship between particle surface properties and their diffusion in mucus gel, we proposed a general mechanism that may help facilitate the understanding and development of carriers for mucosal drug delivery.
Materials and Methods
Formulation of nanoparticles and biotinylated PEG
Palmitate-avidin conjugates were made and incorporated to surface of 50/50 PLGA nanoparticles as previously described.16 Coumarin6 dye (Acros Organics) were added to the polymer solution prior to emulsion at 0.25 μg dye/mg PLGA. Biotin was conjugated to single amine-terminated 2, 5 and 10 kDa PEG (Sigma) with the EZ-Link Sulfo-NHS-LC-Biotin kit (Pierce).
Quantification of avidin on particle surface
Avidin-coated particles (Avid-NP) were suspended in 1x PBS at pH7, at concentration 5 mg/ml. Triplicate of particle suspension were assayed for protein content using the microBCA assay (Pierce) according to manufacturer protocol. Uncoated particles (NP) were used as negative control. Following 2 hr incubation at 37 °C, particles were pelleted by centrifugation. The supernatant was transferred to a new plate and absorbance read at 562 nm. The total amount of proteins (μg avidin/mg particle) was determined using standard curve made by known concentration of protein.
Calculation of avidin molecule per nanoparticle surface
The number of avidin per mg particle (#avidin/mg) was calculated from the results of a microBCA assay, avidin MW (68 kDa) and Avogadro’s number (Value1). The mass of an average particle (diameter = 170 nm) was calculated using an estimated PLGA density of 1.2 g/cm3, which was then used to calculate the number of individual particles in 1 mg (Value2). Finally, the number of avidin molecules per individual particle (Value3) was obtained by dividing Value1 by Value2, as follows:
PEG coating and HPR assay
Biotinylated PEG was added to particles at 0.5 mg/ml in 1x PBS pH7 at a range of PEG percentage to total avidin present in sample, assuming 4 maximum biotin binding site per avidin molecule. Following 1 hr incubation at room temperature, under constant gentle agitation, particles are washed 3 times in 1 x PBS. Next, bHRP was added at 10x molar excess and incubated for 30 min at room temperature, followed by 3 washes in 1x PBS. Particles were analyzed under AmplexRed Peroxidase assay (Molecular Probes) according to manufacturer protocol. Total bHRP signal on each particle sample was normalized to signal of avidin-coated particles with bHRP on the surface. Uncoated particles (NP) were also used as negative control.
Particle sizing
SEM image of dried particles mounted on carbon tape were obtained by first sputter-coating with Au at 30s (Cressington). Imaging was conducted with a 5 kV electron beam, spot size 3. The particle diameter were obtained through ImageJ software (developed by Wayne Rasband, NIH), and the size distribution is reported for a population of n = 495–497.
Particle size in aqueous media was obtained by first suspending particles in DI water at pH7. The particles were analyzed by dynamic light scattering (Brookhaven Instruments Corp). The combined mean and spread of particle diameter was reported from a total of 10 runs, each at 0.5 min.
Measurement of Zeta-potential
The surface zeta-potential of particles were analyzed with Zeta-Potential Analyzer (Brookhaven Instrument Corp). The particle mobility was reported from a total of 10 runs, each at 0.5 min, and fitted to a Smoluchowsky model with residual error < 0.035 to obtain surface zeta-potential.
Particle binding to mucin
Porcine gastric mucin (MP Biomedicals) hydrated in DI water by gentle end-to-end rotation for 4 hrs at room temperature were deposited onto a nitrocellulose membrane (Invitrogen). The droplets were dried at room temperature and baked at 80 °C for 3 hrs. Each dried droplets were cut out and submerged in particle solution (0.5 mg/ml DI water). Following 30 min incubation at room temperature, the droplets were dried and mounted on a glass microscope slide. Five images were taken from each droplet, using a 10x objective, which account for >85% of the total droplet surface area.
The green fluorescence from Coumarin 6 particles was used to quantify binding. Briefly, threshold of fluorescence was performed by ImageJ. The fraction of total area occupied by fluorescence particles (i.e. area fraction) was obtained for the entire mucin droplet (combined 5 images). The total fraction area for 30 droplets per particle sample was reported (n = 30).
Visualization of NP diffusion in cervical mucus
Particles in 1x PBS at 0.5 mg/ml were added to capillary borosilicate glass tubing (Vitrocom) filled with fresh human cervical mucus and sealed with Critoseal (Krackeler Scientific). Fluorescence profile of the mucus/solution interface was immediately taken with a Zeiss microscope under green fluorescent filter using 20x objective and recorded as time 0. The entire tube was kept stationary and in the dark until the next measurement. Fluorescence intensity profile from interface was taken using ImageJ software with the length scale calibrated to a known distance. Background fluorescence was subtracted and the entire profile normalized to maximum intensity. Three sample curves were taken for each tube at given time point, two tubes (duplicates) were used for each particle sample (total n = 6).
Calculation of Diffusion Coefficients
Particle diffusion coefficient in water (Dw) were calculated using the Stoke-Einstein equation for particle population with r = 85 nm:
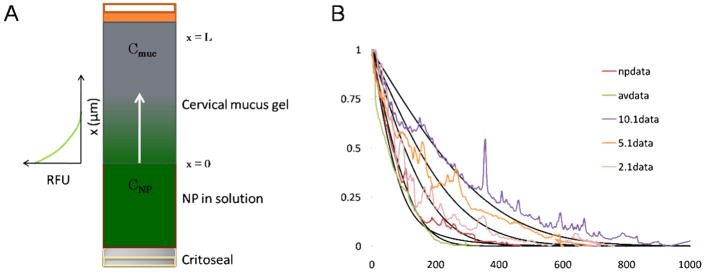
A schematic of the experimental setup to obtain the diffusion coefficient of particles in cervical mucus is shown in Figure 1A. Fluorescent profile of particles from the mucus-solution interface into the gel was recorded and fitted to a solution to diffusion model based on Fickian mass transport in a semi-infinite medium using numerical integration by finite difference method (Figure 1B). The setup and mathematical methods to solve for sample diffusion coefficients are described in detail by Radomsky et al., where diffusion of various fluorescently-labeled probes, antibodies and proteins was similarly observed in human cervical mucus.17
Figure 1.
Diffusion of NP, provided in solution, into human cervical mucus was observed in glass capillary tube (A). The fluorescence profile recorded from the interface (x=0) at some time, t, was fitted to a Fickian diffusion model of solute in a semi-infinite medium by finite element method (B).
The measured diffusion profile was fitted to the following governing equation, commonly known as Fick’s 2nd law:
where the spread of particle concentration over time ( ) depends on its effective diffusion coefficient (D, in this case representing Deff or Dmuc) and the second derivative of the concentration ( ). We apply the following boundary and initial conditions that pertain to the governing equation:
To solve for Deff (or Dmuc), finite difference analysis method was performed on non-dimensionalized form of each measurements (time, distance and fluorescence intensity,
Using fluorescent profile taken at t=0, we constructed a model profile at time t by incremental dt, using D. Δt and Δx was chosen to maintain model stability regime:
Statistical analysis
One-way analysis of variance (ANOVA) was performed on diffusion data for partially PEGylated particles, and student t-test was used to compare partially PEGylated to fully PEGylated particles. For both tests, statistical significance was determined using α=0.05.
Results
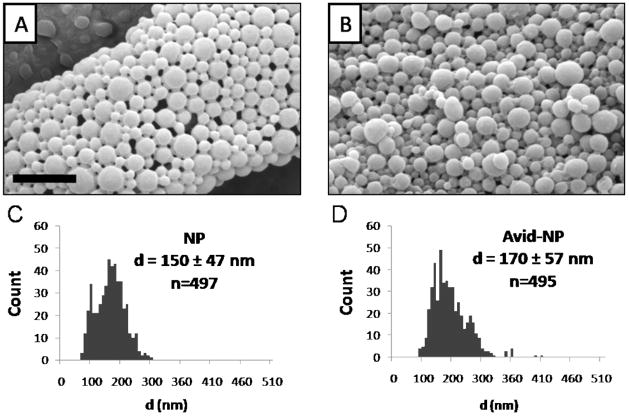
PLGA nanoparticles with diameter 170 ± 57 nm were loaded with green-fluorescent Coumarin 6 molecules (Figure 2). Avidin was incorporated onto the particle surface by first conjugating avidin to palmitic acid, and adding the conjugate to the aqueous phase of the emulsion. This method produces a dense and stable avidin coating on PLGA surface that is facilitated by hydrophobic forces between fatty acid and lactic monomers on PLGA.16 The total avidin content was quantified per mass of particle sample: we calculated ~ 420 avidin molecules on the surface of each particle.
Figure 2.
PLGA particles (NP) and Avidin-coated particles (Avid-NP) appeared spherical with smooth morphology as seen under SEM microscope (A, B). The unhydrated particle diameter distribution, as measured by imageJ, ranged from 150 – 170 nm (C, D). Scale bar = 1 μm.
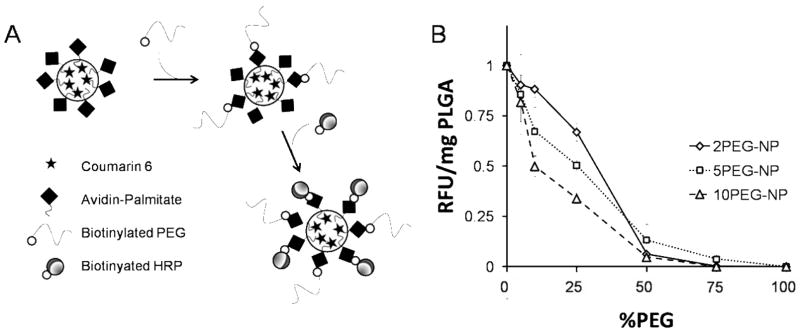
Biotinylated PEG of 2, 5 and 10 kDa molecular weight was introduced to particle samples at 5–100% PEG/(total avidin binding sites) in sample, assuming a maximum of 4 biotin binding sites for each tetrameric avidin molecule. After PEGylation, biotinylated horseradish peroxidase (bHRP) was added to the particles (Figure 3A). Peroxidase activity per mg particle (RFU/mg PLGA) is a measurement of the accessible biotin binding sites on avidin that are unhindered by presence of PEG on the particle surface. bHRP signal showed clear dependence on PEG coating density and molecular weight (Figure 3B). Higher MW PEG was more effective in preventing HRP binding at similar coating percentage compared to shorter PEG. The magnitude of hindrance increased with PEG length, as expected. Interestingly, peroxidase signal uniformly decreased at 50% for all samples, which correlates to an average of 2 bound PEG per avidin molecule. Six distinct particle preparations—in which the MW and density of PEG varied—were produced (Table 1).
Figure 3.
Avid-NP, encapsulating Coumarin 6, was biotinylated with PEG 2, 5 and 10 kDa at various surface densities. Following PEG binding, biotinylated HRP was used to probe the accessible avidin binding sites (A). Peroxidase assay showed a gradual reduction of normalized HRP signal (RFU/mg PLGA) as a result of increased %PEG on the particle surface. In addition, longer PEG length appeared more effective at inhibiting bHRP interaction on the surface (10 > 5 >2 kDa). The total binding uniformly decreased at 50%, suggesting an average of 2 available binding sites per avidin molecule (B).
Table 1.
Particle compositions and corresponding diffusion coefficients. The particle nomenclature indicates both PEG MW and surface density. For example, 2PEG-NP are particles with a full coating of PEG with MW 2 kDa and 2.1PEG-NP are particles with a 10% coating of PEG with MW 2 kDa.
| PEG (kDa) | %PEG | Dmuc (10−9 cm2/s) | Dmuc/Dw | |
|---|---|---|---|---|
| NP | 0 | 0 | 2.5±0.5 | 0.08 |
| Avid-NP | 0 | 0 | 4.2±5 | 0.13 |
| 2PEG-NP | 2 | 100 | 26.45± 3.9 | 0.81 |
| 2.1PEG-NP | 2 | 10 | 7.9± 3.5 | 0.24 |
| 5PEG-NP | 5 | 100 | 20.8±7.5 | 0.64 |
| 5.1PEG-NP | 5 | 10 | 15.6±1.6 | 0.44 |
| 10PEG-NP | 10 | 100 | -- | -- |
| 10.1PEG-NP | 10 | 10 | 25.0±7.1 | 0.76 |
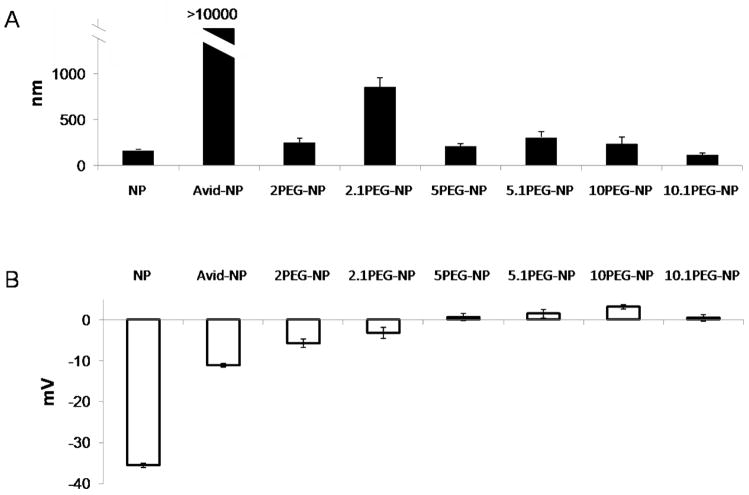
The particle surface charge and size distribution in aqueous media were assessed with dynamic light-scattering (Figure 4). The majority (> 90%) of PLGA particles (NP) and most PEGylated particles were 100 – 400 nm in diameter. Particles partially coated with 5 and 10 kDa PEG at 10% total binding (10% of total avidin molecules present, or ~ 42 PEG/particle) were also small in size. Some aggregation (d = 800 – 1100 nm) was exhibited by 2 kDa PEG coating at 10% density (2.1PEG-NP) and the highest aggregation appeared in avidin-only particles at d >10,000 nm (Figure 4A). PLGA particles without avidin or PEG possess strong negative surface potential (−35.6 ± 0.56 mV) due to presence of poly(vinyl)alcohol (PVA), which was introduced as a stabilizer during particle formulation. Addition of avidin significantly reduced this surface charge to −11.3 ± 0.41 mV, and PEGylated particles registered a weak, unstable surface charge that was close to neutral at −5.6 to +3.5 mV (Figure 4B).
Figure 4.
Dynamic light scattering of particle in water revealed the majority of unmodified NP and PEGylated particles (>90%) are relatively mono-dispersed, with radius between 100 – 400 nm (A). Partially PEGylated particles (2 kDa at 10% coating) exhibited some aggregation resulting in larger particles with diameter 800 – 1100 nm, while Avid-NP aggregates appear >10,000 nm. Zeta-potential measurements of particles show a strong negative charge associated on the surface of both NP and NP-Avid at −35.6±0.56 mV and −11.3±0.41 mV, respectively. The addition of PEG, however, significantly reduced surface potential to between −5.6 – 3.5 mV (B). The nomenclature for different particle preparations are defined in Table 1.
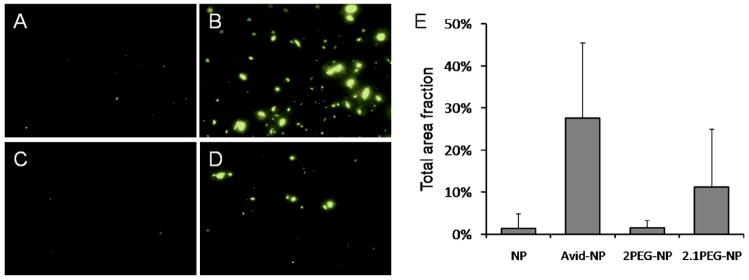
NP, NP-Avid, 2PEG-NP and 2.1PEG-NP were incubated on mucin fibers that were adsorbed in small spots (or blots) on a nitrocellulose membrane (Figure 5A–D). Particle binding to mucin was recorded by fluorescent microscopy imaging of the mucin blots. The extent of binding is indicated by the fractional area occupied by fluorescent particles (Figure 5E). NP and 2PEG-NP do not bind well. NP-Avid and 2.1PEG-NP, which displayed a high tendency of self-binding (aggregation) in water, also bound readily to mucin at 25 and 12% of total area, respectively.
Figure 5.
Sample images of fluorescent particles (Coumarin 6, green) observed under light microscopy shows different degree of binding to mucin-coated surface. Area fraction of particles on mucin blots for NP (A), NP-Avid (B), 2PEG-NP (C) and 2.1PEG-NP (D) reveal differences in binding and aggregation of particles on mucin surface (E). Data was obtained from n=30 blots (150 images) for each particle sample.
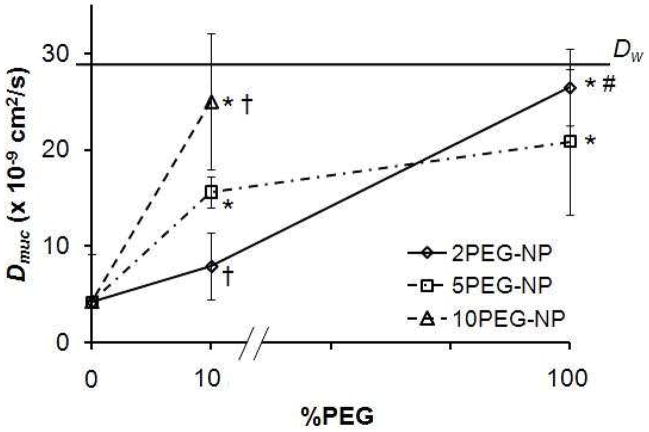
Diffusion of surface-modified particles was observed in glass capillary tubes loaded with fresh human cervical mucus. Diffusion coefficients obtained from fitting fluorescent concentration profile to diffusion model show a clear dependency of diffusion on PEG coating density and molecular weight (Figure 6). Fully PEGylated particles yielded the highest diffusion coefficients, Dmuc = 20.8 – 26.4 × 10⁻⁹ cm2/s; partially PEGylated particles exhibited an intermediate range of Dmuc, from 7.9 – 25.0 × 10⁻⁹ cm2/s. In addition, partially coated particles (10% PEG) showed a PEG MW dependency on diffusion that correlated with their HRP binding (Figure 4), and is statistically significant with α< 0.05. More remarkably, partially PEGylated 10.1PEG-NP seems to diffuse as well as particles fully coated with PEG of 2 or 5 kDa, with Dmuc = 25.9 ± 7.1 × 10⁻⁹ cm2/s compared to 26.5 ± 3.9 and 20.8 ± 7.5 × 10⁻⁹ cm2/s, respectively. PLGA particles or avidin-coated particles diffused at much slower rates, with NP Dmuc = 2.6 ± 0.52 and Dmuc = 4.2 ± 5 × 10⁻⁹ cm2/s for Avid-NP in mucus. Diffusion coefficient of nanoparticles in water (Dw) was calculated using the Stokes-Einstein equation as 28.9 × 10⁻⁹ cm2/s. Using the student t-test, we further determined that partially PEGylated particles diffused significantly faster than Avid-NP for formulations containing 10 and 5 kDa PEG, but not for those partially coated by 2 kDa. However, there is a clear and statistically significant improvement in diffusion for 2PEG-NP over partially coated particles, 2.1PEG-NP.
Figure 6.
Diffusion coefficient obtained from the resulting fits is plotted for each sample as a function of their surface %PEG. An increase in diffusivity is shown for fully PEGylated particles, where 10% PEGylated particles diffuse at high (10.1PEG-NP) or intermediate degrees (5.1 and 2.1PEG-NP). The difference in diffusion coefficient for these partially PEGylated particles was dependent on PEG MW. Avid-NP (at 0 %PEG) and unmodified PLGA particles (data not plotted) exhibit lowest diffusion in cervical mucus. Symbol description: * denotes Dmuc that are significantly different compared with Avid-NP; † denotes significant difference compared with 5.1PEG-NP; # denotes significant difference compared with 2.1PEG-NP, α<0.05).
Discussion
The mucus gel layer is a significant barrier to drug delivery via mucosal tissues. Our results indicate that addition of PEG to the surface of drug-loaded particles introduce favorable characteristics that facilitate their diffusion in human cervical mucus. In addition, these characteristics are highly dependent on both PEG MW and density. Firstly, presence of PEG enables particles to stay well-dispersed in aqueous solution. A small effective size (dNP) allows particles to move unhindered through the mucus gel, an environment usually described as a porous scaffold of defined pore size (dpore) between 100 – 1000 nm.18 Secondly, addition of PEG neutralizes surface charge of nanoparticles; a finding consistent with previous studies.13, 14, 19, 20 This net-neutral charge mimics the surface properties of VLP’s, and allows particles to migrate in the mucus medium without engaging in strong interactions with mucin fibers that may lead to their entrapment.
The average binding capacity for avidin incorporated to PLGA nanoparticle surface using our method is 50% of theoretical maximum, or 2/avidin molecule (Figure 3B). This is likely a result from the random arrangement of avidin on particle surface that obstruct binding site from ligand, and/or conjugation of palmitic acid to residues within the binding pocket. Our data clearly indicate aggregation and binding of particles to mucin fibers by avidin-coated and sparsely PEGylated particles, which consequently hinder their diffusion in mucus gel. PLGA particles, which do not exhibit aggregation, also do not diffuse well in mucus. We speculate that the strongly negative surface of PLGA particles which help particles remain mono-dispersed in solution may also prevent them from binding to mucin fibers or entering the net-negative mucus environment in the capillary tube diffusion setup (Figure 1A).
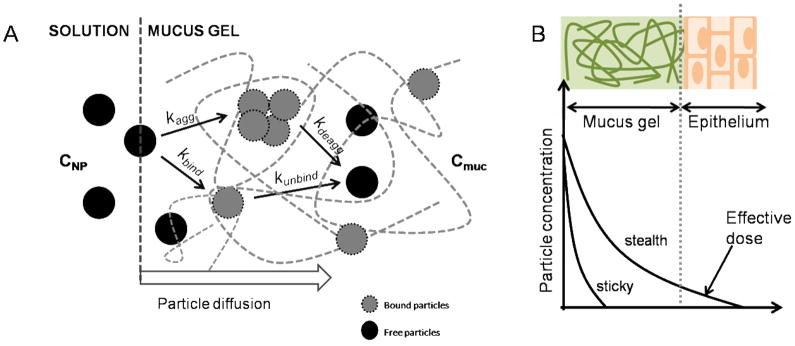
Diffusion is driven by concentration gradients. We hypothesize that two processes influence the concentration of particles that is available for diffusion, C: aggregation and binding, as shown in Figure 7A. Aggregation, or self-binding, of particles occurs at a rate constant kagg.. When the aggregate size is larger than the mesh size of the mucus gel (dNP>dpore), particles within aggregates are unable to diffuse. Binding to mucin fibers (kbind) is a reversible process that depends on the strength of particle/mucin interaction: bound particles are also unable to diffuse. The situation is further complicated if we consider that particles bound on mucin fibers are also obstacles to free-diffusing particles, such that the effective pore size is further reduced as some function of kbind.
Figure 7.
Schematic depicting factors that govern particle diffusion in mucus gel. The entry of particles is first defined by some interfacial rate constant, which may differ with charge and solubility. Within the mucus gel, a complex environment that presents both steric hindrance (mucin fiber creating pores of some size) and chemical binding (mucin binding by charge or molecular interaction), particles aggregate (kagg) and/or bind with some reversible rate (kbind). Particles that exhibit low aggregation and binding may migrate faster (stealth) through the mucus gel (A). This would result in a greater amount of available dose at the mucus-epithelium interface than ‘sticky’ or slow-diffusing particles (B).
A similar experimental method and models of Fickian mass transport were used previously to calculate Dmuc of various antibodies, proteins and DNA preparations in water and cervical mucus. The diffusion of certain proteins, antibodies and DNA molecules was essentially unhindered in cervical mucus.18 Separate studies using FRAP and multiple particle tracking revealed that small molecules and VLPs can diffuse faster than polystyrene particles of similar or smaller sizes.7 Moreover, surface modification of these slow-diffusing polystyrene particle surfaces with PEG can improve their transport in mucus, further affirming the concept that reduction of interaction with mucin enhances diffusion of particles in the mucus gel. 8 Our findings are in line with the previously reported trend: uncoated PLGA particles (average d = 150 – 170 nm) diffuse slowly (Dmuc/Dw = 0.1), but diffusion is significantly improved upon addition of PEG (Dmuc/Dw = 0.8). We note that Dmuc/Dw for PLGA particles is larger than that reported by Lai et al. for PEGylated 200 nm polystyrene particles, which yield Dmuc/Dw = 0.16. Since the particles are approximately the same size (170 vs. 200 nm), it is tempting to attribute this difference to properties of the polymer (PLGA vs. polystyrene) although it might be significant that diffusion coefficients were measured by different techniques.
Nanoparticles formulated from a combination of PLA, PLGA, and PEG has traditionally been made from co-polymers or polymer blends. While this method has been shown to improve particle bioavailability, the location and density of PEG, unfortunately, cannot be controlled and their effect quantified directly. In contrast, our method relies on avidin-functionalized PLGA particles, which allows incorporation of a wide range of biotinylated ligands (ie. 2, 5, and 10 kDa PEG) at various desired concentrations. A secondary ligand, biotinylated HRP, is used as an indirect assessment of the effect of PEG in inhibiting particle surface interactions. As expected, this inhibition bears direct correlation to PEG length, where higher MW permits fewer bHRP binding on the particle, given similar PEG/particle ratios. There have been no studies, to our knowledge, that have used direct surface modification of biodegradable and compatible polymer to study diffusion in mucus.
From a pharmacological perspective, particle migration over distance (i.e. depth of mucus gel) translates to accumulated dose over time, represented by the area under the concentration profile curves (Figure 7B). For stickier or slow-diffusing particles, the concentration profile drops at a short distance from the interface, while fast-diffusing particles can display a broader profile, which result in a larger effective dose at the epithelial surface. One aspect that is not incorporated in this model is particle interaction with epithelial cells. ‘Stealth’ particles do not interact with mucus but may also avoid uptake by cells.20–23 In certain applications, systemic delivery of PEGylated molecules is desired as they lead to better systemic retention time in vivo (higher plasma concentration) or localization in lymph nodes and tumors.24–27 To this end, particle formulations with longer length PEG (i.e. 10 kDa), while still providing stealth diffusion, leaves a majority of avidin sites available for anchoring of other molecules such as fluorescence label, drugs or other molecules that may help increase particle uptake by cells.
Conclusions
In the present study, we demonstrated that incorporation of PEG onto the PLGA particle surface can improve their diffusion in cervical mucus. Using avidin-functionalized surfaces, we further showed that this enhanced diffusion is dependent on PEG MW and density. PLGA and PEG have both been used for drug delivery in humans. Therefore, the particles studied here are directly relevant for clinical use. We believe that these results lead to rational approach for design of nanoparticles that stabilize drug and rapidly penetrate through mucus.
Acknowledgments
This study was supported by a grant from the National Institutes of Health (EB000487). We also thank Dr. Hugh Taylor and Dr. Ryan Martin of the Yale Fertility Center for making possible acquisition of cervical mucus samples.
References
- 1.Bansil R, Turner BS. Mucin structure, aggregation, physiological functions and biomedical applications. Current Opinion in Colloid & Interface Science. 2006;11:164–170. [Google Scholar]
- 2.Thornton DJ, Sheehan JK. From mucins to mucus: toward a more coherent understanding of this essential barrier. Proc Am Thorac Soc. 2004;1:54–61. doi: 10.1513/pats.2306016. [DOI] [PubMed] [Google Scholar]
- 3.Lafitte G, Thuresson K, Soderman O. Mixtures of mucin and oppositely charged surfactant aggregates with varying charge density. Phase behavior, association, and dynamics. Langmuir. 2005;21:7097–104. doi: 10.1021/la0472807. [DOI] [PubMed] [Google Scholar]
- 4.Albanese CT, Cardona M, Smith SD, Watkins S, Kurkchubasche AG, Ulman I, Simmons RL, Rowe MI. Role of intestinal mucus in transepithelial passage of bacteria across the intact ileum in vitro. Surgery. 1994;116:76–82. [PubMed] [Google Scholar]
- 5.Kitson C, Angel B, Judd D, Rothery S, Severs NJ, Dewar A, Huang L, Wadsworth SC, Cheng SH, Geddes DM, Alton EW. The extra- and intracellular barriers to lipid and adenovirus-mediated pulmonary gene transfer in native sheep airway epithelium. Gene Ther. 1999;6:534–46. doi: 10.1038/sj.gt.3300840. [DOI] [PubMed] [Google Scholar]
- 6.Yonemitsu Y, Kitson C, Ferrari S, Farley R, Griesenbach U, Judd D, Steel R, Scheid P, Zhu J, Jeffery PK, Kato A, Hasan MK, Nagai Y, Masaki I, Fukumura M, Hasegawa M, Geddes DM, Alton EW. Efficient gene transfer to airway epithelium using recombinant Sendai virus. Nat Biotechnol. 2000;18:970–3. doi: 10.1038/79463. [DOI] [PubMed] [Google Scholar]
- 7.Olmsted SS, Padgett JL, Yudin AI, Whaley KJ, Moench TR, Cone RA. Diffusion of macromolecules and virus-like particles in human cervical mucus. Biophys J. 2001;81:1930–7. doi: 10.1016/S0006-3495(01)75844-4. [DOI] [PMC free article] [PubMed] [Google Scholar]
- 8.Lai SK, O’Hanlon DE, Harrold S, Man ST, Wang YY, Cone R, Hanes J. Rapid transport of large polymeric nanoparticles in fresh undiluted human mucus. Proc Natl Acad Sci U S A. 2007;104:1482–7. doi: 10.1073/pnas.0608611104. [DOI] [PMC free article] [PubMed] [Google Scholar]
- 9.Mundargi RC, Babu VR, Rangaswamy V, Patel P, Aminabhavi TM. Nano/micro technologies for delivering macromolecular therapeutics using poly(D,L-lactide-co-glycolide) and its derivatives. J Control Release. 2008;125:193–209. doi: 10.1016/j.jconrel.2007.09.013. [DOI] [PubMed] [Google Scholar]
- 10.Panyam J, Labhasetwar V. Biodegradable nanoparticles for drug and gene delivery to cells and tissue. Adv Drug Deliv Rev. 2003;55:329–47. doi: 10.1016/s0169-409x(02)00228-4. [DOI] [PubMed] [Google Scholar]
- 11.Perez C, Sanchez A, Putnam D, Ting D, Langer R, Alonso MJ. Poly(lactic acid)-poly(ethylene glycol) nanoparticles as new carriers for the delivery of plasmid DNA. J Control Release. 2001;75:211–24. doi: 10.1016/s0168-3659(01)00397-2. [DOI] [PubMed] [Google Scholar]
- 12.Tobio M, Sanchez A, Vila A, Soriano II, Evora C, Vila-Jato JL, Alonso MJ. The role of PEG on the stability in digestive fluids and in vivo fate of PEG-PLA nanoparticles following oral administration. Colloids Surf B Biointerfaces. 2000;18:315–323. doi: 10.1016/s0927-7765(99)00157-5. [DOI] [PubMed] [Google Scholar]
- 13.Vila A, Gill H, McCallion O, Alonso MJ. Transport of PLA-PEG particles across the nasal mucosa: effect of particle size and PEG coating density. J Control Release. 2004;98:231–44. doi: 10.1016/j.jconrel.2004.04.026. [DOI] [PubMed] [Google Scholar]
- 14.Stolnik S, Dunn SE, Garnett MC, Davies MC, Coombes AG, Taylor DC, Irving MP, Purkiss SC, Tadros TF, Davis SS, et al. Surface modification of poly(lactide-co-glycolide) nanospheres by biodegradable poly(lactide)-poly(ethylene glycol) copolymers. Pharm Res. 1994;11:1800–8. doi: 10.1023/a:1018931820564. [DOI] [PubMed] [Google Scholar]
- 15.Esmaeili F, Ghahremani MH, Esmaeili B, Khoshayand MR, Atyabi F, Dinarvand R. PLGA nanoparticles of different surface properties: preparation and evaluation of their body distribution. Int J Pharm. 2008;349:249–55. doi: 10.1016/j.ijpharm.2007.07.038. [DOI] [PubMed] [Google Scholar]
- 16.Fahmy TM, Samstein RM, Harness CC, Mark Saltzman W. Surface modification of biodegradable polyesters with fatty acid conjugates for improved drug targeting. Biomaterials. 2005;26:5727–36. doi: 10.1016/j.biomaterials.2005.02.025. [DOI] [PubMed] [Google Scholar]
- 17.Radomsky ML, Whaley KJ, Cone RA, Saltzman WM. Macromolecules released from polymers: diffusion into unstirred fluids. Biomaterials. 1990;11:619–24. doi: 10.1016/0142-9612(90)90018-l. [DOI] [PubMed] [Google Scholar]
- 18.Saltzman WM, Radomsky ML, Whaley KJ, Cone RA. Antibody diffusion in human cervical mucus. Biophys J. 1994;66:508–15. doi: 10.1016/s0006-3495(94)80802-1. [DOI] [PMC free article] [PubMed] [Google Scholar]
- 19.Dong Y, Feng SS. Nanoparticles of poly(D,L-lactide)/methoxy poly(ethylene glycol)-poly(D,L-lactide) blends for controlled release of paclitaxel. J Biomed Mater Res A. 2006;78:12–9. doi: 10.1002/jbm.a.30684. [DOI] [PubMed] [Google Scholar]
- 20.Gref R, Luck M, Quellec P, Marchand M, Dellacherie E, Harnisch S, Blunk T, Muller RH. ‘Stealth’ corona-core nanoparticles surface modified by polyethylene glycol (PEG): influences of the corona (PEG chain length and surface density) and of the core composition on phagocytic uptake and plasma protein adsorption. Colloids Surf B Biointerfaces. 2000;18:301–313. doi: 10.1016/s0927-7765(99)00156-3. [DOI] [PubMed] [Google Scholar]
- 21.Behrens I, Pena AI, Alonso MJ, Kissel T. Comparative uptake studies of bioadhesive and non-bioadhesive nanoparticles in human intestinal cell lines and rats: the effect of mucus on particle adsorption and transport. Pharm Res. 2002;19:1185–93. doi: 10.1023/a:1019854327540. [DOI] [PubMed] [Google Scholar]
- 22.He G, Ma LL, Pan J, Venkatraman S. ABA and BAB type triblock copolymers of PEG and PLA: a comparative study of drug release properties and “stealth” particle characteristics. Int J Pharm. 2007;334:48–55. doi: 10.1016/j.ijpharm.2006.10.020. [DOI] [PubMed] [Google Scholar]
- 23.Mosqueira VC, Legrand P, Gref R, Heurtault B, Appel M, Barratt G. Interactions between a macrophage cell line (J774A1) and surface-modified poly (D,L-lactide) nanocapsules bearing poly(ethylene glycol) J Drug Target. 1999;7:65–78. doi: 10.3109/10611869909085493. [DOI] [PubMed] [Google Scholar]
- 24.Hawley AE, Illum L, Davis SS. Preparation of biodegradable, surface engineered PLGA nanospheres with enhanced lymphatic drainage and lymph node uptake. Pharm Res. 1997;14:657–61. doi: 10.1023/a:1012117531448. [DOI] [PubMed] [Google Scholar]
- 25.Li Y, Pei Y, Zhang X, Gu Z, Zhou Z, Yuan W, Zhou J, Zhu J, Gao X. PEGylated PLGA nanoparticles as protein carriers: synthesis, preparation and biodistribution in rats. J Control Release. 2001;71:203–11. doi: 10.1016/s0168-3659(01)00218-8. [DOI] [PubMed] [Google Scholar]
- 26.Mosqueira VC, Legrand P, Morgat JL, Vert M, Mysiakine E, Gref R, Devissaguet JP, Barratt G. Biodistribution of long-circulating PEG-grafted nanocapsules in mice: effects of PEG chain length and density. Pharm Res. 2001;18:1411–9. doi: 10.1023/a:1012248721523. [DOI] [PubMed] [Google Scholar]
- 27.Yu JJ, Lee HA, Kim JH, Kong WH, Kim Y, Cui ZY, Park KG, Kim WS, Lee HG, Seo SW. Bio-distribution and anti-tumor efficacy of PEG/PLA nano particles loaded doxorubicin. J Drug Target. 2007;15:279–84. doi: 10.1080/10611860701357235. [DOI] [PubMed] [Google Scholar]


