

Abstract
This review discusses the history and current state of the art of the forced oscillation technique (FOT) to measure respiratory impedance. We focus on how the FOT and its interaction with models have emerged as a powerful method to extract out not only clinically relevant information, but also to advance insight on the mechanisms and structures responsible for human lung diseases, especially asthma. We will first provide a short history of FOT for basic clinical assessment either directly from the data or in concert with lumped element models to extract out specific effective properties. We then spend several sections on the more exciting recent advances of FOT to probe the relative importance of tissue versus airway changes in disease, the impact of the disease on heterogeneous lung function, and the relative importance of small airways via synthesis of FOT with imaging. Most recently, the FOT approach has been able to directly probe airway caliber in humans and the distinct airway properties of asthmatics that seem to be required for airway hyperresponsiveness. We introduce and discuss the mechanism and clinical implications of this approach, which may be substantial for treatment assessment. Finally, we highlight important future directions for the FOT, particularly its use to probe specific lung components (e.g., isolated airways, isolated airway smooth muscle, etc.) and relate such data to the whole lung. The intent is to substantially advance an integrated understanding of structure-function relationships in the lung.
Keywords: forced oscillation technique, structure-function relationships, deep inspirations, asthma, airway hyperresponsiveness
1. Introduction
The concept of measuring mechanical impedance to probe mechanical lung function has been around for nearly three quarters of a century. The concept is driven by the general notion that in order to breathe, a pressure difference needs to be created across the lungs causing some resulting airflow and subsequent distribution of that air to gas exchanging regions of the lung. Since breathing is oscillatory, it seems reasonable to ask which mechanical properties govern the relation between oscillatory pressure and flow, particularly as they impact the capacity to sustain lung function. The original studies simply measured transpulmonary pressure and airflow during breathing and calculated a resultant parameter to capture the in-phase (or energy loss) aspect of this relation, called lung resistance (RL), and the out-of-phase (or energy storage component), which they called lung compliance (CL, or lung elastance EL which is the inverse of compliance) (Otis et al., 1950; Mead et al., 1954). These “effective” properties reflect the combined influence of a plethora of specific structures ranging from airway diameters, airway walls, parenchymal tissue, and the relative distribution of all these in a rather complex and asymmetric anatomy. Indeed, Otis et al. (1950) elegantly pointed out that, if the lung was diseased in a heterogeneous fashion, these properties would behave in a distinct fashion relative to a healthy lung when probed as a function of frequency. By implication, measurement of these properties versus frequency should reflect not only the degree but the pattern of a disease. Moreover, since the heterogeneity was most likely arising from the smaller airways or lung periphery, these data might be sensitive to such structures.
In parallel with these insights, Dubois et al. (1956) fathered the forced oscillation technique (FOT). Intrigued by the potential to probe not only overall mechanics, but measures sensitive to disease severity and distribution, he proposed using forced flow oscillations applied over a range of frequencies all at once, measuring the necessary flow and pressures simultaneously and then calculating the R and E at each frequency. In actuality, he measured what was termed impedance (Z), which is a complex term with a real (in-phase) and imaginary (out-of-phase) component of the pressure-flow relation calculated at each excitation frequency. From these real and imaginary parts, one can simply calculate the effective R and C. In order to avoid the need for an esophageal balloon, he applied the forcing externally (rather than by the subject breathing) and at frequencies that did not interfere with the subject breathing. Thus, he measured respiratory system impedance (Zrs) rather than lung impedance (ZL).
This review discusses the history and current state of the art of the forced oscillation technique to measure respiratory impedance. It follows several other reviews (Lutchen et al., 1996; Bates et al., 2005). Similar to these reviews, we focus on how the FOT and its interaction with models have emerged as a powerful method to extract out not only clinically relevant information, but also to advance insight on the mechanisms and structures responsible for human lung diseases. We cover the history of respiratory impedance measurements and advancements to provide physiological relevance to the measurements as well as to directly probe airway caliber with the FOT. We also present recent uses of the FOT in research and clinical applications, as well as future directions for the FOT. The intent is to utilize respiratory impedance measurements from the FOT to substantially advance an integrated understanding of structure-function relationships in the lung.
2. History of respiratory impedance measurements
The first study formalizing the FOT proposed two methods (Dubois et al., 1956) (Figure 1). In the first method, pressure oscillations are created around the chest wall (Pcw) by oscillating the air surrounding the subject in an enclosed head-out chamber. The resulting flow oscillations that occur at the airway opening (Qao) are measured. The ratio Pcw/Qao is called transfer impedance (Ztr). Alternatively, one can oscillate flows directly into the mouth and measure the trans-respiratory pressures that occur at the mouth. The ratio Pao/Qao is termed input impedance (Zin). In both cases, a high inertance bias tube (not shown) is used so that the subject can breathe normally without losing the energy from the forced oscillations. The oscillations are imposed from about 4 Hz and higher so as not to interfere with the breathing. The original technology focused on two forms of forcing: an impulse waveform applied at the mouth (Landser et al., 1976) and a forced pseudorandom noise signal (Michaelson et al., 1975). Both waveforms contained reasonable signal energy at multiple frequencies spanning around 4 – 32 Hz. We now know that an impulse is the least reliable and desirable excitation waveform to apply for systems identification because of signal-to-noise limitations over the bandwidth of interest and unsatisfactory crest factor (Pintelon et al., 2001). Alternatively, the random noise approach allowed more control over the energy across the frequencies and permitted the efficient application of the Fourier Transform and power spectral analysis techniques to calculate Z at all frequencies (Michaelson et al., 1975). The data from both methods showed an increasing real part of Z and a right-shifted imaginary part with obstructive lung disease.
Figure 1.

Two approaches to applying the FOT. (A) In the first technique, transfer impedance (Ztr) is measured by applying pressure oscillations around the chest wall and measuring flow at the airway opening. (B) In the second technique, input impedance (Zin) is measured by applying pressure oscillations at the airway opening and measuring flow at the airway opening. In both techniques, a high inertance bias tube (not shown) is used to allow the subject to breathe normally during forced oscillations of 4 Hz or greater (reproduced from Dubois et al., 1956 with permission).
These data naturally raised the question as to which lung structures or properties could result in this response. Earlier studies answered this question and interpreted the data by fitting lumped element models to the data. The most common model was a six-element model originally proposed by Dubois et al. (1956) in which airway resistance and inertance (Raw, Iaw) were separated from tissue resistance, inertance and compliance (Rti, Iti, Cti) by a shunt compliance thought to represent the compressibility of the alveolar gas (Cg) (Figure 2). While intuitively attractive, application of this model to human data proved frustrating and unreliable. Specifically, Lutchen et al. (1993a) showed that the Zin data from humans would never provide sufficient information for reliably estimating all six parameters simultaneously. Alternatively, Ztr data might be more reliable, but only if: 1) one could estimate lung volume independently (providing an independent calculation of Cg), 2) Ztr data were acquired to at least 64 Hz, and 3) the subject’s lungs were not highly constricted. The latter condition caused the data at low frequencies to deviate from that predictable with the six-element model.
Figure 2.

The six-element lumped lung model. Airway resistance (Raw) and inertance (Iaw) are separated from tissue resistance (Rti), inertance (Iti), and compliance (Cti) with an alveolar gas compression term (Cg) (reproduced from Lutchen et al., 1993a with permission).
In summary, Zin data for frequencies of 4 – 32 Hz is simple to acquire in humans and provides gross information sensitive to the presence of overall lung constriction or obstruction, but this information is not specific as to the causes. The data itself might provide specific features (e.g., real or imaginary values at particular frequencies) to clinically classify a subject. Lumped element model interpretation of these data is not helpful for input impedance, but might provide some additional insight on airway properties for mild obstructive disease.
3. FOT for frequencies surrounding breathing
By the early 1990s, it became increasingly clear that gleaning sensitive and specific physiological insight in health and disease is more likely if the FOT could be applied to lower frequencies that span typical breathing rates. A hint of this arose when Hantos et al. (1986) showed respiratory input impedance data from 0.1 – 4 Hz in healthy subjects using a complicated speaker system and protocol (the subject had to hold their breath with the glottis open for about 20–25 seconds while the oscillations were applied). The data revealed that even healthy subjects display a frequency dependent drop in their real part of Z (or in total respiratory system resistance) (Figure 3). In parallel with this study, several investigators [e.g., (Fredberg et al., 1989)] converged on the notion that parenchymal tissue is inherently viscoelastic with a constant hysteresivity, and that such a material would necessarily display a hyperbolic decrease in the amount of energy loss per cycle as frequency increased. This means that healthy tissue resistance (Rti) would decrease with frequency. This notion was consistent with soft-tissue displaying a power-law response for creep and stress-relaxation, as originally found by Hilderbrandt (1970). Subsequent studies using alveolar capsules (Fredberg et al., 1984; Bates et al., 1988) revealed that Rti drops close to zero at higher frequencies, leaving only airway resistance to contribute to RL. Also, heterogeneous constriction might cause an additional frequency dependence on RL to that already present due to Rti, but this additional increase would predominantly occur between 0 – 3 Hz or so (Gillis et al., 1999b). Hence, motivation was substantial to create a more practical method to acquire these data in diseased versus healthy humans or to probe diseases such as asthma before and after methacholine (MCh) challenge.
Figure 3.

The real (Rrs) and imaginary (Xrs) parts of total lung impedance versus frequency for healthy subjects. Healthy subjects display a frequency dependent drop in Rrs. (reproduced from Hantos et al., 1986 with permission).
Lutchen et al. (1993b) proposed such a method. They termed it the “optimal ventilation waveform” (OVW). The idea was to build an excitation signal consisting of the sum of 6 or 7 sine waves of pre-assigned magnitude and phase and frequencies spanning 0.1 – 8 Hz. The trick was to select the magnitude and phases such that the delivery device (a piston in their case) created a waveform which provided about a normal tidal volume of air per cycle. Thus, the OVW would ventilate the subject simultaneously with forcing at all the desired frequencies. Subjects were trained to allow the OVW to breathe for them, producing data that reflected the Zin of the lung (if an esophageal balloon was placed) at each of the frequencies. A series of follow-up studies showed considerable richness of information in these data. For example, Kazcka et al. (1997; 1999) used this approach and the inherent behavior of Rti to drop to zero by 4 Hz to partition airway and tissue resistance as they might contribute to overall lung resistance in healthy and asthmatic subjects (Figure 4). Their data revealed that tissue resistance was not a major issue in asthmatics. Also, Lutchen et al. (2001) showed that airway provocation in asthmatics or even healthy people resulted in substantially increased frequency dependence of RL and EL (Figure 5). These data suggested that the lungs inherently constrict in a mechanically heterogeneous fashion, and that it is the degree of heterogeneity that most governed the degree of degradation in lung function at typical breathing frequencies.
Figure 4.

Relative contributions of airway resistance (dashed) and tissue resistance (solid) to lung resistance measurements obtained from parameter estimates of healthy human data. Raw is virtually the sole contributor to RL by 5 Hz (reproduced from Kaczka et al., 1997 with permission).
Figure 5.

Measured lung mechanics [(A) lung resistance and (B) lung elastance] with the OVW technique for representative healthy, mild-to-moderate asthmatic, and severe asthmatic subjects. (A) With increasing severity of disease, RL becomes elevated and displays more frequency dependence. (B) Also, EL increases at higher frequencies due to airway wall shunting (adapted from Lutchen et al., 2001 with permission).
Could we build deeper and more specific insights as to the structural origins of these low frequency FOT data? During the late 1990s, computational power began to support the creation of complex anatomically consistent airway tree models in which any arbitrary constriction pattern or structural change could be imposed (Lutchen et al., 1997; Gillis et al., 1999a; Gillis et al., 1999b). These models incorporated explicit anatomic and morphological human data (measured both from live humans and from histology from human cadavers) including: the airway wall thickness, amount of airway smooth muscle for each airway generation, and constant hysteresis lung tissue. The result was a powerful paradigm to ask what forms of airway constriction might cause the low frequency FOT data acquired in healthy and asthmatic humans. For example, Figure 6 reveals that the shape and level of RL and EL versus frequency are very distinct for severe peripheral homogeneous constriction when compared to milder but highly heterogeneous peripheral constriction. Imposing heterogeneous constriction with a few (<10%) random closures causes substantial elevation in RL and EL, more frequency dependence of both, a dramatic shift up in EL at the lowest frequency due to the closures (a smaller lung is now being excited), and a dramatic rise in EL at higher frequencies due to pressures shunting across the central airway walls. These predicted shapes were very telling when compared to the real data (see Figure 5). Thus, complex as they may be, these models provide a conceptual template to understand overall mechanisms that may or may not be occurring in a subject.
Figure 6.

Simulated lung mechanics [(A) lung resistance and (B) lung elastance] from an airway tree model. Homogeneous peripheral constriction (narrowing all airways < 2mm diameter by 50%) results in a fairly uniform increase in RL and increased EL at higher frequencies due to airway wall shunting. However, heterogeneous peripheral constriction (20% mean, 50% coefficient of variation) results in elevated RL with increased frequency dependence of RL. Also, low frequency EL increases, indicative of airway closures (adapted from Lutchen et al., 2001 with permission).
Most recently, there have been attempts to expand the synthesis of the anatomic models to include not just low frequency FOT data, but also ventilation imaging data that is anatomically specific as well (Tgavalekos et al., 2005; Campana et al., 2007; Tgavalekos et al., 2007). This has been termed “image functional modeling” (IFM), and was originally proposed for use with lung images obtained from positron emission tomography (PET) but may also be advanced using images from hyperpolarized helium-3 magnetic resonance imaging (HP 3He MRI). In this technique, an anatomically specific 3D airway tree model [e.g., (Tawhai et al., 2004)] is scaled into a lung volume defined by a subject’s PET images and the ventilation defects from the images are mapped to the terminal units of the airway tree model. Next, one identifies the largest sized airways in the model airway tree that, when closed, can recreate the 3D locations of ventilation defects in the PET images without creating ventilation defects that are inconsistent with the image. Finally, for the airways outside of the ventilation defects, the best constriction pattern is found so that the model’s simulated respiratory mechanics provide the closest match to the subject’s measured respiratory mechanics. The result is an airway tree model showing the required airway closures and airway constrictions that can account for both ventilation defects and respiratory mechanics (Figure 7). Interestingly, the best IFM matches to asthmatic subjects after MCh challenge produce airway closures that are consistently in the lung periphery (< 2 mm). Also, airway constriction is required either in the small airways alone or in concert with large airways, but cannot occur solely in the large airways. Thus, at the crossroads of respiratory mechanics, computational modeling, and lung imaging, IFM may provide a powerful method to determine the airways most responsible for dysfunction in asthma.
Figure 7.
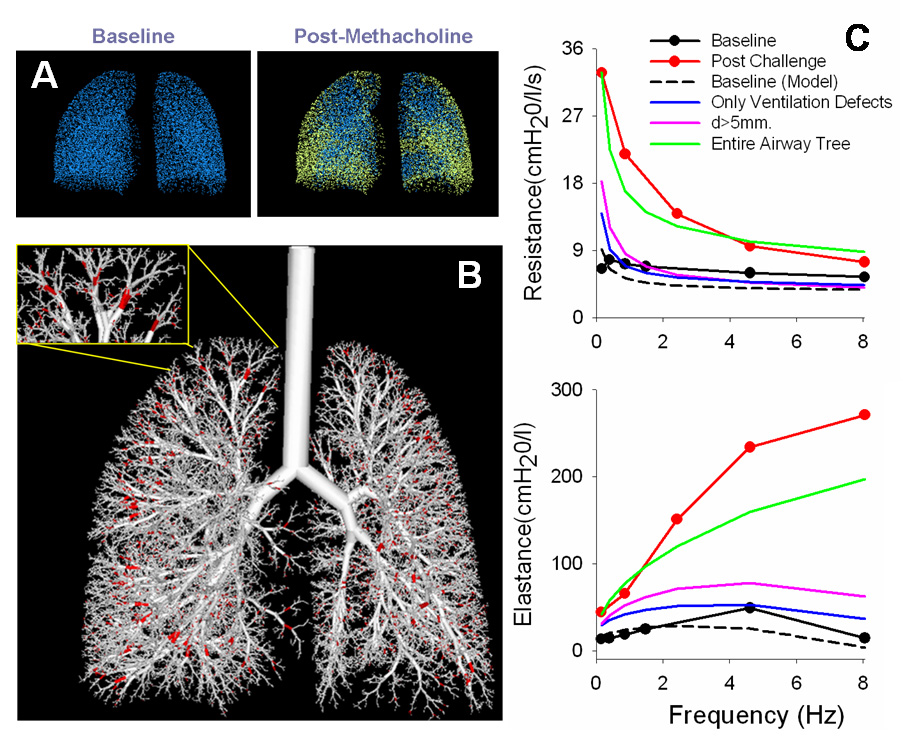
Overview of the image functional modeling (IFM) approach. (A) The three-dimensional locations of the ventilation defects, defined from HP 3He RI images, are mapped into the alveolar terminal units from an anatomical airway tree model (shown in yellow). (B) Next, the largest airways are found that, when closed, will result in the same ventilation defects as the images without affecting other ventilated regions (shown in red). (C) Lastly, the constriction pattern is found to best match the measured respiratory mechanics. The necessary closed airways are consistently small (< 2 mm) and constrictions must be applied throughout the airway tree to match the lung mechanics.
4. Tracking airway caliber in real-time using single frequency FOT
Up until recently, the FOT has been primarily used to study the frequency dependence of both lung resistance and lung elastance at a given moment in time. The FOT can be modified, however, to address sensitive and important changes in lung mechanics that may occur during specific breathing maneuvers. While the concept of using the FOT with a single frequency excitation was introduced early on (Nadel et al., 1961), it has not been exploited until recently. By using a time analysis of the single frequency data fit to a single compartment lung model, one can track the changes in lung mechanics at a chosen frequency in real-time, providing data with rich temporal resolution. Most exciting is that, based on the knowledge that airway resistance is the dominant contributor of lung resistance at higher frequencies between 5 – 8 Hz, it was realized that airway resistance could be measured in real-time using a single excitation frequency in the range of 5 – 8 Hz. Also, to the extent that laminar flow conditions are predominant, airway resistance could be related to airway diameter through Poiseuille’s law (Raw ~ 1/d4). Thus, a global surrogate sensitive to changes in airway caliber could be obtained in real-time using the single frequency FOT at ~8 Hz. It is conceivable that such data may provide both research and clinical measures to compare to spirometry.
Lutchen and colleagues (Jensen et al., 2001) presented the capacity to track Raw in humans in real-time during tidal breathing and deep inspirations to TLC. As before, the forced oscillation is applied at the airway opening and the airway opening flow (Qao) and transpulmonary pressure are measured (Ptp). The excitation frequency, f, is chosen in the range of 5 – 8 Hz and the excitation amplitude is chosen to provide sufficient signal-to-noise without interfering with the subject’s normal breathing through a bias tube. With the single compartment lung model (i.e., a rigid tube connected to a compliant balloon), the lung can be modeled as a single resistance (RL) and elastance (EL) in series at a single frequency, giving the following relationship:
After isolating the single frequency excitation data through filtering, a recursive least squares (RLS) algorithm is used to extract out RL and EL with a time resolution of 1/f seconds. In this algorithm, a forgetting factor is chosen that determines the contribution of previous data in calculating current data. The result is the ability to track Raw during almost any breathing maneuver (i.e., tidal breathing and deep inspirations) and during MCh challenge with a very high temporal resolution. The RLS approach to track lung resistance and compliance during breathing had been introduced several years earlier by several investigators [e.g., (Avanzolini et al., 1990; Bates et al., 1994; Kaczka et al., 1999)] but this was the first extension of it to track only airway properties in humans.
Ideally, the technique provides pure measures of Raw, but only when an esophageal balloon is invoked so as to isolate transpulmonary pressures. Without an esophageal balloon, total respiratory system impedance (Zrs) is obtained. Thus, measurements of respiratory system resistance (Rrs) would include any Newtonian form of resistance of the chest wall (Rcw) as well as Raw. To determine if the clinically simpler Rrs measurements would suffice for Raw measurements, Lutchen and colleagues (Black et al., 2003) studied the relative contributions of Rcw in Rrs measurements. It was found that the estimated measure of Rcw (where Rcw = Rrs – Raw) decreases with lung volume and, at TLC, the contribution of Rcw is almost negligible. In other words, the Rrs and Raw measurements were virtually identical at TLC. This is not due to actual changes in Rcw, but is likely due to lung tissue becoming stiff at high lung volumes, making Cti very low and preventing the excitation from reaching the chest wall (see Figure 2, where Rcw and Ccw would be in series with Rti and Cti). Thus, two determinations were made: 1) at TLC, Raw could be effectively estimated with Rrs measurements (i.e., without invoking an esophageal balloon) and, 2) the general trends observed with Raw tracking are also present with Rrs tracking, although comparisons of Rrs at different lung volumes would be partially confounded because the Newtonian Rcw contribution to the Rrs decreases from about 0.5 to 0.0 cmH2O/L/s between FRC and TLC.
The single frequency FOT soon found applications in studying the distinct responses to deep inspirations (DIs) in healthy and asthmatic subjects. Beginning in the 1970s and 1980s, studies using ad hoc indices derived from forced expiration maneuvers identified an apparent deficiency in the ability of asthmatic subjects to dilate their airways after constriction, when compared to healthy subjects [e.g., (Fish et al., 1977; Lim et al., 1987)]. DIs taken after induced constriction were bronchodilatory in healthy subjects, in that they were able to attenuate net constriction, but this effect was limited in asthmatic subjects. In the late 1990s and early 2000s, several studies (Skloot et al., 1995; Kapsali et al., 2000; Crimi et al., 2002) added to the intrigue of these findings by suggesting that one could increase reactivity in healthy subjects but not asthmatic subjects by purposely prohibiting DIs for an extended time. Thus, DIs taken before induced constriction were bronchoprotective in healthy subjects, but not in asthmatic subjects, in that they can prevent excessive subsequent constriction. However, these studies also relied on ad hoc indices from forced maneuvers. Any use of forced expiratory maneuvers is problematic because they either require a DI to assess the impact of any provocation even before the dilation ability is assessed, or one has to try and infer airway conditions from partial maneuvers which is a highly uncertain approach. Thus, increasingly interest arose to more explicitly track the degree and the dynamics of how individuals can dilate their airways. Unlike spirometry, the FOT does not require inhalation to TLC or forceful expiration. Thus, researchers have been able to study both the bronchodilatory and bronchoprotective effects of DI with FOT, where the distinct response to DI between healthy and asthmatic subjects may be directly linked to airway hyperresponsiveness.
The bronchodilatory effect of DI has been studied by tracking Raw surrounding a DI after MCh challenge in healthy and asthmatic subjects (Jensen et al., 2001; Salome et al., 2003; Black et al., 2004; Jackson et al., 2004). It was found that healthy and asthmatic subjects after MCh challenge behaved remarkable different to a single DI (Figure 8). Healthy subjects reach a lower minimum Raw at the peak of the DI (termed Rmin) and remain dilated after the DI, regardless of their initial level of induced constriction or the rate of DI. However, the asthmatic subjects showed distinctly limited initial dilation (higher Rmin values) and their airways appeared to re-narrow more quickly following DI (Jensen et al., 2001; Black et al., 2004). In fact, the re-narrowing dynamics following DI have been shown to be exponential in nature (Jackson et al., 2004), but a power law has also been suggested (Thorpe et al., 2004). Interestingly, exponential re-narrowing occurred with time constants that were ~3 times faster in asthmatic subjects than healthy subjects, which could implicate inherently faster airway smooth muscle (ASM) in the asthmatic case (Jackson et al., 2004). Also, repeated DIs have no additional bronchodilatory effect and do not aid in the spontaneous recovery from MCh in healthy subjects (Watson et al., 2007). Thus, not only do asthmatic subjects have a distinctly diminished capacity to stretch their airways, possibly due to inherently stiffer and thicker airway walls, but the airways also re-narrowed much more quickly following DI, implicating faster asthmatic ASM. However, it remains to be determined whether differences in FOT measurements of airway caliber between healthy and asthmatic subjects directly relate to ASM contractile differences.
Figure 8.

Airway resistance plotted versus time for representative healthy and asthmatic subjects. After MCh challenge, Raw is much more elevated in the asthmatic subject compared to the typical healthy subject. However, when DIs are withheld before MCh challenge in the healthy subject, amplified reactivity to MCh occurs. Following MCh challenge, a single DI causes Raw to decrease to a minimum value (Rmin) at the peak of the DI (at TLC). Compared to the asthmatic subject, the healthy subject is able to reach a lower Rmin at the peak of the DI and remain at a lower Raw following DI, suggesting a limited bronchodilatory effect in asthmatic subjects (adapted from Black et al., 2004 with permission).
The bronchoprotective effect of DI has been examined by tracking Raw in subjects in which DIs have been prohibited prior to MCh challenge. As indicated with spirometry studies, it was found that simply withholding DIs before and during the MCh challenge can amplify the response to MCh measured with FOT (Black et al., 2004; Watson et al., 2007). However, in healthy subjects, almost regardless of the degree of constriction achieved, a single DI taken after MCh challenge can ablate most of the additional constriction (see Figure 8). Most interestingly, Black et al. (2004) showed that the decrease in Raw following the DI appears to occur simultaneously with a drop in dynamic elastance (Figure 9), suggesting that the amplified reactivity is caused by heterogeneous airway closures and/or severe airway narrowings that can be easily ablated with a DI in healthy subjects. Thus, the consequences of prohibiting DIs prior to MCh challenge could be two-fold in the healthy subject: closures may occur simply by withholding DIs prior to ASM activation with MCh, and a subsequent MCh challenge of an effectively smaller lung will likely amplify reactivity in the ventilated regions.
Figure 9.

Dynamic lung elastance (EL) plotted versus time for a healthy subject (A) and an asthmatic subject (B). EL reflects a change in the fraction of lung tissue participating in breathing, where a decrease in EL would represent airway re-opening (or recruitment) and an increase would represent airway closure (or de-recruitment). In the asthmatic subject (B), EL increases after MCh challenge, but shows little change after DI. In the healthy subject (A), EL increases much greater when DIs are prohibited before MCh challenge. However, a DI after MCh challenge causes a substantially drop in EL. This suggests that the amplified reactivity that occurs in healthy subjects by prohibiting DIs is a consequence of heterogeneous airway closures and/or severe narrowings that occur simply by withholding DIs, but can be mostly ablated with a DI (reproduced from Black et al., 2004 with permission).
To further examine the apparent reduced ability of asthmatics to stretch their airways with DI, King and colleagues (Brown et al., 2007) have recently introduced using the FOT to obtain measures of airway distensibility, which previously could only be obtained with N2 or CO2 washout. Rrs measurements were obtained at ~25 different static lung volumes between TLC and FRC for both healthy and asthmatic subjects. Airway distensibility was defined as respiratory system conductance (Grs = 1/Rrs) divided by lung volume (VL). The data shows that airway distensibility (or the slope of Grs versus VL) is significantly reduced from healthy to asthmatic subjects for lung volumes of 75–100% TLC (Figure 10). Also, a bronchodilator has no significant effect in changing airway distensibility, which King and colleagues interpreted as indicating that airway wall stiffness from activated ASM is not contributing to the decreased airway distensibility observed in asthmatics. Instead, they argue that the non-ASM portions of the airway wall are remodeled to become stiffer. However, this interpretation is open to substantial debate. For one thing, the explicit forcing variable on airway diameter during a deep inspiration is not the change in volume that occurs but the change in transmural pressure, most of which is due to changes in transpulmonary pressure.
Figure 10.

Airway conductance (mean linear regressions) plotted versus lung volume for healthy and asthmatic subjects before and after bronchodilator. Compared to healthy subjects, asthmatic subjects had significantly lower airway distensibility (slope of regressions) for lung volumes of 75–100% TLC. Also, administration of a bronchodilator had no effect in changing airway distensibility (reproduced from Brown et al., 2007 with permission).
Another possible application of single frequency FOT is to quantify the fluctuations in Zrs at 6 Hz during normal breathing. Maksym and colleagues (Que et al., 2001) reported that the frequency distributions of the magnitude of Zrs for asthmatic subjects were not only shifted to larger means compared to healthy subjects, but were also wider. Thus, this suggests that there is greater variability in Zrs in asthmatic subjects than healthy subjects. However, the validity of impedance variability as a measure of disease severity has recently come into question following a study by King and colleagues (Diba et al., 2007).
In summary, the final downstream alterations required for airway hyperresponsiveness, whether they be at the level of ASM alone or the entire airway wall, should manifest themselves in distinct deep inspiration behavior of individual airways and perhaps even the entire airway tree. The ability to track such behavior in-vivo with Rrs measurements provides the potential to reveal additional mysteries as to the mechanisms of human asthma. This idea is re-addressed in a portion of the following section, where the single frequency FOT approach is translated to clinical assessments.
5. Clinical applications of the FOT – single and multiple frequencies
With the maturation of the FOT as a research tool, it has also gained increased potential for clinical applications. While spirometry has become ubiquitous for assessing lung function, it has its limitations. Spirometry is dependent on patient cooperation to provide consistent vigorous forced breathing maneuvers. Also, while indices derived from spirometry are well calibrated for normative data by age, height, etc., they do not readily nor explicitly reflect specific lung structures or regions. The FOT may emerge as either a highly complementary test with spirometry or even a complete substitute, especially in those subjects unable to reliably perform forced expirations such as young children [see (Hantos et al., 2008) for a review on respiratory mechanics in children] or disabled adults.
Clinical applications of FOT using commercially available FOT devices have gained attention in numerous reviews (Oostveen et al., 2003; Goldman et al., 2005) and the devices are being marketed to clinicians. These devices deliver either pseudorandom noise or impulse signals (see Section 2) and produce Zrs data in the range of 4–32 Hz. They provide automatic analysis of the Zrs data and produce simple FOT parameters for the clinician’s use. These parameters include: the mean Rrs over the whole frequency range, the slope obtained from linear regression of Rrs versus frequency, Rrs at 0 Hz from linear regression, Rrs at 5 Hz, the difference between Rrs at 5 Hz and Rrs at 20 Hz, the mean reactance over the frequency range, the resonant frequency, etc. These parameters are not used for physiological insight and only provide gross characterization of clinical status. For example, using these parameters, Cavalcanti et al. (2006) found that several FOT parameters were relatively sensitive to the severity of airway obstruction (as assessed by spirometry). Also, Yaegashi et al. (2007) showed that several FOT parameters were more sensitive than spirometry in detecting the response to bronchodilator in asthmatic subjects. Interestingly, these measurements may also be feasibly obtained at home using a portable, self-contained FOT system in order to titrate asthma treatment. Rigau et al. (2003) showed that asthmatic subjects were able to successful perform unsupervised FOT measurements at home with similar quality of data as in a clinic. Such measurements during spontaneous asthma attacks and before and after treatment with bronchodilator could allow the patient to titrate their treatment in real-time.
Other exciting future advancements of FOT in the clinical setting may occur by translating research-driven FOT approaches to study structure-function relationships in asthma for innovative uses in the clinic. For example, a challenging problem in diagnosing asthma and even more so for titrating asthma treatment is assessing the patient’s state of airway hyperresponsiveness (AHR). Currently, spirometry measures, such as FEV1, are used as a broad assessment of one’s current state of airway obstruction, but do not provide diagnostic insight corresponding to the subject’s degree of AHR. Thus, the traditional method to assess AHR is to perform a MCh challenge to determine the MCh dose that is needed to produce a 20% drop in FEV1 (termed the PC20 dose). Recall, however, that one of the most distinct defects in asthmatics may be a deficiency in their ability to dilate their airways, even if they are asymptomatic. Thus, by measuring Rmin values to quantify one’s ability to dilate their airways at the peak of a DI [e.g., as in (Black et al., 2004)], elevations in Rmin at baseline could reflect underlying structural differences of the airway wall that promote AHR. In fact, by re-examining data by Black et al. (2004), it appears that asthmatic subjects (previously diagnosed with asthma and having PC20 < 5 mg/ml) can be distinguished from healthy subjects by their baseline Rmin values, even though their FEV1 values vary largely and are almost indistinguishable from healthy subjects (Figure 11). It may even be possible to determine an Rmin threshold value (dashed line), below which it would be very improbable for a subject to be asthmatic. To test this hypothesis, a well-controlled study on a larger group of healthy and asthmatic subjects will need to be performed, where FEV1, Rmin, and PC20 values are measured. If Rmin does prove to be an effective measure of AHR, it could provide a very simple measurement (subject must be able to inhale to TLC) that may then be used to assess the efficacy of therapies on a patient-specific basis.
Figure 11.

Baseline Rmin plotted versus FEV1 for healthy and asthmatic subjects. The FEV1 values for asthmatic subjects vary greatly, making it impossible to distinguish asthmatic from healthy subjects by this measure. However, all asthmatic subjects had consistently higher baseline Rmin values compared to healthy subjects. Thus, it appears that a threshold in Rmin can be determined (dashed line), below which it would be highly improbable for a subject to be asthmatic (plotted from data partially presented in Black et al., 2004).
6. Future directions to develop an integrated understanding of structure-function relationships in lung diseases
It is fair to assume that, for human asthma, the constituent changes in each of the structures comprising a lung (e.g., ASM cells, ASM bundles, airway walls, and the entire airway tree) will eventually manifest themselves in whole lung FOT measurements taken across specific frequency ranges and/or at a particular frequency while performing particular breathing maneuvers such as a DI. Since the FOT is inherently a global functional measurement, it is complex to distill from whole organ FOT alone the specific structural changes most responsible for AHR or the local functional responses that are most responsible for changes in Raw. One great promise of the FOT may be in relating its global measures with FOT measurements explicitly acquired on a smaller length scale, such as isolated ASM cells, ASM strips, or intact airways. Here, we will briefly highlight some examples of recent attempts to advance an integrated understanding of structure-function relationships with FOT in order to decipher the trajectories most responsible for AHR.
Our first example exploits the single frequency FOT in humans. At the whole organ scale, this data provides a global surrogate to airway caliber. However, changes in Raw can be attributed not just to airway dilation/constriction per se, but also to airway recruitment/de-recruitment in any region of the lung. Interestingly, a modification of the FOT can be applied to much smaller length scales, including an isolated airway or ASM. Here, the forcing term (pressure/force) is used to mimic oscillatory breathing maneuvers consistent to humans and diameter/length changes can be measured directly. Thus, a direct measure of how breathing maneuvers affect diameter/length at the airway/ASM level can be obtained and perhaps related back to whole organ data and AHR [see (Krishnan et al., 2008) for a detailed review on ASM dynamics]. These studies then address the question of whether the same forces of breathing affect function at multiple length scales (e.g., airway, ASM, or ASM cells). Intriguingly, much of the healthy human data measured with FOT are consistent with the impact of pressure/force oscillations (or lack thereof) on isolated airways and isolated ASM from animals, especially in terms of the bronchodilatory response to DI [e.g., (LaPrad et al., 2007; Oliver et al., 2007)]. This suggests that human FOT studies (and hence asthma) may actually be a manifestation of an ASM contractile difference, which would appear on all length scales from isolated ASM to in-vivo measurements. Future studies using the FOT on the intact airway and intact ASM level may be essential to determine the local environments/conditions most responsible for AHR.
Another example is to relate human FOT measurements to biological assays in order to relate how specific functional changes most associated with AHR relate to the local cellular environment. Attempts have been made to relate the inability of airways to dilate with DI measured with the FOT to measures of inflammation (Henderson et al., 2003; Slats et al., 2007). Lutchen and colleagues (Henderson et al., 2003) performed antigen challenges and tracked changes in respiratory mechanics with FOT and changes in inflammation levels with sputum induction. They found little relationship between Rmin and the amount of inflammatory mediators, suggesting that the inflammation level either does not play a role in the ability to dilate with DI or there may be variability in how individuals (and their ASM) respond to the same presence of inflammatory mediators. More recently, Slats et al. (2007) found that a diminished bronchodilatory effect of DI may be positively associated with an increase in inflammation in the airway smooth muscle and submucosa, measured by bronchial biopsies. Therefore, the role of inflammation in the inability of asthmatic subjects to dilate their airways is still unclear and requires further investigation. Nevertheless, studies such as these provide important groundwork to relate respiratory mechanics to independent measures which may allow for a deeper understanding of the relation between the underlying disease state and its functional manifestations.
7. Summary and Conclusions
Most lung diseases are a manifestation of a complex set of processes that alter distinctive structural components in the lung so as to eventually degrade lung function. Historically, the FOT was proposed as a potential easy and inexpensive means to assess function with minimal patient cooperation. After all, the FOT explicitly measures effective mechanical properties associated with the degree of energy dissipation (R) and energy storage (E) associated with oscillating at a given frequency. For clinical assessment, the FOT has matured as a useful complement to spirometry, especially in non-cooperative settings, but until recently its use has been relegated to being similar to spirometry in that real or imaginary data at particular frequencies are compared against normative values. A far more exciting promise for the FOT rests in appreciating its capacity to distill out or exploit specific structural origins reflective of specific diseases, severity of diseases, or even the response of an important disease property to therapy. This means the FOT transcends the boundaries of being both a fundamental research tool and a powerful approach to assess lung conditions.
Perhaps the best and most advanced example of the above is in various permutations of using FOT with asthma research and assessment. Asthma is a disease characterized by some set of structural and/or mediator conditions resulting in hyperresponsive airways. There are, however, many possible pathways to create abnormal and amplified reactivity of airways (Figure 12). Enhanced local inflammatory mediators, structural remodeling of the airway smooth muscle at the intracellular, cellular or entire muscle contractile apparatus, and remodeling of other components of the airway wall, can all either conspire or work in isolation to result in amplified reactivity. Eventually these changes make up the asthmatic airway network embedded in a parenchymal tissue matrix. A fundamental challenge is to distill out which trajectory or trajectories constitute human asthma and which are simply an artificial pathway exploited to create amplified reactive airways in sensitized animal models but perhaps without much relevance to human asthma. For certain, solving this challenge will not be accomplished by whole lung FOT measurements alone. By exploiting the way in which the oscillatory properties of each of the constituents can lead to amplified reactivity, one can design variations of the use of FOT to substantially advance our understanding of asthma and our capacity to track how well a subject with reactive airways may or may not be responding to a chosen therapy. Also, by linking global functional measures to FOT measurements on much smaller length scales, new and deeper insights on how the human asthmatic whole lung emerges are likely. Whether similar promises exist in the use of FOT for other diseases, such as chronic obstructive pulmonary disease or acute respiratory distress syndrome, remains to be determined.
Figure 12.

Multiple trajectories to AHR. The passive airway wall substructures and active airway smooth muscle compose the complete airway, both of which can be altered by the local inflammatory mediator environment. The airway network is embedded in a parenchymal tissue matrix, and combined these components constitute the whole lung. Thus, any, all, or a combination of components can be responsible for AHR and altered lung function measurable with FOT.
Footnotes
Publisher's Disclaimer: This is a PDF file of an unedited manuscript that has been accepted for publication. As a service to our customers we are providing this early version of the manuscript. The manuscript will undergo copyediting, typesetting, and review of the resulting proof before it is published in its final citable form. Please note that during the production process errors may be discovered which could affect the content, and all legal disclaimers that apply to the journal pertain.
References
- Avanzolini G, Barbini P, Cappello A, Cevenini G. Real-time tracking of parameters of lung mechanics: emphasis on algorithm tuning. J. Biomed. Eng. 1990;12:489–495. doi: 10.1016/0141-5425(90)90059-v. [DOI] [PubMed] [Google Scholar]
- Bates JH, Lauzon AM, Dechman GS, Maksym GN, Schuessler TF. Temporal dynamics of pulmonary response to intravenous histamine in dogs: effects of dose and lung volume. J. Appl. Physiol. 1994;76:616–626. doi: 10.1152/jappl.1994.76.2.616. [DOI] [PubMed] [Google Scholar]
- Bates JH, Ludwig MS, Sly PD, Brown K, Martin JG, Fredberg JJ. Interrupter resistance elucidated by alveolar pressure measurement in open-chest normal dogs. J. Appl. Physiol. 1988;65:408–414. doi: 10.1152/jappl.1988.65.1.408. [DOI] [PubMed] [Google Scholar]
- Bates JH, Lutchen KR. The interface between measurement and modeling of peripheral lung mechanics. Respir. Physiol. Neurobiol. 2005;148:153–164. doi: 10.1016/j.resp.2005.04.021. [DOI] [PubMed] [Google Scholar]
- Black LD, Dellaca R, Jung K, Atileh H, Israel E, Ingenito EP, Lutchen KR. Tracking variations in airway caliber by using total respiratory vs. airway resistance in healthy and asthmatic subjects. J. Appl. Physiol. 2003;95:511–518. doi: 10.1152/japplphysiol.01114.2002. [DOI] [PubMed] [Google Scholar]
- Black LD, Henderson AC, Atileh H, Israel E, Ingenito EP, Lutchen KR. Relating maximum airway dilation and subsequent reconstriction to reactivity in human lungs. J. Appl. Physiol. 2004;96:1808–1814. doi: 10.1152/japplphysiol.01170.2003. [DOI] [PubMed] [Google Scholar]
- Brown NJ, Salome CM, Berend N, Thorpe CW, King GG. Airway distensibility in adults with asthma and healthy adults, measured by forced oscillation technique. Am. J. Respir. Crit. Care Med. 2007;176:129–137. doi: 10.1164/rccm.200609-1317OC. [DOI] [PubMed] [Google Scholar]
- Campana LM, Zhalehdoust-Sani S, Kenyon J, Tzeng YS, Albert MS, Lutchen KR. Quantitative Image Functional Modeling of the Lung Via Hyperpolarized (Hp) 3He MRI (Abstract) Am. J. Respir. Crit. Care Med. 2007;175:A817. [Google Scholar]
- Cavalcanti JV, Lopes AJ, Jansen JM, Melo PL. Detection of changes in respiratory mechanics due to increasing degrees of airway obstruction in asthma by the forced oscillation technique. Respir. Med. 2006;100:2207–2219. doi: 10.1016/j.rmed.2006.03.009. [DOI] [PubMed] [Google Scholar]
- Crimi E, Pellegrino R, Milanese M, Brusasco V. Deep breaths, methacholine,and airway narrowing in healthy and mild asthmatic subjects. J. Appl. Physiol. 2002;93:1384–1390. doi: 10.1152/japplphysiol.00209.2002. [DOI] [PubMed] [Google Scholar]
- Diba C, Salome CM, Reddel HK, Thorpe CW, Toelle B, King GG. Short-term variability of airway caliber-a marker of asthma? J. Appl. Physiol. 2007;103:296–304. doi: 10.1152/japplphysiol.00420.2006. [DOI] [PubMed] [Google Scholar]
- Dubois AB, Brody AW, Lewis DH, Burgess BF., Jr Oscillation mechanics of lungs and chest in man. J. Appl. Physiol. 1956;8:587–594. doi: 10.1152/jappl.1956.8.6.587. [DOI] [PubMed] [Google Scholar]
- Fish JE, Peterman VI, Cugell DW. Effect of deep inspiration on airway conductance in subjects with allergic rhinitis and allergic asthma. J. Allergy Clin.Immunol. 1977;60:41–46. doi: 10.1016/0091-6749(77)90081-1. [DOI] [PubMed] [Google Scholar]
- Fredberg JJ, Keefe DH, Glass GM, Castile RG, Frantz ID., 3rd Alveolar pressure nonhomogeneity during small-amplitude high-frequency oscillation. J. Appl. Physiol. 1984;57:788–800. doi: 10.1152/jappl.1984.57.3.788. [DOI] [PubMed] [Google Scholar]
- Fredberg JJ, Stamenovic D. On the imperfect elasticity of lung tissue. J. Appl. Physiol. 1989;67:2408–2419. doi: 10.1152/jappl.1989.67.6.2408. [DOI] [PubMed] [Google Scholar]
- Gillis HL, Lutchen KR. Airway remodeling in asthma amplifies heterogeneities in smooth muscle shortening causing hyperresponsiveness. J. Appl. Physiol. 1999a;86:2001–2012. doi: 10.1152/jappl.1999.86.6.2001. [DOI] [PubMed] [Google Scholar]
- Gillis HL, Lutchen KR. How heterogeneous bronchoconstriction affects ventilation distribution in human lungs: a morphometric model. Ann. Biomed. Eng. 1999b;27:14–22. doi: 10.1114/1.161. [DOI] [PubMed] [Google Scholar]
- Goldman MD, Saadeh C, Ross D. Clinical applications of forced oscillation to assess peripheral airway function. Respir. Physiol. Neurobiol. 2005;148:179–194. doi: 10.1016/j.resp.2005.05.026. [DOI] [PubMed] [Google Scholar]
- Hantos Z, Daroczy B, Suki B, Galgoczy G, Csendes T. Forced oscillatory impedance of the respiratory system at low frequencies. J. Appl. Physiol. 1986;60:123–132. doi: 10.1152/jappl.1986.60.1.123. [DOI] [PubMed] [Google Scholar]
- Hantos Z, Sly PD. Assessment of respiratory mechanics in infants and children. Respir. Physiol. Neurobiol. 2008 [Google Scholar]
- Henderson AC, Ingenito EP, Atileh H, Israel E, Suki B, Lutchen KR. How does airway inflammation modulate asthmatic airway constriction? An antigen challenge study. J. Appl. Physiol. 2003;95:873–882. doi: 10.1152/japplphysiol.00075.2003. [DOI] [PubMed] [Google Scholar]
- Hildebrandt J. Pressure-volume data of cat lung interpreted by a plastoelastic, linear viscoelastic model. J. Appl. Physiol. 1970;28:365–372. doi: 10.1152/jappl.1970.28.3.365. [DOI] [PubMed] [Google Scholar]
- Jackson AC, Murphy MM, Rassulo J, Celli BR, Ingram RH., Jr Deep breath reversal and exponential return of methacholine-induced obstruction in asthmatic and nonasthmatic subjects. J. Appl. Physiol. 2004;96:137–142. doi: 10.1152/japplphysiol.00504.2003. [DOI] [PubMed] [Google Scholar]
- Jensen A, Atileh H, Suki B, Ingenito EP, Lutchen KR. Selected contribution: airway caliber in healthy and asthmatic subjects: effects of bronchial challenge and deep inspirations. J. Appl. Physiol. 2001;91:506–505. doi: 10.1152/jappl.2001.91.1.506. discussion 504–505. [DOI] [PubMed] [Google Scholar]
- Kaczka DW, Ingenito EP, Israel E, Lutchen KR. Airway and lung tissue mechanics in asthma. Effects of albuterol. Am. J. Respir. Crit. Care Med. 1999;159:169–178. doi: 10.1164/ajrccm.159.1.9709109. [DOI] [PubMed] [Google Scholar]
- Kaczka DW, Ingenito EP, Suki B, Lutchen KR. Partitioning airway and lung tissue resistances in humans: effects of bronchoconstriction. J. Appl. Physiol. 1997;82:1531–1541. doi: 10.1152/jappl.1997.82.5.1531. [DOI] [PubMed] [Google Scholar]
- Kapsali T, Permutt S, Laube B, Scichilone N, Togias A. Potent bronchoprotective effect of deep inspiration and its absence in asthma. J. Appl.Physiol. 2000;89:711–720. doi: 10.1152/jappl.2000.89.2.711. [DOI] [PubMed] [Google Scholar]
- Krishnan R, Trepat X, Nguyen T, Lenormand G, Oliver MN, Fredberg JJ. Dynamics of airway smooth muscle. Respir. Physiol. Neurobiol. 2008 [Google Scholar]
- Landser FJ, Nagles J, Demedts M, Billiet L, van de Woestijne KP. A new method to determine frequency characteristics of the respiratory system. J. Appl. Physiol. 1976;41:101–106. doi: 10.1152/jappl.1976.41.1.101. [DOI] [PubMed] [Google Scholar]
- LaPrad AS, West AR, Noble PB, Lutchen KR, Mitchell HW. Long-Lasting Bronchodilatory Effect of Deep Inspirations after Bronchoprovocation in Bronchial Segments (Abstract) Am. J. Respir. Crit. Care Med. 2007;175:A352. [Google Scholar]
- Lim TK, Pride NB, Ingram RH., Jr Effects of volume history during spontaneous and acutely induced air-flow obstruction in asthma. Am. Rev. Respir. Dis. 1987;135:591–596. doi: 10.1164/arrd.1987.135.3.591. [DOI] [PubMed] [Google Scholar]
- Lutchen KR, Everett JR, Jackson AC. Impact of frequency range and input impedance on airway-tissue separation implied from transfer impedance. J. Appl. Physiol. 1993;74:1089–1099. doi: 10.1152/jappl.1993.74.3.1089. [DOI] [PubMed] [Google Scholar]
- Lutchen KR, Gillis H. Relationship between heterogeneous changes in airway morphometry and lung resistance and elastance. J. Appl. Physiol. 1997;83:1192–1201. doi: 10.1152/jappl.1997.83.4.1192. [DOI] [PubMed] [Google Scholar]
- Lutchen KR, Jensen A, Atileh H, Kaczka DW, Israel E, Suki B, Ingenito EP. Airway constriction pattern is a central component of asthma severity: the role of deep inspirations. Am. J. Respir. Crit. Care Med. 2001;164:207–215. doi: 10.1164/ajrccm.164.2.2008119. [DOI] [PubMed] [Google Scholar]
- Lutchen KR, Suki B. Understanding Pulmonary Mechanics using the Forced Oscillations Technique: Emphasis on Breathing Frequencies. In: Khoo MC, editor. Bioengineering Approaches to Pulmonary Physiology and Medicine. New York: Plenum Press; 1996. pp. 227–253. [Google Scholar]
- Lutchen KR, Yang K, Kaczka DW, Suki B. Optimal ventilation waveforms for estimating low-frequency respiratory impedance. J. Appl. Physiol. 1993b;75:478–488. doi: 10.1152/jappl.1993.75.1.478. [DOI] [PubMed] [Google Scholar]
- Mead J, Whittenberger JL. Evaluation of airway interruption technique as a method for measuring pulmonary airflow resistance. J. Appl. Physiol. 1954;6:408–416. doi: 10.1152/jappl.1954.6.7.408. [DOI] [PubMed] [Google Scholar]
- Michaelson ED, Grassman ED, Peters WR. Pulmonary mechanics by spectral analysis of forced random noise. J. Clin. Invest. 1975;56:1210–1230. doi: 10.1172/JCI108198. [DOI] [PMC free article] [PubMed] [Google Scholar]
- Nadel JA, Tierney DF. Effect of a previous deep inspiration on airway resistance in man. J. Appl. Physiol. 1961;16:717–719. doi: 10.1152/jappl.1961.16.4.717. [DOI] [PubMed] [Google Scholar]
- Oliver MN, Fabry B, Marinkovic A, Mijailovich SM, Butler JP, Fredberg JJ. Airway hyperresponsiveness, remodeling, and smooth muscle mass: right answer, wrong reason? Am. J. Respir. Cell Mol. Biol. 2007;37:264–272. doi: 10.1165/rcmb.2006-0418OC. [DOI] [PMC free article] [PubMed] [Google Scholar]
- Oostveen E, MacLeod D, Lorino H, Farre R, Hantos Z, Desager K, Marchal F. The forced oscillation technique in clinical practice: methodology, recommendations and future developments. Eur. Respir. J. 2003;22:1026–1041. doi: 10.1183/09031936.03.00089403. [DOI] [PubMed] [Google Scholar]
- Otis AB, Fenn WO, Rahn H. Mechanics of breathing in man. J. Appl. Physiol. 1950;2:592–607. doi: 10.1152/jappl.1950.2.11.592. [DOI] [PubMed] [Google Scholar]
- Pintelon R, Schoukens J. System Identification: A Frequency Domain Approach. Piscataway, NJ: IEEE Press; 2001. [Google Scholar]
- Que CL, Kenyon CM, Olivenstein R, Macklem PT, Maksym GN. Homeokinesis and short-term variability of human airway caliber. J. Appl. Physiol. 2001;91:1131–1141. doi: 10.1152/jappl.2001.91.3.1131. [DOI] [PubMed] [Google Scholar]
- Rigau J, Burgos F, Hernandez C, Roca J, Navajas D, Farre R. Unsupervised self-testing of airway obstruction by forced oscillation at the patient's home. Eur.Respir. J. 2003;22:668–671. doi: 10.1183/09031936.03.00010303. [DOI] [PubMed] [Google Scholar]
- Salome CM, Thorpe CW, Diba C, Brown NJ, Berend N, King GG. Airway re-narrowing following deep inspiration in asthmatic and nonasthmatic subjects. Eur. Respir. J. 2003;22:62–68. doi: 10.1183/09031936.03.00117502. [DOI] [PubMed] [Google Scholar]
- Skloot G, Permutt S, Togias A. Airway hyperresponsiveness in asthma: a problem of limited smooth muscle relaxation with inspiration. J. Clin. Invest. 1995;96:2393–2403. doi: 10.1172/JCI118296. [DOI] [PMC free article] [PubMed] [Google Scholar]
- Slats AM, Janssen K, van Schadewijk A, van der Plas DT, Schot R, van den Aardweg JG, de Jongste JC, Hiemstra PS, Mauad T, Rabe KF, Sterk PJ. Bronchial inflammation and airway responses to deep inspiration in asthma and chronic obstructive pulmonary disease. Am. J. Respir. Crit. Care Med. 2007;176:121–128. doi: 10.1164/rccm.200612-1814OC. [DOI] [PubMed] [Google Scholar]
- Tawhai MH, Hunter P, Tschirren J, Reinhardt J, McLennan G, Hoffman EA. CT-based geometry analysis and finite element models of the human and ovine bronchial tree. J. Appl. Physiol. 2004;97:2310–2321. doi: 10.1152/japplphysiol.00520.2004. [DOI] [PubMed] [Google Scholar]
- Tgavalekos NT, Musch G, Harris RS, Vidal Melo MF, Winkler T, Schroeder T, Callahan R, Lutchen KR, Venegas JG. Relationship between airway. Eur. Respir. J. 2007;29:1174–1181. doi: 10.1183/09031936.00113606. [DOI] [PubMed] [Google Scholar]
- Tgavalekos NT, Tawhai M, Harris RS, Musch G, Vidal-Melo M, Venegas JG, Lutchen KR. Identifying airways responsible for heterogeneous ventilation and mechanical dysfunction in asthma: an image functional modeling approach. J. Appl. Physiol. 2005;99:2388–2397. doi: 10.1152/japplphysiol.00391.2005. [DOI] [PubMed] [Google Scholar]
- Thorpe CW, Salome CM, Berend N, King GG. Modeling airway resistance dynamics after tidal and deep inspirations. J. Appl. Physiol. 2004;97:1643–1653. doi: 10.1152/japplphysiol.01300.2003. [DOI] [PubMed] [Google Scholar]
- Watson A, Ind P, Pride N. Effects of repeated deep inspirations on recovery from methacholine-induced airway narrowing in normal subjects. J. Asthma. 2007;44:443–448. doi: 10.1080/02770900701421948. [DOI] [PubMed] [Google Scholar]
- Yaegashi M, Yalamanchili VA, Kaza V, Weedon J, Heurich AE, Akerman MJ. The utility of the forced oscillation technique in assessing bronchodilator responsiveness in patients with asthma. Respir. Med. 2007;101:995–1000. doi: 10.1016/j.rmed.2006.09.001. [DOI] [PubMed] [Google Scholar]