

Abstract
A method employing protein cleavage isotope dilution mass spectrometry (PC-IDMS) was developed for quantification of C-reactive protein (CRP) in human plasma. This method was completed without the use of immuno-affinity chromatography or size exclusion chromatography, as previous mass spectrometric methods for the quantification of CRP have employed. A total of 110 human plasma samples were analyzed with PC-IDMS via 1-D nano LC-MS/MS using a 30 minute gradient with a triple quadrupole mass spectrometer operated in selective reaction monitoring (SRM) mode. The results from this newly developed method were compared to results generated from an enzyme-linked immunosorbent assay (ELISA) performed by an independent CLIA certified laboratory. The comparison of these results generated a R2 = 0.9708 which indicates successful quantification of CRP from human plasma utilizing the methodology described herein. Interestingly, the PC-IDMS method provided concentration values that were ~10X the concentration reported by the ELISA method, which demonstrated that the method of detection is an important consideration when determining reference ranges of a particular analyte. In addition, data is shown that illustrates that as epithelial ovarian cancer (EOC) progresses from stage I to stage IV, mean levels of CRP increase.
Introduction
C-reactive protein (CRP) is an important clinical marker for inflammation and atherosclerosis, a chronic inflammatory response in the walls of the arteries. In addition, CRP has been used as both a diagnostic and prognostic marker for cardiovascular disease, where it is used to identify acute cardiac trauma, or in conjunction with other markers to determine mortality.1-6 CRP typically circulates in the plasma at concentrations of <10 μg/mL to >5 mg/mL as defined by ELISA.1 Considering that human serum albumin (HSA) alone has a reference range of 3.5-5.5 g/dL,7 this means that CRP, at its highest level is one order of magnitude less, and at its lowest level is present at a concentration 5000 times lower than HSA! There are presently several immunoassays utilized to detect CRP.8 In addition to these immunoassays, CRP has recently been analyzed by mass spectrometry.9, 10 These methods both employ immuno-affinity to capture CRP from human serum. Kuhn and co-workers used size exclusion chromatography with immuno-affinity chromatography to further fractionate serum and quantify CRP.9 This study examined the CRP concentration of 12 pooled plasma samples. This provided the motivation to develop a method utilizing mass spectrometry for quantification that would enable the simplification of the plasma preparation before analysis and the use of this developed method to analyze a much larger sample set.
The absolute quantification of a protein from its digestion products dates back to Barr et. al.11 They used the combination of proteolysis and MS for absolute quantification of a European Community Bureau of Reference (BCR) certified apolipoprotein A-1 standard that was proteolyzed with trypsin and quantified with a stable isotope labeled internal standard peptide with LC- flow-FAB MS/MS.11 Their results demonstrated that the use of protein cleavage coupled with isotope dilution mass spectrometry (PC-IDMS) was valid methodology for the standardization of measurements of particular proteins in a clinical environment. PC-IDMS is ideally completed when protein cleavage is complete, as this produces a 1:1 molar ratio between the initial intact protein and the peptide or peptides to be analyzed. The quantification using IDMS is based on the ratio of the response of the labeled internal standard peptide to that of the unlabeled peptide resulting from the digestion of the particular protein of interest. IDMS has been utilized on a range of different analytes for almost 40 years and still maintains its utility for the quantification of many different molecules.12
After this initial study11 several applications utilizing PC-IDMS have been published for the quantification of peptides and proteins and are present in the current literature.13-18 The ability to quantify proteins with post-translation modifications (PTM's) has been demonstrated by having PTM's incorporated onto synthetic internal standard peptides.19, 20 Other reports have completed PC-IDMS as a means to compare immunoassay analysis to that of mass spectrometry.9, 10, 21, 22
The driving force for the development of this simplified quantification method for a biomarker, is the fact that mass spectrometry is constantly discovering and investigating the possibility of new and exciting biomarkers, many of which do not have ELISA methods for their quantification. Thus, if we can demonstrate and provide verification that a relatively simple, molecularly specific method (i.e. utilizing mass spectrometry) for the quantification of protein biomarkers is robust, it can be applied in the future to newly discovered biomarkers that do not have existing methods for their quantification.
Herein we describe a method utilizing PC-IDMS for the absolute quantification of C-reactive protein in human plasma without the use of immuno-affinity chromatography or other separation techniques to simplify the plasma before introduction to the LC-MS/MS system for analysis. This method was developed utilizing nano-flow liquid chromatography and a triple quadrupole mass spectrometer operating in selective reaction monitoring (SRM) mode. The results achieved through the utilization of PC-IDMS were compared to results from a CLIA approved independent laboratory measurement using a wide range hsCRP immunoassay test. This method was developed such to continue the investigation of CRP levels in ovarian cancer patients, since we have previously reported that CRP is up-regulated in patients with ovarian cancer,23 and to also probe possible affects smoking may have on CRP levels in plasma.
Experimental
Synthetic Peptides
Peptides were synthesized representing four tryptic peptides, from C-Reactive protein, whose sequences are as follows: APLTKPLK, ESDTSYVSLK, GYSIFSYATK, and QDNEILIFWSK. An additional set of peptides with identical sequences, but incorporation of 13C and 15N were synthesized for use as internal standards: APLTKP[13C5, 15N1]LK, ESDTSYV[13C5, 15N1]SLK, GYSIF[13C9, 15N1]SYATK, and QDNEILF[13C9, 15N1]WSK. All synthetic peptides were purchased from Mayo Clinic Proteomics Center (Rochester, MN). After dilution of these peptides their concentrations were confirmed utilizing UV-Vis spectroscopy and the Scopes method.24
Plasma Processing
Plasma digestion protocol followed a previously published methodology by Bondar, et. al.25 Briefly, 125 μL aliquots of plasma were added to dry urea to create 6M urea in plasma to denature proteins; this was followed by addition of an internal standard peptide, reduction with dithiothreitol (DTT), and alkylation with iodoacetamide. Finally, proteins present in plasma were digested with TPCK treated trypsin. These samples were then diluted and used directly for interrogation with nano-HPLC SRM. A total of 110 human plasma samples were analyzed: 1 pooled sample purchased from Innovative Research, Inc. (Novi, Michigan), 1 pooled sample from the Red Cross, and 108 samples procured from the Mayo Clinic (Rochester, MN). The 108 plasma samples were collected at the Mayo Clinic under IRB number 026-06-1. These samples were then transferred to North Carolina State University and analyzed under IRB number 000-00-330. All reagents utilized in the digestion procedure were purchased from Sigma-Aldrich (St. Louis, MO).
The plasma was processed in eleven “experimental cycles” each containing eleven plasma samples; however, in each experimental cycle one of these samples was always a pooled sample purchased from Innovative Research, Inc., such that the analytical variation of the method could be examined. This allowed for the analysis of 110 different plasma samples over the eleven experimental cycles. It was necessary to break the processing of these samples up, such to minimize their time between digestion and analysis.
LC-MS/MS
Solvents for liquid chromatography were purchased from Burdick and Jackson (Muskegon, MI). Reversed phase liquid chromatography was performed using a 75 μm i.d. PicoFrit capillary column (New Objective, Woburn, MA) with a 15 μm emitter tip packed in-house with 4 μm Jupiter Proteo C12 90Å stationary phase (Phenomenex, Torrance, CA). The packed volume had dimensions 75 μm i.d. × 100 mm and was operated at room temperature. Processed plasma injections of 10 μL were loaded using a PAL Autosampler (LEAP Technologies, Carrboro, NC) and over the course of 2 minutes trapped and washed on a custom built Jupiter Proteo C12 OPTI-PAK trap cartridge (Optimize Technologies; Oregon City, OR) with 100% Mobile Phase A (95/5 water/acetonitrile) at 10 uL/min. Then a 10 port switching valve (VICI, Houston, TX) was triggered to move the sample in-line with the gradient. Elution was carried out by a Chorus 220 nano-flow pump (CS Analytics, Zwingen, Switzerland) at 500 nL/min with mobile phases containing 95/5 (v/v) (Mobile Phase A) and 5/95 (Mobile Phase B) water and acetonitrile, respectively. The ion pairing reagent used was 0.2% formic acid (Sigma Aldrich, St. Louis, MO) in both mobile phases. The LC gradient was held at initial conditions of 2% B for 6 minutes followed by a ramp to 95% B over 14 minutes and held for an additional three minutes before re-equilibrating at 2% B, for a total gradient time of 30 minutes.
All quantification was carried out on a triple quadrupole mass spectrometer (Thermo Scientific, San Jose, CA) that was operated in SRM mode to monitor transitions of the peptides of interest and their stable isotope labeled counterparts. Each transition was monitored for 50 milliseconds and a resolution of 0.7 was employed for both Q1 and Q3 quadrupoles. Calibration was carried out utilizing 10 fmoles of the stable isotope labeled peptide internal standard on column. The natural peptide had 0.5, 1, 2, 5, 10, 15, 20, and 50 fmoles on column. Each ratio of natural to stable isotope labeled peptide was analyzed in duplicate to ensure the accuracy and reproducibility of the measurements.
Results and Discussion
Four peptides were chosen to be synthesized and utilized as possible internal standards based on a tryptic digestion of purified CRP analyzed on a hybrid LTQ-FT-ICR (data not shown). The synthesized peptides were then dissolved and examined for purity by direct infusion. This initial investigation demonstrated the most suitable peptide to use as an internal standard would be ESDTSYVSLK, the naturally occurring form will herein be referred to as tpCRP14-23 (tryptic peptide from CRP, amino acids 14-23). The other peptides, initially of interest as possible internal standards, presented challenges that prevented their further utilization in this study, such as solubility issues and calibration curves that did not perform as well as those generated from tpCRP14-23. The concentrations of both the tpCRP14-23 and the isotopically labeled form used as an internal standard were verified by the Scopes method24 which allowed for quantification of the stock solutions. Dilutions of these stock solutions allowed for the generation of a calibration curve and were eventually added as the internal standard to plasma samples analyzed.
Quantitation of CRP using LC-MRM from human serum9 has been previously demonstrated; however, the method described herein does not require the depletion of abundant proteins from plasma nor does it use size exclusion chromatography to further purify and simplify the sample. The reduction in sample processing minimizes the loss of the analyte of interest, and furthermore minimizes the variance in analytical results caused by the implementation of immuno-affinity and size exclusion separations. In addition, in the previously published method,9 the internal standard was not added until after fractionation of the plasma sample, which makes potential losses of CRP hard to quantify. However, the method developed in our laboratory incorporates the internal standard directly after the addition of plasma to urea, such that any losses in processing can be tracked.
The method presented herein utilized transitions of 564.78 → 347.23, 696.39 for the naturally occurring peptide (tpCRP14-23) and 567.78 → 347.23, 702.41 for the internal standard (IS) peptide. Both sets of transitions minimized the interferences from other possible tryptic peptides that occur from tryptic digestion of human plasma. This was determined through the implementation of SRM Workflow software, provided by ThermoScientific, and the IPI human protein database, in addition to experimental results. The software searches the database for other tryptic fragments that could produce similar precursor and product m/z that would affect the SRM transitions monitored by the instrument. Figure 1 demonstrates the ability of the instrument's SRM mode to monitor the transitions specified and detect only the analytes of interest directly from a tryptic digestion of untreated human plasma.
Figure 1.
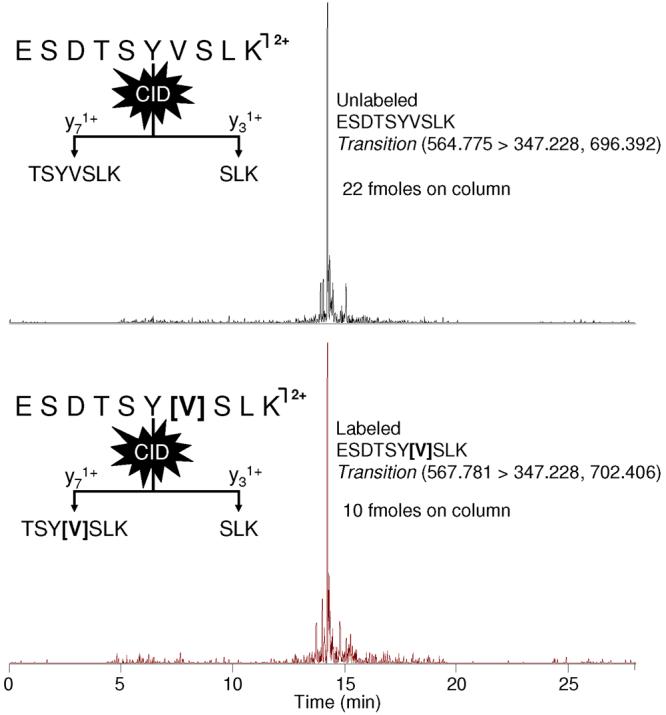
Ion chromatograms from the LC-MS/MS analysis of a plasma digest are shown. The chromatograms illustrate the ability of SRM to observe only the analytes of interest, tpCRP and IS peptide, from an untreated human plasma tryptic digestion.
The linear regression shown in Figure 2 was derived from the LC-SRM data of 8 different concentrations of synthetic peptide with 10 fmoles of IS peptide on column. Each concentration was analyzed in duplicate, for a total of 16 points in the calibration. The x and y used for the linear regression represent the ratio of the concentration of tpCRP14-23 to the IS peptide, and the ratio of their measured response from the mass spectrometer, respectively. Shown in Figure 2 is the equation of the line describing the results from the linear regression, as well as the R2-value. For an ideal system the line generated by linear regression should have both a slope of the 1.00 and intersect the origin. The slope generated from these experiments was 1.062 ± 0.023, with a y-intercept of 0.0497 ± 0.0408. The LOD for the tpCRP14-23 was calculated to be 0.038 nmole/L, as determined by a previously utilized methodology, 14 in which y was set equal to the upper 95% confidence interval value of the y-intercept and a concentration value for x was calculated using the equation generated by the previously completed least squares regression.
Figure 2.

Calibration curve using the peptide ESDTSYVSLK generated by linear least squares regression analysis of SRM data. The graph shows the ratio of tpCRP peptide response/IS peptide response vs. ratio of their know concentrations.
A total of 110 different plasma samples were analyzed in this study. These samples were distributed through eleven experimental cycles, in which each sample was analyzed in duplicate. An aliquot of the Innovative Research pooled plasma sample was processed for each experimental cycle to serve as a control through each cycle of sample processing. For cycles 1-10, ten single patient samples provided by the Mayo Clinic were analyzed in addition to the Innovative Research control. For cycle 11, eight single patient samples, a pooled sample from the Red Cross, and the Innovative Research control were evaluated.
The retention time reproducibility for the first three cycles is shown in Figure 3A. The retention times of these analyses produced a mean of 13.7 minutes ± 6 seconds. Retention time reproducibility was similar through the remaining cycles. Column changes were required during analysis of the remaining cycles, which influenced the absolute retention time between cycles with different columns (data not shown). This slight deviation in retention time between columns could be due to minor variations in the length of the self-packed columns utilized in this method, but were adequately accounted for because the IS peptide and tpCRP14-23 coeluted. This reproducibility in conjunction with the use of the IS peptide and the specificity afforded by the utilization of SRM allows for the quantification of the IS peptide and the tpCRP14-23 in the presence of other components from the plasma samples.
Figure 3.

A) A box and whisker plot showing retention time reproducibility from Cycles 1-3. B) Concentration of control plasma sample throughout the 11 cycles is shown. The graph illustrated the mean (center line of diamond), 95% C.I. of the mean (blue diamond), as well data points classified as outliers (>1.5 times inner quartile range).
The reproducibility of this method is also demonstrated in Figure 3B, which shows the CRP concentration of the control plasma sample analyzed in each experimental cycle. This box plot contains 22 points, which result from the analysis of the control sample for each of the 11 experimental cycles, in duplicate. This was necessary to evaluate the analytical variability of the developed method. The values range from about 0.4 mg/dL to 1.5 mg/dL; however, upon further investigation the two lowest points resulted from problems with the analytical column clogging, and the highest point directly followed the highest CRP concentration detected. With these three points removed the range of the data narrows significantly, resulting in a range from ~0.6-1.2 mg/dL. It is also important to note that although the same plasma sample was utilized, a new aliquot was processed for each experimental cycle (11 times); thus, there are several likely causes for this range of values (e.g. reduction, alkylation, digestion, etc.). However, correlation values between all CRP values attained by this PC-IDMS method and the orthogonal ELISA method were high (vide infra) which demonstrates that the method developed herein is robust.
All samples analyzed by the PC-IDMS method were sent to an independent lab to have an ELISA analysis performed for validation. The analysis performed utilized a polyclonal antibody and was designated as a wide range/high sensitivity CPR test. This was able to detect low amounts of CRP (0.01 mg/dL), but had a higher upper limit than a typical hsCRP test (>0.30 mg/dL). The results from the PC-IDMS method developed herein are plotted against the ELISA results from the independent lab in Figure 4. When linear regression was performed on this scatter plot, an R2 = 0.9708 was generated. This demonstrates a strong correlation between CRP concentrations determined utilizing the PCIDMS method and the ELISA wide range hsCRP test. Discrepancies between the values of these two methods are immediately noticeable when Figure 4 is examined, with the PCIDMS values being larger. Previously published studies of assay development and methodology have shown results can differ by as much as two-orders of magnitude for different detections schemes and the same protein target.26-29 This disparity in the values reported from different detection methods means that a reference range must be determined for each method, such that the values attained can provide appropriate information.
Figure 4.

Plot of the concentration of CRP in plasma determined by PC-IDMS versus an ELISA carried out by an independent lab. A correlation coefficient of 0.9708 was achieved when performing least squares linear regression on the plot which demonstrates the successful quantification of CRP by the PC-IDMS method.
The reference range for the developed PC-IDMS method described herein is different than that of ELISA method. The range detected utilizing the wide range hsCRP ELISA methodology was from <0.01 mg/dL to 1.64 mg/dL. The PC-IDMS method provided a range from 0.13 mg/dL to 22.8 mg/dL, of which the upper limit is much higher than the highest level in the calibration curve (10 mg/dL). On average the majority of the measurements were 1 order of magnitude greater utilizing the PC-IDMS method (within the calibration curve), which in effect would shift the reference range by an equal amount if this method were to be utilized in the clinical setting.
CRP has been previously found to be up-regulated in patients with epithelial ovarian cancer (EOC).23, 30 Our individual patient samples had either a benign gynecological tumor, stage I, stage II, stage II, or stage IV EOC. Out of these groups, those with benign gynecological tumors were found to have the lowest levels of CRP. Also, as the EOC stage classification increased from I to IV so did the CRP levels found in these patients. Figure 5 is a box plot containing the CRP levels found through the PC-IDMS developed herein. The mean levels ± 95% confidence interval found through this analysis were as follows: 1.10 ± 0.24 mg/dL for benign, 1.78 ± 0.53 mg/dL for stage I, 3.68 ± 3.30 mg/dL for stage II, 4.35 ± 2.60 mg/dL for stage III, and 7.54 ± 2.90 mg/dL for stage IV. While there was a wide range of CRP concentrations found, as evidence by the 95 % confidence interval, the overall mean does increase with the stage of the cancer present. These findings suggest the possibility of utilizing CRP in conjunction with other markers for the early detection of ovarian cancer.
Figure 5.

Concentration of all single patient plasma samples are shown. The graph illustrates the mean (center line of diamond), 95% C.I. of the mean (blue diamond), as well data points classified as outliers (>1.5 times inner quartile range and >3 times IQR) for patients with benign tumors followed by stage I, stage II, stage III, and stage IV EOC.
Conclusions
The method and results presented herein continue to support the fact that PC-IDMS is a viable method for the absolute quantification of proteins. In addition, we show that it is possible to directly quantify a biomarker from plasma without having to use additional steps to simplify/purify the matrix containing the analyte. An International Federation of Clinical Chemistry and Laboratory Medicine (IFCC) approved reference method for the measurement of glycohemoglobin in the blood of patients with diabetes has demonstrated that the combination of proteolysis and LC-MS can be used for clinically applicable tests.31 This demonstrates that other methods utilizing MS, such as this, could eventually be used in the clinical environment as a way of standardizing commercially available immunoassays.
In this study, absolute quantification of C-reactive protein in human plasma was carried out utilizing protein cleavage isotope dilution mass spectrometry carried out by nanoLC-MS/MS. The samples were also analyzed by an independent laboratory using a typical clinical method. The absolute values between these two data sets were quite different; however, upon further inspection the values correlated well, as indicate by a R2 = 0.9708. With this methodology validated, we were able to quantify the CRP levels present in patients with EOC and found that as the severity of the cancer increased, the level of CRP present also increased. Thus, quantification of C-reactive protein in human plasma without the use of multiple clean up steps such as size exclusion chromatography and depletion of abundant proteins from plasma was completed successfully, verified by an orthogonal method, and utilized to find data of interest which will be evaluated in future experiments.
Acknowledgements
Research described in this article was supported in part by the National Institutes of Health (R33 CA105295), Philip Morris USA Inc. and North Carolina State University. In addition, DKW would like to acknowledge the ACS Division of Analytical Chemistry and Merck for their support.
References
- 1.Anderson L. Candidate-based proteomics in the search for biomarkers of cardiovascular disease. J. Physiol. (London, U.K.) 2005;563(1):23–60. doi: 10.1113/jphysiol.2004.080473. [DOI] [PMC free article] [PubMed] [Google Scholar]
- 2.Rifai N, Ridker PM. High-sensitivity C-reactive protein: A novel and promising marker of coronary heart disease. Clin. Chem. 2001;47(3):403–411. [PubMed] [Google Scholar]
- 3.Tarkkinen P, Palenius T, Lovgren T. Ultrarapid, ultrasensitive one-step kinetic immunoassay for C-reactive protein (CRP) in whole blood samples: Measurement of the entire CRP concentration range with a single sample dilution. Clin. Chem. 2002;48(2):269–277. [PubMed] [Google Scholar]
- 4.Ridker PM. Clinical application of C-reactive protein for cardiovascular disease detection and prevention. Circulation. 2003;107(3):363–369. doi: 10.1161/01.cir.0000053730.47739.3c. [DOI] [PubMed] [Google Scholar]
- 5.Verma S, Yeh ET. C-reactive protein and atherothrombosis--beyond a biomarker: an actual partaker of lesion formation. Am J Physiol Regul Integr Comp Physiol. 2003;285(5):R1253–6. doi: 10.1152/ajpregu.00170.2003. discussion R1257-8. [DOI] [PubMed] [Google Scholar]
- 6.Verma S, Szmitko PE, Ridker PM. C-reactive protein comes of age. Nat. Clin. Practice Cardiovasc. Med. 2005;2(1):29–36. doi: 10.1038/ncpcardio0074. [DOI] [PubMed] [Google Scholar]
- 7.Braunwald E, Fauci AS, Kasper DL, et al. Harrison's Manual of Medicine. 15th ed. McGraw-Hill; New York: 2002. pp. 938–940. [Google Scholar]
- 8.Armani A, Becker RC. The biology, utilization, and attenuation of C-reactive protein in cardiovascular disease: Part I. Am. Heart J. 2005;149(6):971–976. doi: 10.1016/j.ahj.2004.12.031. [DOI] [PubMed] [Google Scholar]
- 9.Kuhn E, Wu J, Karl J, et al. Quantification of C-reactive protein in the serum of patients with rheumatoid arthritis using multiple reaction monitoring mass spectrometry and C-13-labeled peptide standards. Proteomics. 2004;4(4):1175–1186. doi: 10.1002/pmic.200300670. [DOI] [PubMed] [Google Scholar]
- 10.Kiernan UA, Addobbati R, Nedelkov D, et al. Quantitative multiplexed C-reactive protein mass spectrometric immunoassay. J. Proteome Res. 2006;5(7):1682–1687. doi: 10.1021/pr0601133. [DOI] [PubMed] [Google Scholar]
- 11.Barr JR, Maggio VL, Patterson DG, et al. Isotope dilution mass spectrometric quantification of specific proteins: Model application with apolipoprotein A-I. Clin. Chem. 1996;42(10):1676–1682. [PubMed] [Google Scholar]
- 12.de Leenheer AP, Thienpont LM. Applications of Isotope-Dilution Mass-Spectrometry in Clinical-Chemistry, Pharmacokinetics, and Toxicology. Mass Spectrom. Rev. 1992;11(4):249–307. [Google Scholar]
- 13.Barnidge DR, Dratz EA, Martin T, et al. Absolute quantification of the G protein-coupled receptor rhodopsin by LC/MS/MS using proteolysis product peptides and synthetic peptide standards. Anal. Chem. 2003;75(3):445–451. doi: 10.1021/ac026154+. [DOI] [PubMed] [Google Scholar]
- 14.Barnidge DR, Goodmanson MK, Klee GG, et al. Absolute quantification of the model biomarker prostate-specific antigen in serum by LC-MS/MS using protein cleavage and isotope dilution mass spectrometry. J. Proteome Res. 2004;3(3):644–652. doi: 10.1021/pr049963d. [DOI] [PubMed] [Google Scholar]
- 15.Anderson L, Hunter CL. Quantitative mass spectrometric multiple reaction monitoring assays for major plasma proteins. Mol. Cell. Proteomics. 2006;5(4):573–588. doi: 10.1074/mcp.M500331-MCP200. [DOI] [PubMed] [Google Scholar]
- 16.Pieper R, Su Q, Gatlin CL, et al. Multi-component immunoaffinity subtraction chromatography: An innovative step towards a comprehensive survey of the human plasma proteome. Proteomics. 2003;3(4):422–432. doi: 10.1002/pmic.200390057. [DOI] [PubMed] [Google Scholar]
- 17.Anderson NL, Anderson NG, Haines LR, et al. Mass spectrometric quantitation of peptides and proteins using stable isotope standards and capture by anti-peptide antibodies (SISCAPA) J. Proteome Res. 2004;3(2):235–244. doi: 10.1021/pr034086h. [DOI] [PubMed] [Google Scholar]
- 18.Hawkridge AM, Heublein DM, Bergen HR, et al. Quantitative mass spectral evidence for the absence of circulating brain natriuretic peptide (BNP-32) in severe human heart failure. Natl. Acad. Sci. U. S. A. 2005;102(48):17442–17447. doi: 10.1073/pnas.0508782102. [DOI] [PMC free article] [PubMed] [Google Scholar]
- 19.Gerber SA, Rush J, Stemman O, et al. Absolute quantification of proteins and phosphoproteins from cell lysates by tandem MS. Natl. Acad. Sci. U. S. A. 2003;100(12):6940–6945. doi: 10.1073/pnas.0832254100. [DOI] [PMC free article] [PubMed] [Google Scholar]
- 20.Kirkpatrick DS, Gerber SA, Gygi SP. The absolute quantification strategy: a general procedure for the quantification of proteins and post-translational modifications. Methods. 2005;35(3):265–273. doi: 10.1016/j.ymeth.2004.08.018. [DOI] [PubMed] [Google Scholar]
- 21.Kippen AD, Cerini F, Vadas L, et al. Development of an isotope dilution assay for precise determination of insulin, C-peptide, and proinsulin levels in non-diabetic and type II diabetic individuals with comparison to immunoassay. J. Biol. Chem. 1997;272(19):12513–12522. doi: 10.1074/jbc.272.19.12513. [DOI] [PubMed] [Google Scholar]
- 22.Fierens C, Stockl D, Baetens D, et al. Standardization of C-peptide measurements in urine by method comparison with isotope-dilution mass spectrometry. Clin. Chem. 2003;49(6):992–994. doi: 10.1373/49.6.992. [DOI] [PubMed] [Google Scholar]
- 23.Ogata Y, Heppelmann CJ, Charlesworth MC, et al. Elevated levels of phosphorylated fibrinogen-alpha-isoforms and differential expression of other post-translationally modified proteins in the plasma of ovarian cancer patients. J. Proteome Res. 2006;5(12):3318–3325. doi: 10.1021/pr060344+. [DOI] [PubMed] [Google Scholar]
- 24.Scopes RK. Measurement of Protein by Spectrophotometry at 205-Nm. Analytical Biochemistry. 1974;59(1):277–282. doi: 10.1016/0003-2697(74)90034-7. [DOI] [PubMed] [Google Scholar]
- 25.Bondar OP, Barnidge DR, Klee EW, et al. LC-MS/MS quantification of Zn-alpha 2 glycoprotein: A potential serum biomarker for prostate cancer. Clin. Chem. 2007;53(4):673–678. doi: 10.1373/clinchem.2006.079681. [DOI] [PubMed] [Google Scholar]
- 26.Hafner G, Peetz D, Erbes H, et al. Comparison of diagnostic performance of cardiac troponin I on the IMMULITE system with other automated troponin I assays in minor myocardial damage. Scand. J. Clin. & Lab. Invest. 2001;61(3):227–235. doi: 10.1080/003655101300133667. [DOI] [PubMed] [Google Scholar]
- 27.Maggiore U, Cristol JP, Canaud B, et al. Comparison of 3 automated assays for C-reactive protein in end-stage renal disease: Clinical and epidemiological implications. J. Lab. & Clin. Med. 2005;145(6):305–308. doi: 10.1016/j.lab.2005.03.002. [DOI] [PubMed] [Google Scholar]
- 28.Christenson RH, Apple FS, Morgan DL, et al. Cardiac troponin I measurement with the ACCESS (R) immunoassay system: analytical and clinical performance characteristics. Clin. Chem. 1998;44(1):52–60. [PubMed] [Google Scholar]
- 29.Apple FS, Maturen AJ, Mullins RE, et al. Multicenter clinical and analytical evaluation of the AxSYM troponin-I immunoassay to assist in the diagnosis of myocardial infarction. Clin. Chem. 1999;45(2):206–212. [PubMed] [Google Scholar]
- 30.Williams TI, Toups KL, Saggese DA, et al. Epithelial ovarian cancer: Disease etiology, treatment, detection, and investigational gene, metabolite, and protein biomarkers. J. Proteome Res. 2007;6(8):2936–2962. doi: 10.1021/pr070041v. [DOI] [PubMed] [Google Scholar]
- 31.Jeppsson JO, Kobold U, Barr J, et al. Approved IFCC reference method for the measurement of HbA(1c) in human blood. Clinical Chemistry and Laboratory Medicine. 2002;40(1):78–89. doi: 10.1515/CCLM.2002.016. [DOI] [PubMed] [Google Scholar]