Abstract
Previous studies have suggested that temporal effects in masking may be consistent with a decrease in cochlear gain. One paradigm used to show this is to measure the level of a long-duration masker required to just mask a short-duration tone that occurs near masker onset. The temporal effect is revealed when the signal is detected at a lower signal-to-noise ratio following preceding stimulation (either an extension of the masker or a separate precursor). The present study examined whether this effect depends on precursor level. The signal was a 10-ms, 4-kHz tone. The masker was 200 ms. A fixed-level precursor had the same frequency characteristics as the masker, and was 205 ms. The masker and precursor had either no notch or a wide notch about the signal frequency. For a given precursor level, the growth of masker level with signal level was determined. These data were used to estimate input–output functions. The results are consistent with a graded decrease in gain at the signal frequency when there is no notch in the masker and precursor, and a graded decrease in suppression when there is a large notch. These results could be consistent with the action of the medial olivocochlear reflex.
I. INTRODUCTION
A recent focus in psychoacoustic research has been the measurement of compression in the auditory system. The input–output function of the cochlea shows a compressive response for midlevel inputs, which is due to level-dependent amplification by the outer hair cells, an effect called the “active process” (for a review, see Robles and Ruggero, 2001). Many psychoacoustic effects are well explained by taking into account the transformation of stimuli by the input–output function of the cochlea (for a review, see Oxenham and Bacon, 2004). Although this input–output function is often assumed to be static, this paper provides evidence that it may change during the course of acoustic stimulation.
Evidence for a dynamic change in cochlear amplification comes from the fact that a short-duration signal presented at the onset of a masker (onset condition) is harder to hear than one delayed from the onset of the masker, or one preceded by another sound (precursor condition) (e.g. Scholl, 1962). This effect has been called overshoot (Zwicker, 1965) or, as in this paper, the temporal effect (Hicks and Bacon, 1992). Although the temporal effect may depend on effects at multiple levels of the auditory system, there is a growing body of evidence that it is consistent with a change in amplification at the level of the cochlea. Factors which affect the active process in the cochlea also tend to decrease the temporal effect. These factors include temporary threshold shift (Champlin and McFadden, 1989), permanent cochlear hearing loss (Bacon et al., 1988; Bacon and Takahashi, 1992; Kimberley et al., 1989; Strickland and Krishnan, 2005), and the ingestion of large amounts of aspirin (McFadden and Champlin, 1990). In these cases, the temporal effect is reduced because thresholds improve in the onset condition; that is, the onset condition thresholds move toward the precursor condition thresholds. Since factors which affect the active process produce thresholds that look more like the precursor condition, this suggests that the active process is less important, or the gain is reduced, in the precursor condition. This would imply that for normal-hearing listeners, gain decreases between the onset and precursor conditions, an idea proposed by Schmidt and Zwicker (1991) and developed in detail by von Klitzing and Kohlrausch (1994). In a series of papers, the author has shown that input–output functions derived from temporal effect data are consistent with a decrease in gain at the frequency of the stimulation preceding the signal (Strickland, 2001, 2004; Strickland and Krishnan, 2005). This results in a decrease in gain at the signal frequency, if preceding stimulation is at the signal frequency, or an apparent decrease in suppression, if the preceding stimulation is away from the signal frequency.
This dynamic response to sound could be mediated by the medial olivocochlear reflex (MOCR). The MOCR is a frequency-specific decrease in amplification caused by stimulation of the medial olivocochlear bundle, a pathway that feeds back to the outer hair cells of the cochlea from the level of the superior olivary complex (Warr and Guinan, 1979; Warr 1980). If the temporal effect is due to the action of the MOCR, the amount of decrease in gain should depend on the level of the preceding stimulation. The firing of MOC neurons has been shown to increase with sound level (Liberman, 1988). The effect of a contralateral sound on stimulus frequency otoacoustic emission level also increases with the level of the contralateral sound (Backus and Guinan, 2006). Several psychoacoustic studies of the temporal effect have examined the role of level, either by using a fixed precursor before the signal and masker (Zwicker, 1965; Carlyon, 1989; Hicks and Bacon, 1992; Strickland, 2001), or presenting a continuous noise band in addition to the masker and signal (Carlyon, 1987). These studies have shown that the temporal effect does change with precursor or continuous noise level, and that the most effective precursor level is at or just below the masker level. The purpose of the present study was to measure the effects of precursor level for multiple signal levels, so that input–output functions could be derived and the decrease in gain measured. The effect of precursor level was measured for a broadband masker and a masker with a large notch around the signal frequency, to measure effects of a decrease in gain at excitatory and suppressive masker frequencies.
II. METHODS
A. Stimuli
The signal was a 4 kHz sinusoid. This signal frequency was chosen because previous studies have shown temporal effects for noise maskers to be larger at higher frequencies (Carlyon, 1987; Bacon and Takahashi, 1992; Strickland 2001, 2004). The masker was a noise centered about the signal frequency. The outer spectral edges of the masker were fixed at 0.2fs and 1.8fs (0.8 and 7.2 kHz), where fs is the signal frequency. The masker was either broadband, or had a notch centered about the signal frequency. The relative notch edges are in units of Δf=|f-fs|/fs, where f is the frequency of the notch edge. The spectral edges of the notch were set at Δf=0.0 (no notch) or Δf=0.3 (2.8 and 5.2 kHz). The signal level was fixed, and the masker level varied to determine threshold. To measure the temporal effect, thresholds were also measured with a precursor before the signal and masker. The precursor was a noise with the same spectral characteristics as the masker, except that it was fixed in level for an entire range of signal levels.
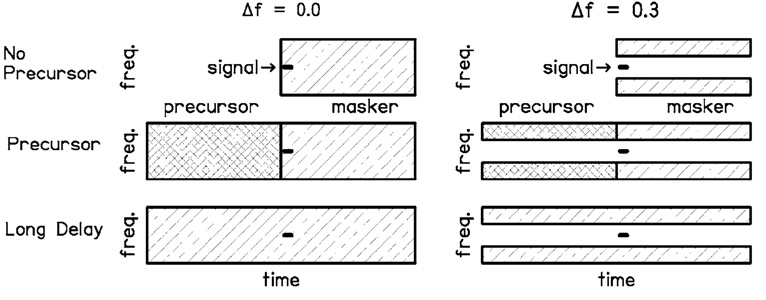
The signal duration was 10 ms, including 5-ms cos2 onset and offset ramps (no steady state). This duration was chosen to be short enough to show a temporal effect, but long enough to avoid effects of spectral splatter (Bacon and Viemeister, 1985). In the no-precursor and precursor conditions, the masker duration was 200 ms, including 8.5-ms cos2 onset and offset ramps. 1 The signal onset was delayed 2 ms from the masker onset. The precursor duration was 205 ms, including 8.5-ms cos2 onset and offset ramps. The precursor offset overlapped the masker onset by 5 ms (and thus overlapped the signal by 3 ms) Signal thresholds were also measured in the presence of the precursor with no simultaneous masker present. A long-delay condition was included for comparison with the precursor condition and with previous studies. In the long-delay condition, the masker was 400 ms, and the signal onset was delayed 202 ms from the masker onset. Conditions are shown schematically in Fig. 1.
FIG. 1.
Schematic showing the spectral and temporal characteristics of the signal, masker, and precursor for the no notch (Δf=0.0) and notch (Δf=0.3) conditions, for the no-precursor, precursor, and long-delay conditions.
The signal, masker, and precursor were digitally produced in the frequency domain at a sampling rate of 25 kHz, and were output through three separate D/A channels (TDT DA3-4). They were low-pass filtered at 10 kHz (TDT FT5 and FT6-2). The level was controlled by programmable attenuators (TDT PA4). In addition, for low signal levels, additional attenuation of the masker was provided by a manual attenuator (Leader LAT-45). The stimuli were mixed (TDT SM3), led to a headphone buffer (TDT HB6), and presented to one of two ER-2 insert earphones. These earphones have a flat frequency response from 250 to 8000 Hz.
B. Procedures
Listeners were tested in a double-walled sound-attenuating booth. Thresholds were measured using a three-interval forced-choice adaptive tracking procedure with a two-up, one-down stepping rule. This estimates the 71% correct point on the psychometric function (Levitt, 1971). Temporal intervals were marked visually on a computer monitor, and listeners responded via a computer keyboard. Visual feedback was provided. The initial step size was 5 dB, and was decreased to 2 dB after the second reversal. Thresholds were taken as the average of the last even number of reversals at the smaller step size in a set of 50 trials. Blocks for which the standard deviation was 5 dB or greater were discarded. At least two thresholds were averaged for each data point. Each listener was tested with at least two precursor levels. The number of levels used depended on the amount of time the subject was available for testing.
C. Subjects
Five listeners participated in the experiment, two males and three females. All had hearing thresholds within laboratory norms for long-duration signals at octave frequencies from 250 to 8000 Hz. The age range was from 18 to 43 years, with a median of 21 years.
III. RESULTS
A. On-frequency
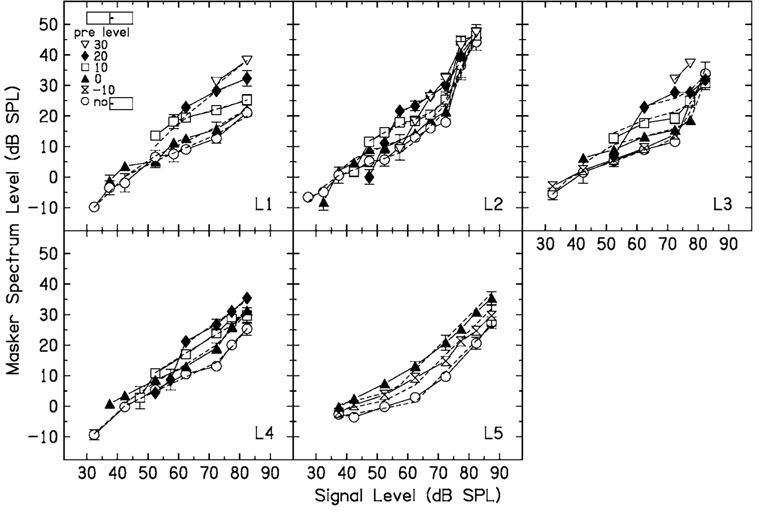
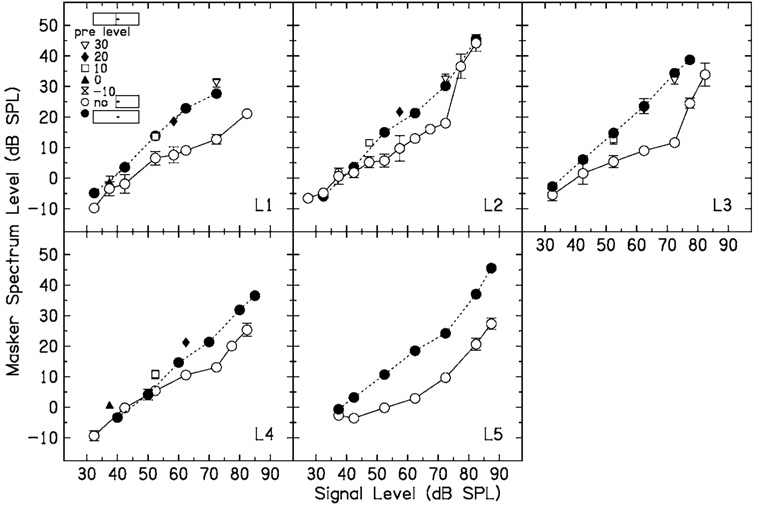
Results for individual listeners when Δf=0.0 are shown in Fig. 2. Open circles are masker thresholds with no precursor. The other symbols are masker thresholds following fixed-level precursors, with precursor levels shown in the legend in the upper left corner. Dashed lines are predictions from a model which will be discussed later. For a given signal level, the temporal effect is the difference between the open circles and each of the other symbols. The precursors increase quiet thresholds for the signal, so that the minimum signal level that could be tested increased with precursor level. At signal levels above threshold, the precursor increases the masker level at threshold, and thus causes a temporal effect. This effect tends to be greatest for midlevel signals. The temporal effect is graded, so that in general masker thresholds increase with increasing precursor level. Note that a precursor can have an effect even if it is below the level of the masker. For example, for L1, in the 10-dB precursor condition (open squares), the temporal effect was more than 10 dB, and a 20-dB masker level was required to mask the 60-dB SPL signal.
FIG. 2.
No-precursor (open circles) and precursor (other symbols, see the legend) data for five listeners when the masker and precursor Δf=0.0 (no notch). Dashed lines are predictions from a model (see the text for details).
The temporal effect was measured across multiple signal levels so that input–output functions could be derived for each of the precursor conditions. This was done to determine whether the gain of the derived input–output functions decreases as precursor level increases, which would be consistent with activation of the MOCR. As in previous studies, it was assumed that the thresholds represent a constant signal-plus-masker to masker ratio in a filter centered at the signal frequency after transformation by an approximation to the cochlear input–output function (Strickland, 2001, 2004; Strickland and Krishnan, 2005). This will be called the criterion ratio. The masker level was the level estimated to pass through a filter centered at the signal frequency. The equivalent rectangular bandwidth was 453 Hz, from a filter derived by Glasberg and Moore (2000) from data of Baker et al. (1998). Thus the masker levels were estimated as the threshold spectrum levels plus 26.6 dB. A function proposed by Yasin and Plack (2003) was used to fit the data. This function is composed of three linear sections described by the following:
Lin, the input level, Lout, the output level, and G are all in units of decibels. These three equations produce a three-line fit to the data, with slopes of 1 below the lower breakpoint (BP1, in hertz) and above the higher breakpoint (BP2, in hertz), and a section with a slope of less than 1 (c) between the two breakpoints. The factor k1, where k1=BP1(1−c), is a correction so that the sections are linked appropriately. The maximum gain, G, was calculated as −(BP2(c−1)+k1), so that above BP2 the output was constrained to equal the input, which is a modification from Yasin and Plack (2003).
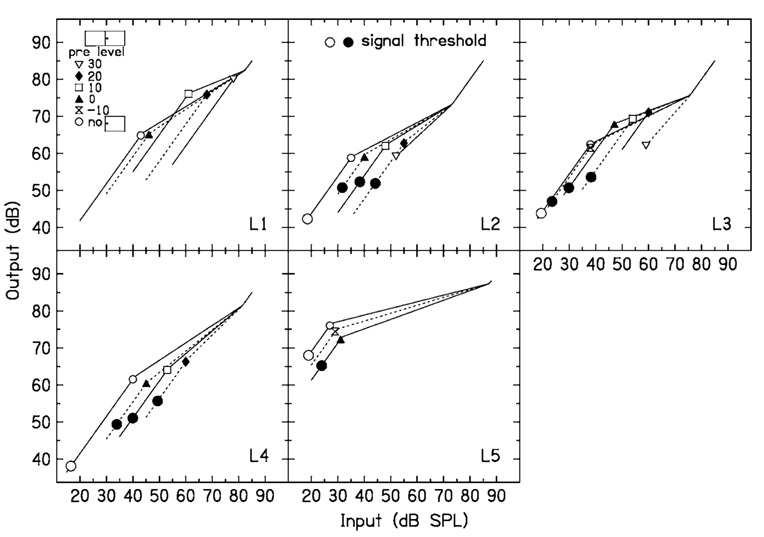
In general, the data for the no-precursor condition were fit first, with the constraints that BP1 and BP2 had to be within the data range, and 0<c<1. For listeners with no clear upper breakpoint in the data, BP2 was fixed at the highest signal level. The fitting program converged on the criterion ratio, c, BP1, and BP2. The criterion ratio and BP2 were then fixed at these values, and data for each precursor level were fit. For some listeners (e.g., L2 with a 20-dB precursor), the slope of the increase in masker level with signal level was greater than 1 at the lowest signal levels when there was a precursor present. This may be due to an effect near threshold that does not fit the model presented above. These points were excluded from the fits. The parameters of the input–output functions for the different subjects and conditions are shown in Table I. The derived input–output functions are shown in Fig. 3. Masker thresholds predicted by the model are shown by the dashed lines in Fig. 2. The model predicts the data well, so that in some cases the dashed line is obscured by the data.
TABLE I.
Parameters for three-line functions fit to the data in Fig. 2. Slope is the change in maximum gain with precursor level.
| Listener | Precursor level | Criterion | c | BP1 | BP2 | G | rms error | Slope |
|---|---|---|---|---|---|---|---|---|
| L1 | No | 15.49 | 0.43 | 44.5 | 82.4 | 21.45 | 1.04 | −0.59 |
| 0 | 0.47 | 46.9 | 18.77 | 2.31 | ||||
| 10 | 0.29 | 61.7 | 14.68 | 1.98 | ||||
| 20 | 0.41 | 69.7 | 7.51 | 2.04 | ||||
| 30 | 0.42 | 79.5 | 1.66 | 0.96 | ||||
| L2 | No | 8.51 | 0.36 | 35.6 | 73.6 | 24.33 | 1.02 | −0.58 |
| 0 | 0.40 | 41.2 | 19.47 | 0.98 | ||||
| 10 | 0.42 | 48.7 | 14.33 | 1.49 | ||||
| 20 | 0.55 | 55.8 | 7.95 | 0.36 | ||||
| 30 | 0.65 | 48.5 | 8.76 | 1.26 | ||||
| L3 | No | 11.07 | 0.34 | 38.7 | 75.7 | 24.32 | 0.45 | −0.51 |
| −10 | 0.35 | 39.4 | 23.47 | 1.25 | ||||
| 0 | 0.26 | 47.6 | 20.70 | 1.01 | ||||
| 10 | 0.27 | 54.8 | 15.20 | 0.80 | ||||
| 20 | 0.27 | 60.8 | 10.87 | 1.00 | ||||
| 30 | 0.82 | 59.7 | 2.68 | 0 | ||||
| L4 | No | 14.39 | 0.47 | 41.1 | 81.7 | 21.64 | 0.64 | −0.46 |
| 0 | 0.57 | 45.5 | 15.55 | 2.12 | ||||
| 10 | 0.60 | 53.7 | 11.13 | 0.87 | ||||
| 20 | 0.69 | 61.2 | 6.28 | 0.53 | ||||
| L5 | No | 6.08 | 0.18 | 28.2 | 87.4 | 48.59 | 0.56 | −0.41 |
| −10 | 0.21 | 30.3 | 44.90 | 0.72 | ||||
| 0 | 0.26 | 32.3 | 40.77 | 0.67 |
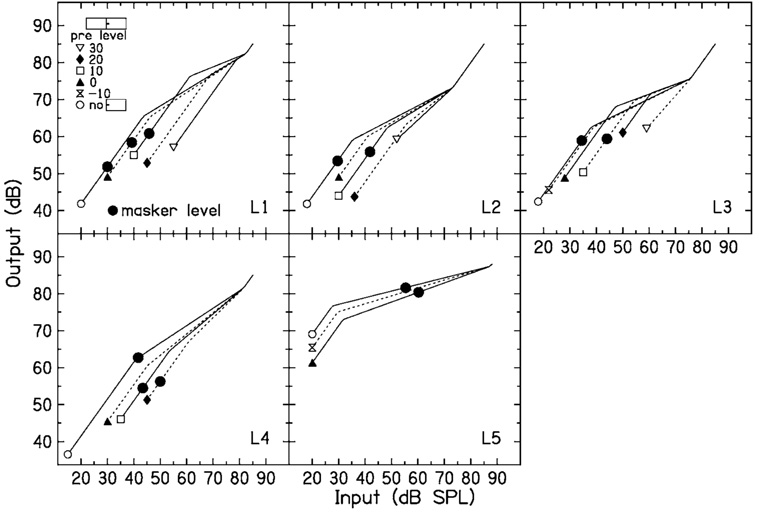
FIG. 3.
Input–output functions estimated from the data in Fig. 2. The small symbols correspond to the different precursor levels in Fig. 2. The large circles are thresholds measured either in quiet (open) or in the presence of a precursor (closed). These are plotted on the input–output function estimated with the same precursor.
In examining Table I and Fig. 3, it can be seen that BP1 systematically increases with precursor level, and the slope c increases slightly with precursor level for some listeners. The net effect is that maximum gain systematically decreases as precursor level increases. This decrease in gain is similar to the decrease in gain between normal-hearing and hearing-impaired listeners shown by Plack et al. (2004). The decrease in maximum gain is 4–6 dB for every 10 dB increase in precursor level, as shown by the values in the final column of Table I. For L2, the gain for the 30-dB precursor condition was not included in the fit in the final column, because the gain did not change between the 20- and the 30-dB precursor condition. Although a decrease in gain sounds as if it would be detrimental, it decreases the response to the masker more than the response to the signal (see, e.g., Strickland, 2004, Fig. 5), and this may be why the masker level has to be increased following a precursor.
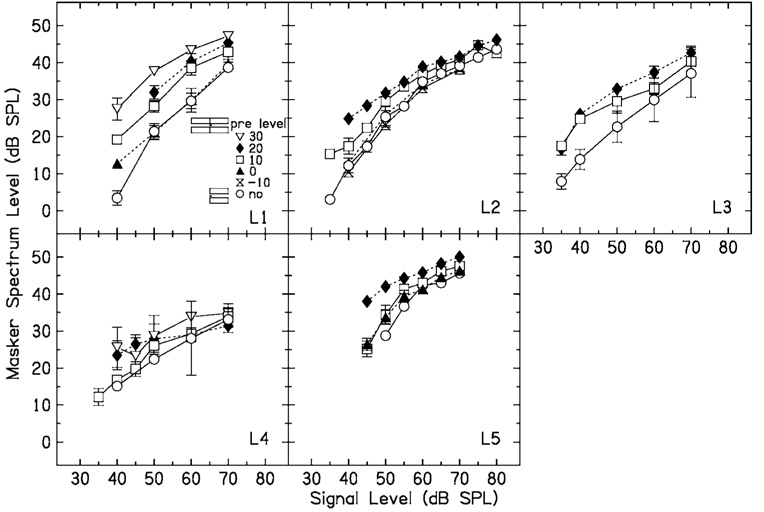
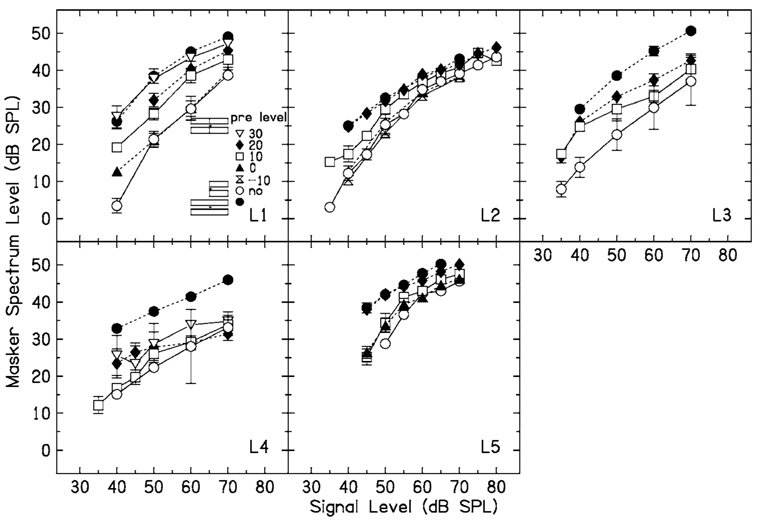
FIG. 5.
No-precursor (open circles) and precursor (other symbols, see the legend) data for five listeners when the masker and precursor Δf=0.3.
In general, the maximum gain values for the no-precursor condition are lower than values reported in Strickland (2004) and Strickland and Krishnan (2005). In those studies, a polynomial function from Glasberg and Moore (2000) was used to fit the data, rather than the three-line function used in the present paper. Informal tests from the author’s lab have found that the polynomial fit can give a maximum gain estimate that is over 20 dB higher than the estimate from the three-line fit. In the present paper, the main concern is with relative changes in gain, which would likely be the same with either fitting procedure. It is also important to note that the estimates of gain in all three of these studies are from simultaneous masking, and thus may include the effects of suppression, which would tend to decrease the gain.
On the input–output functions shown in Fig. 3, small symbols are plotted at BP1 of each function so that it may be paired with the legend indicating which precursor condition the fitted function represents. The large closed circles are thresholds for the signal in quiet and for the signal presented after the fixed-level precursors, with no simultaneous masker. The quiet threshold is plotted on the input–output function derived from the no-precursor data in Fig. 2; the threshold for the signal following a 0-dB spectrum level precursor is plotted on the input–output function for the 0-dB spectrum level precursor, etc. Missing symbols mean that the threshold was not measured. For a given listener, if the signal levels at threshold were all at the same output level, this would be consistent with forward masking by the precursor being due to a decrease in gain at the signal frequency place. For L5, the quiet threshold and the threshold in the presence of the precursor at 0-dB spectrum level are nearly equal. For L2, L3, and L4, the thresholds in the presence of a precursor are at an output above that for the signal in quiet, but are similar to each other. The precursor actually overlapped the signal by 3 ms, so some of the threshold shift following a precursor could be due to simultaneous masking. It is interesting to note, however, that Plack et al. (2004) found that when output levels for signal threshold were calculated in the same manner as noted earlier, the output levels for hearing-impaired listeners were above those for normal hearing listeners. Plack et al. suggested that this might indicate inner hair cell damage in the hearing-impaired listeners. If the precursor in the present study activates the MOCR, this would not be expected to affect the inner hair cells. Although the detection processes used near threshold may not be well understood, the thresholds shown in Fig. 3 show some support for the idea that forward masking is at least partially due to a decrease in gain at the signal frequency.
In Fig. 4, thresholds are shown for the long-delay condition (closed circles) and the no-precursor condition (open circles). Replotted from Fig. 2 are thresholds from conditions in which precursor and masker levels were nearly equal (individual symbols). Note that the long-delay function connects these points, as would be expected. The slope of the long-delay function is close to one, as has been noted in previous studies (Zwicker, 1965; Bacon, 1990). However, the long-delay function does not represent a condition where the gain is fixed at the signal frequency, but rather combines data across conditions where the gain is changing.
FIG. 4.
Long-delay (closed circles) thresholds when the masker and precursor Δf=0.0, along with noprecursor (open circles) thresholds from Fig. 2. Also replotted from Fig. 2 are thresholds when the precursor and masker were at approximately equal levels. The long-delay data trace along these points from the functions from Fig. 2.
B. Off-frequency
Results for the five listeners when Δf=0.3 are shown in Fig. 5. Some listeners showed a clear improvement in thresholds in the no-precursor condition across sessions, which was not the case when Δf=0.0. For these listeners, the initial runs were discarded and only the final values used. The presence of a precursor causes an increase in masker level, and this is graded with precursor level. The increase tends to be largest at low signal levels, and decreases to a fairly constant amount at higher signal levels.
How can these data be interpreted in terms of input–output functions? For this fairly wide notch width, the excitatory response to the masker at the signal place should be close to linear, based on physiological estimates from the chinchilla (Ruggero et al., 1997). If masking were purely excitatory, the masking function would give an estimate of the input–output function at the signal place (such as the input–output functions in Fig. 3). If the data are interpreted in this way, it can be seen that the change in the input–output functions is the opposite of what it was when Δf=0.0. That is, the lower breakpoint of the input–output function moves to the left, and the slope of the function at higher signal levels may decrease with precursor level. This would appear to be consistent with an increase in the gain of the function with precursor level.
This curious result may be explained if suppressive masking is also considered. Earlier studies have proposed that results in this type of condition, where the masker energy is removed from the signal frequency, could be consistent with a decrease in suppression with masker duration (Viemeister and Bacon, 1982; Carlyon, 1987; Strickland, 2004). Studies that have directly measured suppression using forward masking have shown that suppression decreases as suppressor onset precedes masker onset (Viemeister and Bacon, 1982; Thibodeau et al., 1991; Champlin and Wright, 1993) Some physiological data (Kiang et al., 1965; Arthur et al., 1971) also show that suppression decreases over the first tens of milliseconds of the suppressor tone.
If suppression decreases with increasing suppressor duration, the question is where this change would be taking place. There is some evidence that suppression may depend on gain at the suppressor frequency as well as the signal frequency, at least for suppressor frequencies above the signal frequency. Physiological data show that exposing the frequency region above a signal frequency to a high-intensity tone (Robertson and Johnstone, 1981) or to kanamycin (Dallos et al., 1980) decreases suppression without affecting the tuning curve at the signal frequency. Although it is not clear whether this is a within-channel or an across-channel effect, it seems worth exploring the hypothesis that a decrease in suppression may be caused by a decrease in gain at the suppressor frequency.
This may be illustrated using the input–output functions that were estimated in the Δf=0.0 condition for the signal place as an estimate of input–output functions at the masker/suppressor place. As in Strickland (2004), it was assumed that at the lowest signal levels in Fig. 5, suppression dominates because the masker does not yet produce enough activity at the signal place for excitatory masking. The suppression was assumed to come from frequencies above the signal frequency, because this region produces suppression at the lowest masker level (Cooper, 1996). It was also assumed that the suppressor level is determined by the gain in the masker region above the signal. This is an unorthodox assumption, but is supported by some psychophysical data (Bacon et al., 1988) and the physiological evidence discussed earlier. It will be assumed that the precursor affects the input–output function in the masker region in the same way that it did in the signal region when Δf=0.0. If the gain in the masker region decreases, then the masker level must be increased to cause the same amount of suppression. In Fig. 6, plots are made predicting what may be happening at the suppressor place. The input–output functions are the same as those in Fig. 3, which were derived for various precursor levels from the data in Fig. 2. The small symbols at the bottom of each function are included so that the input–output functions may be paired with the legend indicating which precursor condition the fitted function represents. The large closed circles are the masker levels for the lowest signal level for each listener in Fig. 5 at which there were multiple data points and also corresponding input–output functions [35 (L3, L4), 40 (L1, L2), or 50 dB SPL (L5)]. The masker level from the no-precursor condition is plotted on the input–output function estimated from the no-precursor condition, etc. For three listeners (L2, L3, and L5) the suppressor levels at output are fairly constant (within listener), while for L1 this is true for two of the three suppressor levels. This would support the idea that in this condition, the temporal effect could be consistent with a decrease in gain at the masker (suppressor) frequency. For listener L4, the masker output levels are lower with a precursor than with no precursor. In this case, the masking may be excitatory. This listener showed forward masking from the precursor at a level of 10 dB SPL, which was not observed for the other listeners.
FIG. 6.
The input–output functions from Fig. 3 are used as estimates of the input–output functions at the suppressor place. The symbols are masker values from Fig. 5 for signal levels of 35 (L3, L4), 40 (L1, L2), or 50 dB SPL (L5), the lowest signal levels for which multiple points could be plotted. In general, the output levels for the maskers are approximately equal, which would be consistent with the hypothesis that they are producing equal suppression of the signal.
At higher signal levels, it will be assumed that the masker also causes excitatory masking of the signal, in addition to suppression. It will also be assumed that the input–output function for the masker at the signal frequency is linear. As the masker level is increased, the excitatory masking should increase at a faster rate than the suppressive masking (Yasin and Plack, 2007). The presence of the precursor would still decrease suppression, but the masker level would only need to be increased enough to increase the excitatory masking by that amount. Thus the slopes of the functions will reflect mainly excitatory masking, but the decrease in suppression is reflected in the vertical shift in the functions. In Fig. 7, thresholds for a signal delayed 202 ms from the onset of the masker are added to the data from Fig. 5, for comparison with other studies. The long-delay function is nearly identical to (L1, L2, and L5) or is parallel to (L3 and L4) the function measured with the highest precursor level. This supports the idea that above a certain masker level, excitatory masking dominates, so the shape of the function remains the same.
FIG. 7.
Long-delay (closed circles) thresholds when the masker and precursor Δf=0.3, along with data replotted from Fig. 5. The long-delay thresholds are nearly equal to (L1, L2, and L5) or parallel to (L3 and L4) the functions for the highest precursor level.
IV. DISCUSSION
The data shown in this study are consistent with previous results, showing a graded temporal effect with precursor level. In previous studies (Carlyon, 1987; Bacon and Smith, 1991), the effect of precursor level was measured for one fixed masker level. Bacon and Smith used a noise at a spectrum level of 20 dB for most of their listeners, and found that signal threshold for a 4-kHz signal decreased roughly 10 dB for each 10 dB increase in precursor level, up to a precursor spectrum level of 10 dB SPL. This is consistent with the results in the present study. In Fig. 2, at a masker spectrum level of 20 dB on the y axis, signal thresholds decrease as the precursor spectrum level increases up to roughly 10 dB. Above this level, for this masker level, the precursor itself may be producing masking. One listener in the Bacon and Smith (1991) study was tested with a masker spectrum level of 40 dB, and showed smaller level effects. In the present study L2 also shows smaller effects of precursor level at this higher masker level.
This study adds to previous results by quantifying the temporal effect in terms of changes in gain. The presence of a precursor decreased gain fairly linearly over a certain range. This suggests that the temporal effect acts like an automatic gain control, somewhat akin to the middle ear acoustic reflex. As the input increases, the maximum gain decreases. Previous studies have shown that thresholds were at the lowest signal-to-masker ratio when the precursor level was at or slightly below the masker level (Carlyon, 1987; Bacon and Smith, 1991). This is also true in the present study. In Fig. 2, the ratio of the signal level to the masker level at threshold is lowest when the precursor and the masker are at approximately equal levels. In natural environments, there would usually be continuous noise, not separate precursors and maskers. The results suggest that the auditory system may optimize the signal-to-noise ratio in this situation by adjusting the gain appropriately. The decrease in gain turns the output masker level down more than the signal, when the masker level is lower than the signal level as it was in the present conditions, improving the signal-to-noise ratio at the output of the cochlea. The long-delay results in Fig. 4 show that this adjustment results in a linear growth of masking.
The size of the temporal effect also depends on whether the masker and precursor are on-frequency or off-frequency relative to the signal. The results support the interpretation by Strickland (2004) that gain is decreased in the frequency region of the precursor. If this includes the signal frequency, the result is a decrease in gain at the signal frequency. If the precursor only contains energy at the suppressor frequency, the results are consistent with a decrease in gain at the suppressor frequency, leading to a decrease in suppression at the signal frequency.
Both of these results would be consistent with activation of the MOCR. Although there is a large body of research on the MOCR, its function is still not at all well understood. There is a small amount of behavioral data from animal studies showing efferent-mediated changes in response to sound. Smith et al. (2000) found that contralateral noise raised behavioral thresholds for tones in Japanese macaques, and that this effect disappeared with sectioning of the medial olivo-cochlear bundle. May and McQuone (1995) reported that cats showed a decrease in the ability to detect intensity changes in 8-kHz tones presented in ipsilateral noise after sectioning of the medial olivocochlear bundle. A recent comprehensive review article by Guinan (2006) mentioned almost no behavioral data on the action of the MOCR in humans.
The present study provides behavioral data in humans that would be consistent with the action of the MOCR. An examination of Fig. 2 provides evidence for what the role of the temporal effect might be when the masker and precursor are on-frequency. The precursor may be thought of as ongoing background noise. As the precursor level is increased, for a range of signal levels, the signal is audible in higher and higher levels of masking noise. This is consistent with a decrease in gain within the signal channel. Thus, decreasing the gain in response to background noise may optimize audibility. Likewise, Fig. 5 shows what happens when the interfering sound is probably partly suppressing the signal. As the level of the background sound is increased, the signal is audible in increasing levels of noise. Thus the temporal effect may be evidence that the auditory system decreases its response to ongoing stimuli, which optimizes the response to changing stimuli.
ACKNOWLEDGMENT
This research was partially supported by a grant from NIH (No. R03 DC03510).
Footnotes
Portions of this research were presented at the 141st Meeting of the Acoustical Society of America, Chicago, IL.
The onset and offset times were intended to be 5 ms for all the stimuli. The TDT function sets onset and offset times from 10% to 90% of maximum. For a nominal rise/fall time of 5 ms, the rise/fall time from 0 to 100% of maximum is approximately 8.5 ms. The signal had no steady state, so the rise/fall times were 5 ms, but the level of the signal was affected because the middle was affected by the onset and the offset ramp. The reported signal levels are approximately 7.6 dB below the nominal signal levels. The gating was still close to cos2.
References
- Arthur RM, Pfeiffer RR, Suga N. Properties of ‘two-tone inhibition’ in primary auditory neurons. J. Physiol. (London) 1971;212:593–609. doi: 10.1113/jphysiol.1971.sp009344. [DOI] [PMC free article] [PubMed] [Google Scholar]
- Backus BC, Guinan JJ., Jr Time-course of the human medial olivocochlear reflex. J. Acoust. Soc. Am. 2006;119:2889–2904. doi: 10.1121/1.2169918. [DOI] [PubMed] [Google Scholar]
- Bacon SP. Effect of masker level on overshoot. J. Acoust. Soc. Am. 1990;88:698–702. doi: 10.1121/1.399773. [DOI] [PubMed] [Google Scholar]
- Bacon SP, Hedrick MS, Grantham DW. Temporal effects in simultaneous pure-tone masking in subjects with high-frequency sensorineural hearing loss. Audiology. 1988;27:313–323. doi: 10.3109/00206098809081602. [DOI] [PubMed] [Google Scholar]
- Bacon SP, Smith MA. Spectral, intensive, and temporal factors influencing overshoot. Q. J. Exp. Psychol. A. 1991;43A:373–399. doi: 10.1080/14640749108400978. [DOI] [PubMed] [Google Scholar]
- Bacon SP, Takahashi GA. Overshoot in normal-hearing and hearing-impaired subjects. J. Acoust. Soc. Am. 1992;91:2865–2871. doi: 10.1121/1.402967. [DOI] [PubMed] [Google Scholar]
- Bacon SP, Viemeister NF. Simultaneous masking by gated and continuous sinusoidal maskers. J. Acoust. Soc. Am. 1985;78:1220–1230. doi: 10.1121/1.392890. [DOI] [PubMed] [Google Scholar]
- Baker RJ, Rosen S, Darling AM. An efficient characterization of human auditory filtering across level and frequency that is also physiologically reasonable. In: Palmer AR, Rees A, Summerfield AQ, Meddis R, editors. Psychophysical and Physiological Advances in Hearing. London: Whurr; 1998. [Google Scholar]
- Carlyon RP. A release from masking by continuous, random, notched noise. J. Acoust. Soc. Am. 1987;81:418–426. doi: 10.1121/1.395117. [DOI] [PubMed] [Google Scholar]
- Carlyon RP. Changes in the masked thresholds of brief tones produced by prior bursts of noise. Hear. Res. 1989;41:223–235. doi: 10.1016/0378-5955(89)90014-2. [DOI] [PubMed] [Google Scholar]
- Champlin CA, McFadden D. Reductions in overshoot following intense sound exposures. J. Acoust. Soc. Am. 1989;85:2005–2011. doi: 10.1121/1.397853. [DOI] [PubMed] [Google Scholar]
- Champlin CA, Wright BA. Manipulations of the duration and relative onsets of two-tone forward maskers. J. Acoust. Soc. Am. 1993;94:1269–1274. doi: 10.1121/1.408179. [DOI] [PubMed] [Google Scholar]
- Cooper NP. Two-tone suppression in cochlear mechanics. J. Acoust. Soc. Am. 1996;99:3087–3098. doi: 10.1121/1.414795. [DOI] [PubMed] [Google Scholar]
- Dallos P, Harris DM, Relkin E, Cheatham MA. Two-tone suppression and intermodulation distortions in the cochlea: Effect of outer hair cell lesion. In: Van den Brink G, Bilsen FA, editors. Psychophysical, Physiological and Behavioural Studies in Hearing. Delft, The Netherlands: Delft University Press; 1980. pp. 242–249. [Google Scholar]
- Glasberg BR, Moore BCJ. Frequency selectivity as a function of level and frequency measured with uniformly exciting notched noise. J. Acoust. Soc. Am. 2000;108:2318–2328. doi: 10.1121/1.1315291. [DOI] [PubMed] [Google Scholar]
- Guinan JJ., Jr Olivocochlear efferents: Anatomy, physiology, function, and the measurement of efferent effects in humans. Ear Hear. 2006;27:589–607. doi: 10.1097/01.aud.0000240507.83072.e7. [DOI] [PubMed] [Google Scholar]
- Hicks ML, Bacon SP. Factors influencing temporal effects with notched-noise maskers. Hear. Res. 1992;64:123–132. doi: 10.1016/0378-5955(92)90174-l. [DOI] [PubMed] [Google Scholar]
- Kiang NY-S, Watanabe T, Thomas EC, Clark LF. Monograph No. 35. Cambridge, MA: MIT; 1965. Discharge patterns of single fibers in the cat’s auditory nerve. [Google Scholar]
- Kimberley BP, Nelson DA, Bacon SP. Temporal overshoot in simultaneous-masked psychophysical tuning curves from normal and hearing-impaired listeners. J. Acoust. Soc. Am. 1989;85:1660–1665. doi: 10.1121/1.397954. [DOI] [PubMed] [Google Scholar]
- Levitt H. Transformed up-down methods in psychoacoustics. J. Acoust. Soc. Am. 1971;49:467–477. [PubMed] [Google Scholar]
- Liberman MC. Response properties of cochlear efferent neurons: Monaural vs. binaural stimulation and the effects of noise. J. Neurophysiol. 1988;60:1779–1798. doi: 10.1152/jn.1988.60.5.1779. [DOI] [PubMed] [Google Scholar]
- May BJ, McQuone SJ. Effects of bilateral olivocochlear lesions in pure-tone intensity discrimination in cats. Aud. Neurosci. 1995;1:385–4000. [PMC free article] [PubMed] [Google Scholar]
- McFadden D, Champlin CA. Reductions in overshoot during aspirin use. J. Acoust. Soc. Am. 1990;87:2634–2642. doi: 10.1121/1.399056. [DOI] [PubMed] [Google Scholar]
- Oxenham AJ, Bacon SP. Psychophysical manifestations of compression: Normal-hearing listeners. In: Bacon SP, Fay RR, Popper AN, editors. Compression. New York: Springer; 2004. pp. 62–106. [Google Scholar]
- Plack CJ, Drga V, Lopez-Poveda EA. Inferred basilarmembrane response functions for listeners with mild to moderate sensorineural hearing loss. J. Acoust. Soc. Am. 2004;115:1684–1695. doi: 10.1121/1.1675812. [DOI] [PubMed] [Google Scholar]
- Robertson D, Johnstone BM. Primary auditory neurons: Nonlinear responses altered without changes in sharp tuning. J. Acoust. Soc. Am. 1981;69:1096–1098. doi: 10.1121/1.385689. [DOI] [PubMed] [Google Scholar]
- Robles L, Ruggero MA. Mechanics of the mammalian cochlea. Physiol. Rev. 2001;81:1305–1352. doi: 10.1152/physrev.2001.81.3.1305. [DOI] [PMC free article] [PubMed] [Google Scholar]
- Ruggero MA, Rich NC, Recio A, Narayan SS, Robles L. Basilar-membrane responses to tones at the base of the chinchilla cochlea. J. Acoust. Soc. Am. 1997;101:2151–2163. doi: 10.1121/1.418265. [DOI] [PMC free article] [PubMed] [Google Scholar]
- Schmidt S, Zwicker E. The effect of masker spectral asymmetry on overshoot in simultaneous masking. J. Acoust. Soc. Am. 1991;89:1324–1330. doi: 10.1121/1.400656. [DOI] [PubMed] [Google Scholar]
- Scholl H. “Das dynamische verhalten des gehörs bei der unterteilung des schallspektrums in frequenzgruppen” (“The dynamic performance of the hearing system when separating the sound spectrum into critical bands”) Acustica. 1962;12:101–107. [Google Scholar]
- Smith DW, Turner DA, Hensen MM. Psychophysical correlates of contralateral efferent suppression. I. The role of the medial olivocochlear system in ‘central masking’ in nonhuman primates. J. Acoust. Soc. Am. 2000;107:933–941. doi: 10.1121/1.428274. [DOI] [PubMed] [Google Scholar]
- Strickland EA. The relationship between frequency selectivity and overshoot. J. Acoust. Soc. Am. 2001;109:2063–2073. doi: 10.1121/1.1357811. [DOI] [PubMed] [Google Scholar]
- Strickland EA. The temporal effect with notched-noise maskers: Analysis interms of input-output functions. J. Acoust. Soc. Am. 2004;115:2234–2245. doi: 10.1121/1.1691036. [DOI] [PubMed] [Google Scholar]
- Strickland EA, Krishnan LA. The temporal effect in listeners with mild to moderate cochlear hearing impairment. J. Acoust. Soc. Am. 2005;118:3211–3217. doi: 10.1121/1.2074787. [DOI] [PubMed] [Google Scholar]
- Thibodeau LM, Champlin CA, Stiritz L. Suppressor duration effects in forward masking. J. Acoust. Soc. Am. 1991;90:2268(A). [Google Scholar]
- Viemeister NF, Bacon SP. Forward masking by enhanced components in harmonic complexes. J. Acoust. Soc. Am. 1982;71:1502–1507. doi: 10.1121/1.387849. [DOI] [PubMed] [Google Scholar]
- von Klitzing R, Kohlrausch A. Effect of masker level on overshoot in running- and frozen-noise maskers. J. Acoust. Soc. Am. 1994;95:2192–2201. doi: 10.1121/1.408679. [DOI] [PubMed] [Google Scholar]
- Warr WB. Efferent components of the auditory system. Ann. Otol. Rhinol. Laryngol. 1980;90:114–190. doi: 10.1177/00034894800890s527. [DOI] [PubMed] [Google Scholar]
- Warr WB, Guinan JJ., Jr Efferent innervation of the organ of Corti: Two separate systems. Brain Res. 1979;173:152–155. doi: 10.1016/0006-8993(79)91104-1. [DOI] [PubMed] [Google Scholar]
- Yasin I, Plack CJ. The effects of a high-frequency suppressor on tuning curves and derived basilar-membrane response functions. J. Acoust. Soc. Am. 2003;114:322–332. doi: 10.1121/1.1579003. [DOI] [PubMed] [Google Scholar]
- Yasin I, Plack CJ. The effects of low- and high-frequency suppressors on psychophysical estimates of basilar-membrane compression and gain. J. Acoust. Soc. Am. 2007;121:2832–2841. doi: 10.1121/1.2713675. [DOI] [PubMed] [Google Scholar]
- Zwicker E. Temporal effects in simultaneous masking by white-noise bursts. J. Acoust. Soc. Am. 1965;37:653–656. doi: 10.1121/1.1909588. [DOI] [PubMed] [Google Scholar]


