Abstract
Increasing the level of neurotrophins within the CNS may have therapeutic efficacy in patients with various neurological diseases. Earlier we have demonstrated that myelin basic protein (MBP)-primed T cells induce the expression of various proinflammatory molecules in glial cells via cell-to-cell contact. Here we describe that after Th2 polarization by gemfibrozil or other drugs, MBP-primed T cells induced the expression of neurotrophic molecules such as, brain-derived neurotrophic factor (BDNF) and neurotrophin-3 (NT-3) but not proinflammatory molecules in microglia and astroglia via cell-to-cell contact. MBP-primed Th2 cells expressed α5 and β3 integrins and functional blocking antibodies against both α5 and β3 integrins inhibited the ability of MBP-primed Th2 cells to induce glial neurotrophins. On the other hand, glial cells expressed PDGF-Rβ and neutralization of this glial receptor abrogated the ability of Th2 cells to induce neurotrophins in glia. Activation of glial cAMP response element-binding protein (CREB) by MBP-primed Th2 cell contact and inhibition of contact-mediated expression of neurotrophins by antisense knockdown of glial CREB suggest that MBP-primed Th2 cell-glia contact induces the expression of neurotrophins through glial activation of CREB. Accordingly, blocking of either α5β3 integrins on T cells or PDGF-Rβ on glial cells impaired the ability of MBP-primed Th2 cells to induce glial activation of CREB. Furthermore, we demonstrate that these MBP-primed Th2 cells entered into the CNS and increased the expression of neurotrophins in vivo in the brain. This study illuminates the importance of α5β3 and PDGF-Rβ in guiding the novel neurotrophic property of neuroantigen-primed T cells via activation of CREB that may be of therapeutic importance in various neurological disorders.
Neurotrophins are a family of molecules that stimulate and control neurogenesis and support the survival of existing neurons. Some neurotrophins also support proliferation and differentiation of oligodendroglial progenitors and normal health of oligodendrocytes (1,2). Consistently, in neurodegenerative and neuroinflammatory disorders, which are hallmarked by the loss of neurons and oligodendrocytes, neurotrophins have been suggested as rescuers of these vulnerable cells. Various neurotrophic molecules including brain-derived neurotrophic factor (BDNF), glial-derived neurotrophic factor (GDNF) and and neurotrophin-3 (NT-3) exhibit protective effects in cell culture models of different neurodegenerative disorders (3–5). However, clinical application of those molecules has been limited because of difficulties in delivery. These peptides do not readily diffuse across the blood-brain barrier (BBB) or ventricular lining and have limited or unstable bioavailability (6). Gene delivery by stereotactic injection is definitely an option but it has several limitations. It seems from the therapeutic angle, the best option is to stimulate/induce the production of neurotrophic factors within the CNS of patients with neurodegenerative and neuroinflammatory diseases. Although neurons produce neurotrophins under physiological conditions, it is glial cells (microglia and astroglia) that produce neurotrophins under pathophysiological conditions. Therefore, understanding the mechanism by which neurotrophic factors are generated in glial cells is an important area of research.
The presence of neuroantigen-primed T cells recognizing self-myelin antigens within the CNS is necessary for the development of demyelinating disease like multiple sclerosis (MS). Due to antigen specificity, these cells move towards the CNS, cross the blood-brain barrier (BBB) and initiate inflammatory disease in the CNS of MS patients. Recently we have shown that myelin basic protein (MBP)-primed T cells induce microglial expression of inducible nitric oxide synthase (iNOS) and proinflammatory cytokines (IL-1β, IL-1α, TNF-α and IL-6) through cell-cell contact (7,8). It is to be noted that not only the proinflammatory molecules but also the neurotrophic factors may be released from microglia and astroglia upon activation (9). However, molecular pathways that may redirect activated glial cells to secrete neurotrophic factors not proinflammatory molecules have been poorly defined. Here we describe a novel mechanism to stimulate the release of neurotrophic factors from microglia and astroglia. After Th2 polarization by gemfibrozil, an FDA-approved lipid-lowering drug, or other immunomodulatory drugs, MBP-primed Th2 cells induced the expression of neurotrophic factors in both microglia and astroglia. We also demonstrate for the first time that α5β3 integrin on T cell surface and platelet-derived growth factor receptor β (PDGF-Rβ) on glial cells played an important role in Th2 cell contact-mediated glial expression of neurotrophins through the regulation of glial activation of CREB. Furthermore, these gemfibrozil-modified MBP-primed Th2 cells entered into the CNS and increased the expression of neurotrophins in vivo in the CNS.
MATERIALS AND METHODS
Reagents
Fetal bovine serum (FBS), Hank’s balanced salt solution (HBSS), DMEM/F-12, RPMI 1640, L-glutamine, and β-mercaptoethanol (β-ME) were purchased from Mediatech. Gemfibrozil and sodium phenylacetate was obtained from Sigma. Mouse recombinant IL-4 was obtained from R&D. Antibodies against mouse IL-12, FITC-labeled and functional blocking antibodies against α4, α5, β1, and β3 integrins were purchased from BD Pharmingen. Functional blocking antibodies against PDGF-Rβ and VEGF-R were purchased from eBioscience. Bovine myelin basic protein was purchased from Invitrogen.
Isolation of MBP-primed T cells
MBP-primed T cells were isolated from lymph nodes of MBP-immunized mice as described earlier (7,8). Briefly, female SJL/J mice were immunized s.c. with 400 μg of bovine MBP and 60 μg Mycobacterium tuberculosis (H37RA; Difco Labs.) in IFA (Calbiochem). Lymph nodes were collected from these mice and single cell suspension was prepared in RPMI 1640 medium containing 10% FBS, 2 mM L-glutamine, 50 μM β-ME, 100 U/ml penicillin and 100 μg/ml streptomycin. Cells were cultured at a concentration of 4–5 × 10⁶ cells/ml in six-well plates. Cells isolated from MBP-immunized mice were incubated with 50 μg/ml of MBP in the presence or absence of gemfibrozil or sodium phenylacetate for 4 days.
Isolation of Mouse Primary Astroglia and Microglia
Microglia and astroglia were isolated from mixed glial cultures of 7 d old mouse pups according to the procedure of Guilian and Baker (10) as described earlier (8,11). Briefly, on day 7 to 9 d of culture, the mixed glial cultures were washed 3 times with DMEM/F-12 and subjected to a shake at 240 rpm for 2 h at 37°C on a rotary shaker. While floating cells were used to purify microglia, adherent cells were shaken again on 11 d to remove residual microglia and more than ninety-eight percent of adherent cells were positive for astroglial marker glial fibrillary acidic protein (GFAP). On the other hand, floating cells were washed and allowed to adhere on tissue culture dishes at 37°C for 30 min. Ninety to ninety-five percent of adhered cells was found to be positive for Mac-1 surface antigen.
Stimulation of glial cells by MBP-primed T cell contact
Primary glial cells were stimulated with different concentrations of MBP-primed T cells under serum-free condition. After 1 h of incubation, culture dishes were shaken and washed thrice with HBSS to lower the concentration of T cells. Earlier we have shown by FACS analysis of adherent microglial cells using FITC-labeled anti-CD3 antibodies that more than 80% T cells were removed from microglial cells by this procedure (7).
Labeling of T cells with Alexa 680-SE NIR dye for cell tracking
T cells were labeled with Alexa 680-SE NIR dye (Invitrogen) following the manufacturer’s protocol. Briefly, the dye was initially dissolved with DMEM to prepare 1mM stock and stored at −20°c in moisture free condition. The dye was diluted to 15– 20 μM in pre-warmed (37°C) PBS just before the beginning of experiment. T cells were washed and suspended in pre-warmed PBS containing alexa 680 and incubated for 30 mins at 37°C. After incubation, cells were washed five times to remove free dye and resuspended in PBS again. Labeled MBP-primed T cells (107 cells/mouse) were transferred to naïve female SJL/J mice through tail vein (12,13). After 5 d of injection, the movement of T cells was detected by scanning mice in Odyssey (ODY-0854, Licor-Inc) infra-red scanner at 700 nm channel.
Immunocytochemistry
After 5 d of transfer of T cells, mice were perfused with PBS (pH 7.4) and then with 4% (w/v) paraformaldehyde solution in PBS followed by dissection of cerebellum from each mouse for immunofluorescence microscopy (12,13). Briefly, samples were incubated in PBS containing 0.05% Tween 20 (PBST), 10% sucrose for 3 h and then 30% sucrose overnight at 4C. Cerebellar tissues were then embedded in O.C.T (Tissue tech) at −80C, and processed for conventional cryosectioning. Frozen sections (10 μm) were treated with cold ethanol (−20C) followed by 2 rinses in PBS. Samples were blocked with 3% BSA in PBST and incubated in PBST-BSA and primary antibodies. For double-labeling, tissue sections were incubated with rabbit anti-BDNF (Santa Cruz) (1:200) along with one of the following antibodies: rat anti-mouse CD11b (Chemicon) (1:200), goat anti-GFAP (Santa Cruz) (1:200) and goat anti-CD3 (Biosource International) (1:200)]. After three washes in PBST, sections were further incubated with Cy2 and Cy5 (Jackson ImmunoResearch Laboratories, Inc.). For negative controls, a set of sections was incubated under similar conditions without the primary antibodies. The samples were mounted and observed under a BioRad MRC1024ES confocal laser scanning microscope.
Number of T cells was counted in cerebellar sections in an Olympus IX81 fluorescence microscope using the MicroSuite™ imaging software, version FIVE.
Th2 conditioning of MBP-primed T cells
For Th2 conditioning, cells were incubated with 50 μg/ml MBP in the presence of 3 μg/ml anti-IL-12 (R&D) and 100 ng/ml IL-4 (R&D) as described earlier (13). Following 4 days of incubation, supernatants were collected to assay IFN-γ and IL-10.
Isolation of plasma membranes of MBP-primed T cells
Plasma membranes of MBP-primed and gemfibrozil-treated MBP-primed T cells were prepared by sonication and centrifugation as described earlier (14). Briefly, the cells were broken up by sonication, and the nuclear fraction was discarded after centrifugation for 10 min at 4,000g. The supernatant were centrifuged for 45 min at 100,000g. The pellet of T cell membranes was resuspended at 50 × 106 cell equivalents/ml by sonication in HBSS containing 20 μM EDTA and 5 μM iodoacetamide. Then microglial cells were stimulated by plasma membranes (0.5:1 of T cells:microglia) in serum-free DMEM/F-12.
Assay for NO Synthesis
Culture supernatants were assayed for nitrite, a stable reaction product of NO with molecular oxygen, using ‘Griess’ reagent as described earlier (7,11,14).
Assay for TNF-α and IL-1β synthesis
Concentrations of TNF-α and IL-1β were measured in culture supernatants by a high-sensitivity enzyme-linked immunosorbent assay (ELISA; Pharmingen, USA) according to manufacturer’s instruction as described earlier (8,14).
Assay for BDNF and NT-3 synthesis
Concentrations of BDNF and NT-3 were measured in culture supernatants by a high-sensitivity enzyme-linked immunosorbent assay (ELISA; Promega) according to manufacturer’s instruction.
RNA isolation and semi-quantitative RT-PCR analysis
It was performed as described earlier (13,15) using a RT-PCR kit from Clontech and following primer sequences.
BDNF: Sense: 5′-AGG CAA CTT GGC CTA CCC AGG TGT G-3′
Antisense: 5′-TAC TGT CAC ACA CGC TCA GCT CCC C-3′
NT-3: Sense: 5′-CTC CAT GAG CTT TGT ACA AGG-3′
Antisense: 5′-TGC TGA TGT ACC AGT TGG GG-3′
PDGFR-α Sense: 5′-TTA CCC TCT ATC CTC CCA AAC GA-3′
Antisense: 5′-GGG CAG CAC ATT CAT ACT CTC C-3′
PDGFR-β Sense: 5′-ATT CCG TGC CGA GTG ACA GAC CC-3′
Antisense: 5′-AGT AGC CCG CTT CTG ACA CCT T -3′
GAPDH: Sense: 5′-GGT GAA GGT CGG TGT GAA CG-3′
Antisense: 5′-TTG GCT CCA CCC TTC AAG TG-3′
Analysis of different integrins by gene array
Expression of different integrins was analyzed in MBP-primed Th1 and Th2 cells by a RT-PCR-based gene array kit (GEArray™) from SuperArray, Inc. following manufacturer’s protocol.
Real-time PCR analysis
It was performed using the ABI-Prism7700 sequence detection system (Applied Biosystems) as described earlier (13,15). All primers and FAM-labeled probes for mouse BDNF, NT-3 and GAPDH were obtained from Applied Biosystems.
Assay of transcriptional activity of CREB
Astrocytes plated at 50 to 60% confluence in twelve-well plates were cotransfected with 0.25 μg of pCRE-Luc (CREB-dependent reporter construct) and 12.5 ng of pRL-TK (a plasmid encoding Renilla luciferase; Promega) using Lipofectamine-Plus (Invitrogen). After 24 h of transfection, cells were stimulated with Th1 and Th2 cells. After 1 h of stimulation, culture dishes were shaken and washed thrice with HBSS to lower T cell concentration. Then adherent astrocytes were incubated with serum-free media for 5 h followed by analysis of firefly and Renilla luciferase activities as described earlier (16).
RESULTS
MBP-primed Th1 but not Th2 cells induced the expression of proinflammatory molecules in mouse primary microglia by cell-to-cell contact
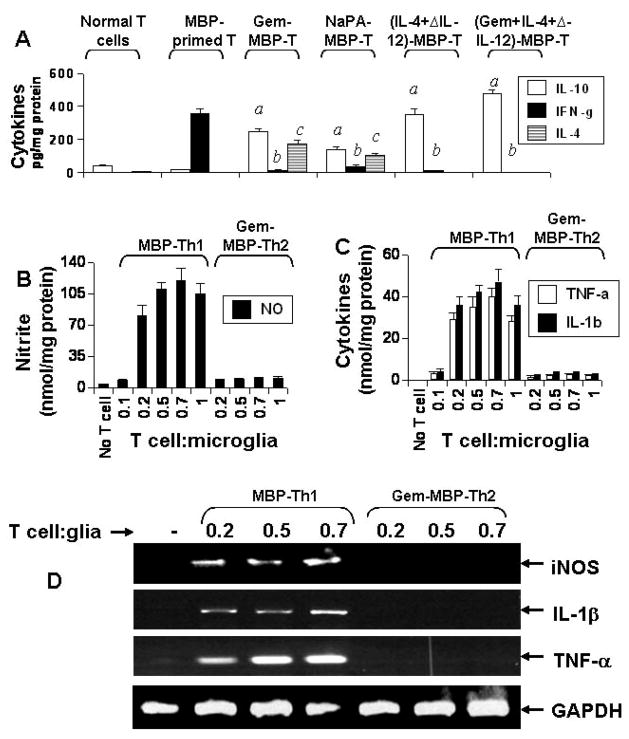
MBP-primed T cells isolated from MBP-immunized mice released high amount of IFN-γ (a Th1 cytokine) and very little IL-4 and IL-10 (Th2 cytokines) (Fig. 1A). For switching towards Th2, we used gemfibrozil (gem) that has been reported to favor the differentiation of neuroantigen-primed T cells towards the Th2 mode (17) and sodium phenylacetate (NaPA) that has been shown to suppress the adoptive transfer of experimental allergic encephalomyelitis (EAE) (12). Both the drugs suppressed the production of IFN-γ and stimulated the production of IL-4 and IL-10 (Th2 cytokines) by MBP-primed T cells (Fig. 1A). As expected, after Th2 conditioning in the presence of IL-4 and anti-IL-12, MBP-primed T cells also produced less IFN-γ (a Th1 cytokine) and more IL-10 (a Th2 cytokine) compared to untreated MBP-primed T cells (Fig. 1A).
Fig. 1. MBP-primed Th1 but not Th2 cells induce the expression of proinflammatory molecules in mouse primary microglia.
MBP-primed T cells isolated from lymph nodes of MBP-immunized mice were treated with gemfibrozil (Gem), sodium phenylacetate (NaPA) or the combination of IL-4 and anti-IL-12 antibodies for 4 d followed by assay of Th1 (IFN-γ) and Th2 (IL-4 and IL-10) cytokines (A). Data are mean ± S.D. of three different experiments. ap < 0.001 vs IL-10 of MBP-primed T cells; bp < 0.001 vs IFN-γ of MBP-primed T cells; cp < 0.001 vs IL-4 of MBP-primed T cells. Primary microglia received different concentrations of MBP-primed Th1 cells and gem-treated MBP-primed Th2 cells in direct contact under serum-free condition. After 1 h of contact, culture dishes were shaken and washed thrice with HBSS to remove T cells followed by incubation of adherent microglia in serum-free media. After 23 h of incubation, supernatants were used to assay nitrite (B) and proinflammatory cytokines (TNF-α and IL-1β) (C). While after 4 h of incubation, the expression of iNOS, IL-1β and TNF-α mRNAs was analyzed in microglia by RT-PCR (D).
As shown earlier in several studies (7,8), these MBP-primed Th1 cells induced the production of NO (Fig. 1B) and proinflammatory cytokines (IL-1β and TNF-α) (Fig. 1C) in mouse primary microglia via cell-to-cell contact. Although there was also very little or no induction of NO, IL-1β and TNF-α production when MBP-primed Th1 cells were added to microglia at a ratio of 0.1:1, marked induction of these proinflammatory molecules was observed at the ratio of 0.2:1 of T cell:microglia (Fig. 1B & 1C). The induction of proinflammatory molecule production increased slightly further at higher ratios of T cell:microglia (Fig. 1B & 1C). However, normal T cells (isolated from normal mice) were unable to induce the production of NO, IL-1β and TNF-α in primary microglia (data not shown). Interestingly, after gem treatment, gem-treated MBP-primed Th2 cells did not induce the production of NO, IL-1β and TNF-α in microglia (Fig. 1B & 1C). Similarly, semi-quantitative RT-PCR analysis also showed that MBP-primed Th1 but not Th2 cells induced the expression of iNOS, IL-1β and TNF-α mRNAs in microglia (Fig. 1D). These results suggest that Th1 to Th2 switching inhibits the ability of MBP-primed T cells to induce contact-mediated expression of proinflammatory molecules in mouse primary microglia.
Both MBP-primed Th1 and Th2 cells produced BDNF and NT-3
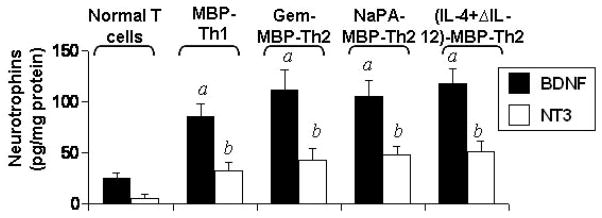
It has been shown that copaxone-1 (Cop-1)-specific Th1 and Th2 cells release BDNF (18–20). Furthermore, Th1 and Th2 cell lines specific for myelin antigens also produce increased amount of BDNF after antigen stimulation (21,22). Therefore, we examined if MBP-primed Th1 and Th2 cells also secreted neurotrophins. As observed in figure 2, MBP-primed Th1 cells, gem-treated MBP-primed Th2 cells, NaPA-treated MBP-primed Th2 cells, and (IL-4+anti-IL-12)-treated MBP-primed Th2 cells produced BDNF and NT-3.
Fig. 2. MBP-primed Th1 and Th2 cells produce BDNF and NT-3.
Normal T cells, MBP-primed Th1 cells, gem-treated MBP-primed Th2 cells, NaPA-treated MBP-primed T cells, and (IL-4+anti-IL-12 antibody)-treated MBP-primed Th2 cells were incubated in RPMI 1640 for 24 h followed by analysis of supernatants for BDNF and NT-3. Data are mean ± S.D. of three different experiments. ap < 0.001 vs BDNF of normal T cells; bp < 0.001 vs NT-3 of normal T cells.
MBP-primed Th2 but not Th1 cells induced the production of BDNF and NT-3 in mouse primary microglia and astroglia by cell-to-cell contact
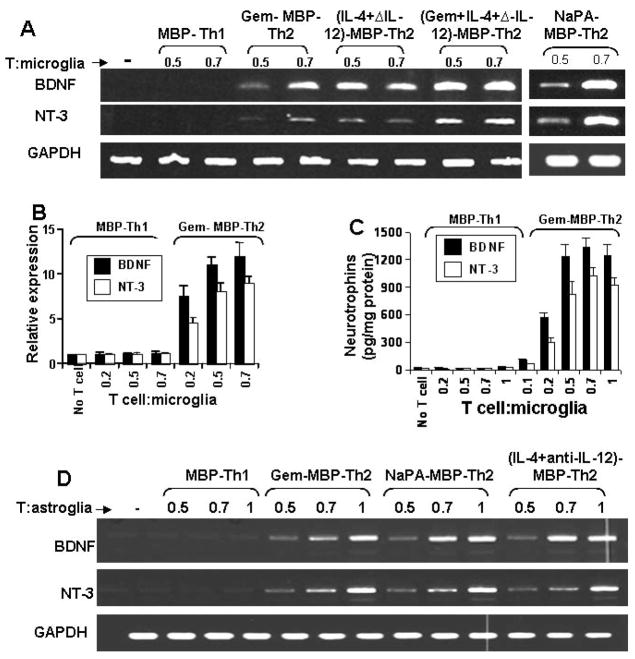
Next we investigated if these MBP-primed Th1 and Th2 cells were capable of inducing the expression of neurotrophic factors in microglia and astroglia. Normal T cells, MBP-primed Th1 cells, gem-treated MBP-primed Th2 cells, (IL-4+anti-IL-12)-treated MBP-primed Th2 cells, (gem+IL-4+anti-IL-12)-treated MBP-primed Th2 cells, and NaPA-treated MBP-primed Th2 cells were washed and added to mouse primary microglia in direct contact. After 1 h of contact, culture dishes were shaken and washed thrice to remove MBP-primed T cells. Normal T cells (isolated from normal mice) did not induce the expression of BDNF and NT-3 in microglia at various ratios of T cell:microglia (data not shown). Although MBP-primed Th1 cells produced BDNF and NT-3 (Fig. 2), these cells were unable to induce the expression of BDNF and NT-3 in microglia after 1 h of contact (Fig. 3A). However, under similar condition, gem-treated MBP-primed Th2 cells markedly induced the expression of BDNF and NT-3 in primary microglia (Fig. 3A). Similarly (IL-4+anti-IL-12)-treated MBP-primed Th2 cells, (gem+IL-4+anti-IL-12)-treated MBP-primed Th2 cells, and NaPA-treated MBP-primed Th2 cells also induced the expression of BDNF and NT-3 in microglia (Fig. 3A). Real-time PCR data also support that gem-treated MBP-primed Th2 cells but not MBP-primed Th1 cells induced the expression of BDNF and NT-3 in microglia at different ratios of T cell:microglia (Fig. 3B).
Fig. 3. MBP-primed Th2 but not Th1 cells induce the expression of BDNF and NT-3 in mouse primary microglia and astroglia.
Primary microglia received different concentrations of MBP-primed Th1, gem-treated MBP-primed Th2, NaPA-treated MBP-primed Th2, (IL-4+anti-IL-12)-treated MBP-primed Th2, and (gem+IL-4+anti-IL-12)-treated MBP-primed Th2 cells in direct contact under serum-free condition. After 1 h of contact, culture dishes were shaken and washed thrice with HBSS to remove T cells followed by incubation of adherent microglia in serum-free media. After 4 h of incubation, the expression of BDNF and NT-3 mRNAs were analyzed in microglia by RT-PCR (A) and real-time PCR (B). While after 23 h of incubation, supernatants were used to assay BDNF and NT-3 by ELISA (C). Primary astroglia were stimulated with different concentrations of Th1 and Th2 cells as described above. After 4 h of incubation, the expression of BDNF and NT-3 mRNAs were analyzed in astroglia by RT-PCR (D). Results represent three independent experiments.
To understand the protein level of these neurotrophins, we performed ELISA. It is apparent from figure 3C that these gem-treated MBP-primed Th2 cells were poor inducers of neurotrophin production at 0.1:1 of T cell:microglia. But marked induction of BDNF and NT-3 production was observed at the ratio of 0.2:1 of T cell:microglia (Fig. 3C). The induction of microglial neurotrophin production increased further at higher ratios, such as at 0.5:1 or 0.7:1 of T cell:microglia (Fig. 3C). The time-dependent experiment using gem-treated MBP-primed Th2 cells in the ratio of 0.5:1 of T cell:microglia showed that the microglial induction of BDNF and NT-3 production peaked at 24 h of incubation (data not shown). Similarly, gem-treated MBP-primed Th2 cells, NaPA-treated MBP-primed Th2 cells and (IL-4+anti-IL-12)-treated MBP-primed Th2 cells but not MBP-primed Th1 cells also induced the expression of BDNF and NT-3 in mouse primary astroglia (Fig. 3D). Because all different populations of Th2 cells behave similarly with respect to neurotrophin production in glia, we used gem-treated MBP-primed Th2 cells for further studies.
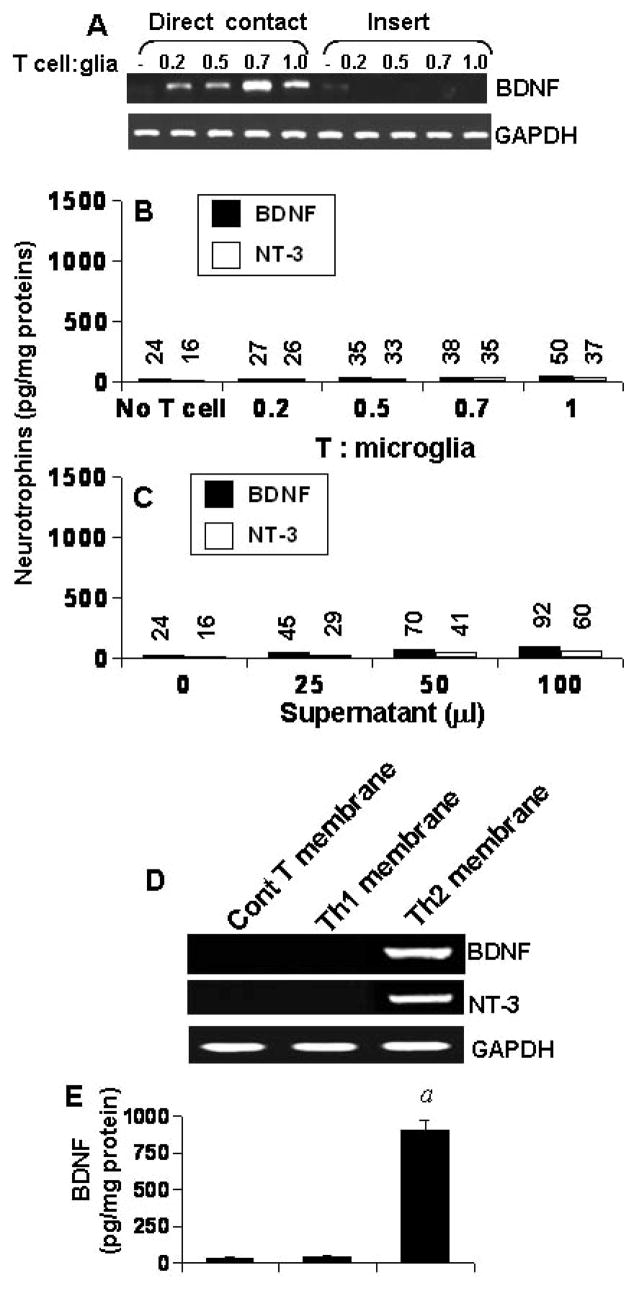
Next we examined if the contact between Th2 cells and glial cells or the soluble factors produced from these T cells is necessary for the induction of BDNF and NT-3 production. First, these T cells were placed in a culture insert, where they were in close proximity to, but not contacting microglia. In contrast to marked induction of BDNF and NT-3 production (Fig. 3C) and mRNA expression (Fig. 3A & 3B) by Th2 cell:microglia contact, very little neurotrophin production (Fig. 4B) and mRNA expression (Fig. 4A) was observed when Th2 cells were placed within culture inserts. Second, different amount of the conditioned supernatant of Th2 cells were added to primary microglia. Fifty microliter of supernatant was equivalent to T cells sufficient for the ratio of 0.5:1 of T cell:microglia. The induction of both BDNF and NT-3 production by 50 μl of that supernatant (Fig. 4C) was very low (< 6%) as compared to that by 0.5:1 of Th2 cell:microglia (Fig. 3C). Higher volumes of supernatants of Th2 cells also did not induce higher amount of BDNF and NT-3 in microglia (Fig. 4C). To further prove that it is a contact-mediated effect, we isolated plasma membranes of Th1 and Th2 cells and added to microglia. Plasma membranes of Th2 cells but not Th1 cells induced the expression of BDNF and NT-3 mRNA (Fig. 4D) and protein (Fig. 4E) in mouse primary microglia. Taken together, although both MBP-primed Th1 and Th2 cells produced BDNF and NT-3 (Fig. 2), only Th2 but not Th1 cells were able to induce contact-mediated expression of neurotrophins in glial cells.
Fig. 4. MBP-primed Th2 cells induce the expression of BDNF and NT-3 in mouse primary microglia via cell-to-cell contact.
Microglia received different concentrations of Th2 cells either in direct contact or within insert. After 5 h of incubation, the mRNA expression of BDNF was analyzed in microglia by RT-PCR (A). After 24 h, supernatants were used to assay BDNF and NT-3 (B). Panel B is relative to the experimental condition of figure 3C and therefore, the same graphical scale is used for direct comparison between two figures. Microglia received different concentrations of conditioned supernatant of Th2 cells. After 24 h, microglia-conditioned supernatants were used to assay BDNF and NT-3 (C). Data are mean of two separate experiments. Microglia were stimulated by plasma membranes (equivalent to 0.5:1 of T cell:glia) of normal T cells, MBP-primed Th1 and MBP-primed Th2 cells separately. After 5 h, microglial cells were analyzed for the expression of BDNF and NT-3 mRNAs by RT-PCR (D). After 24 h, supernatants were used to assay BDNF (E). Data are mean ± S.D. of three different experiments. ap < 0.001 vs BDNF by normal T cell membrane.
Identification of contact molecules on MBP-primed Th2 cells and glia responsible for glial expression of neurotrophins
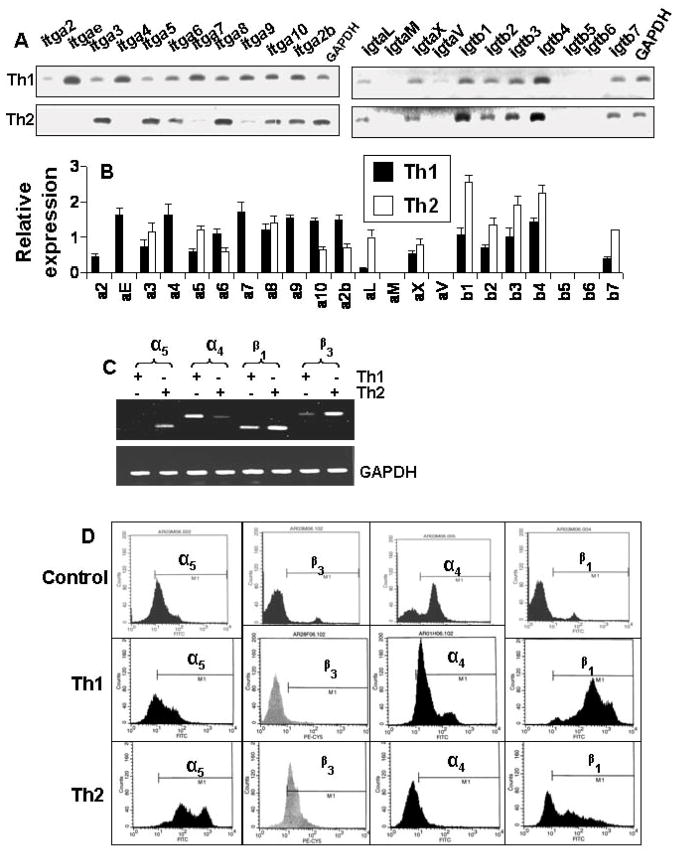
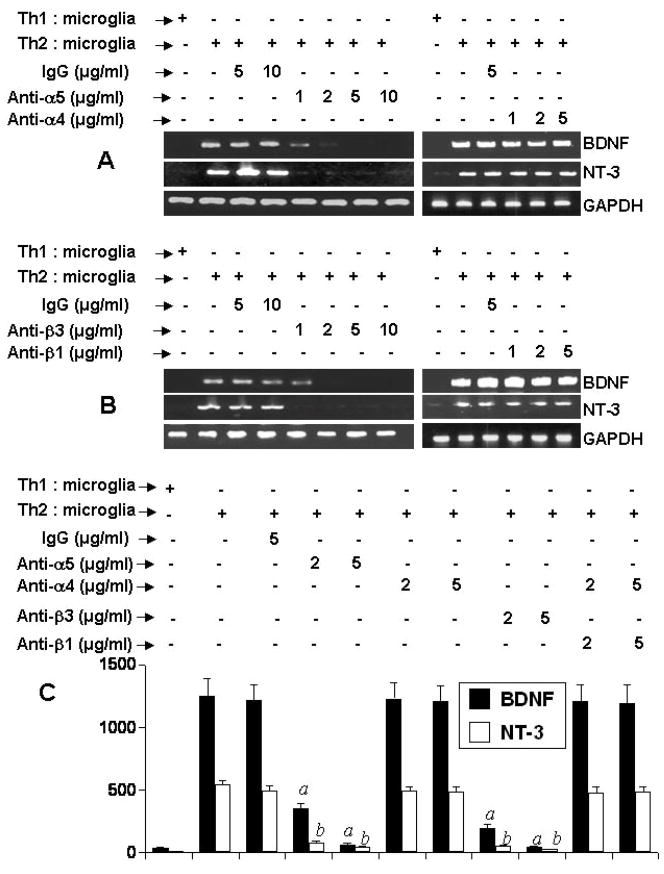
Integrins being present on cell surface are mainly involved in integrating cell-cell interaction. Earlier we have found that α4β1 integrin heterodimer on the surface of MBP-primed Th1 cells is involved in Th1 cell contact-induced expression of proinflammatory molecules in microglia (8,14). Therefore, we decided to investigate the role of integrins in neurotrophic activity of MBP-primed Th2 cells. At first, we performed a RT-PCR-based targeted gene array analysis (Superarray) to understand the status of various integrins in Th1 and Th2 cells. It is clearly evident from figure 5A and 5B that the expression of α3, α5, α8, β1, β2, and β4 in Th2 cells was higher than Th1 cells. On the other hand, the expression of α2, αe, α4, α7, α9, and αV was higher in Th1 cells than Th2 cells (Fig. 5A & 5B). We also verified the expression of few of these integrins (α4, α5, β1, and β3) by semi-quantitative RT-PCR and FACS analysis. As shown in figure 5C, the mRNA expression of α4 was higher in Th1 cells than Th2 cells. In contrast, similar to gene array results, the mRNA expression of α5, β3 and β1 was higher in Th2 cells than Th1 cells (Fig. 5C). FACS analysis data in figure 5D also shows that the surface expression of α5, β3 and β1 integrins was higher in Th2 cells than Th1 cells. On the other hand, the surface expression of α4 integrin was higher in Th1 cells than Th2 cells (Fig. 5D). Next we decided to identify integrins responsible for neurotrophic activity of Th2 cells. We used functional blocking antibodies to neutralize the function of different integrins. It is apparent from figure 6A that functional blocking antibodies against α5 but not α4 dose-dependently inhibited the ability of Th2 cells to induce contact-mediated expression of BDNF and NT-3 in mouse primary microglia. Similarly, functional blocking antibodies against β3 but not β1 dose-dependently inhibited the ability of Th2 cells to induce contact-mediated microglial expression of BDNF and NT-3 (Fig. 6B). On the other hand, control IgG did not block the ability of Th2 cells to induce microglial expression of BDNF (Fig. 6A & 6B). ELISA results in figure 6C also show that functional blocking antibodies against α5 and β3 but not α4 and β1 abrogated the ability of Th2 cells to induce contact-mediated production of BDNF and NT-3 in microglia. Similarly functional blocking antibodies against α5 and β3 also suppressed the ability of Th2 cells to induce contact-mediated expression of BDNF in mouse primary astroglia (Supplementary Fig. 1A & 1B). Taken together, these results suggest that α5 and β3 integrins but not α4 and β1 integrins are involved for Th2 cell contact-mediated expression of neurotrophins in microglia and astroglia.
Fig. 5. Expression of different integrins in MBP-primed Th1 and Th2 cells.
(A) Th1 and Th2 cells were analyzed for the expression of different integrins by targeted gene array analysis (SuperArray). (B) The relative expression of different cytokines (cytokines/GAPDH) was measured after scanning the bands with a Fluor Chem 8800 Imaging System (Alpha Innotech Corporation). Data are expressed as the mean ± S.D. of three different experiments. (C) The mRNA expression of α5, α4, β1, and β3 in Th1 and Th2 cells was verified by semi-quantitative RT-PCR. (D) Surface expression of α5, α4, β1, and β3 in Th1 and Th2 cells was examined by FACS. Results represent three independent experiments.
Fig. 6. Effect of neutralizing antibodies against α4, α5, β1, and β3 integrins on MBP-primed Th2 cell-mediated expression of BDNF and NT-3 in mouse primary microglia.
Th2 cells were mixed with different concentrations of antibodies against either α5 or α4 (A) and either β3 or β1 (B) and rocked gently for 1 h at room temperature. Normal IgG was also added as controls. Cells were centrifuged, washed twice and added to mouse primary microglia at a ratio of 0.5:1 T cell:microglia. After 1 h of stimulation, T cells were removed followed by incubation of adherent microglia in serum-free media. After 5 h of incubation (total), the expression of BDNF and NT-3 was analyzed by RT-PCR. C) After 24 h of incubation (total), supernatants were used to assay BDNF and NT-3 by ELISA. Data are mean ± S.D. of three different experiments. ap < 0.001 vs BDNF-Th2 cells; bp < 0.001 vs NT3-Th2 cells.
There is a possibility that neutralizing antibodies against α5 and β3 integrins are affecting glia not Th2 cells in order to suppress Th2 cell-induced production of neurotrophins in glia. To exclude that possibility, primary microglia were treated with different concentrations of neutralizing antibodies against α5 and β3 integrins before the stimulation by MBP-primed Th2 cells. As evidenced by Supplementary Figure 2, pre-treatment of microglia with neutralizing antibodies against α5, α4, β3, and β1 integrins had no effect on MBP-primed Th2 cell contact-induced microglial production of BDNF and NT-3.
Because MBP-primed Th2 cells secreted some neurotrophins by themselves, we examined if α5 and β3 integrins are also involved in the production of neurotrophins by Th2 cells. In contrast to the inhibition of Th2 cell-mediated expression of neurotrophins in glial cells, functional blocking antibodies against α5 and β3 integrins had no inhibitory effect on the expression of BDNF mRNA in MBP-primed Th2 cells (Supplementary Fig. 3) suggesting that these integrins are not involved in the expression of BDNF in Th2 cells.
Identification of the receptor on microglia that is involved for MBP-primed Th2 cell-contact-mediated microglial expression of neurotrophins
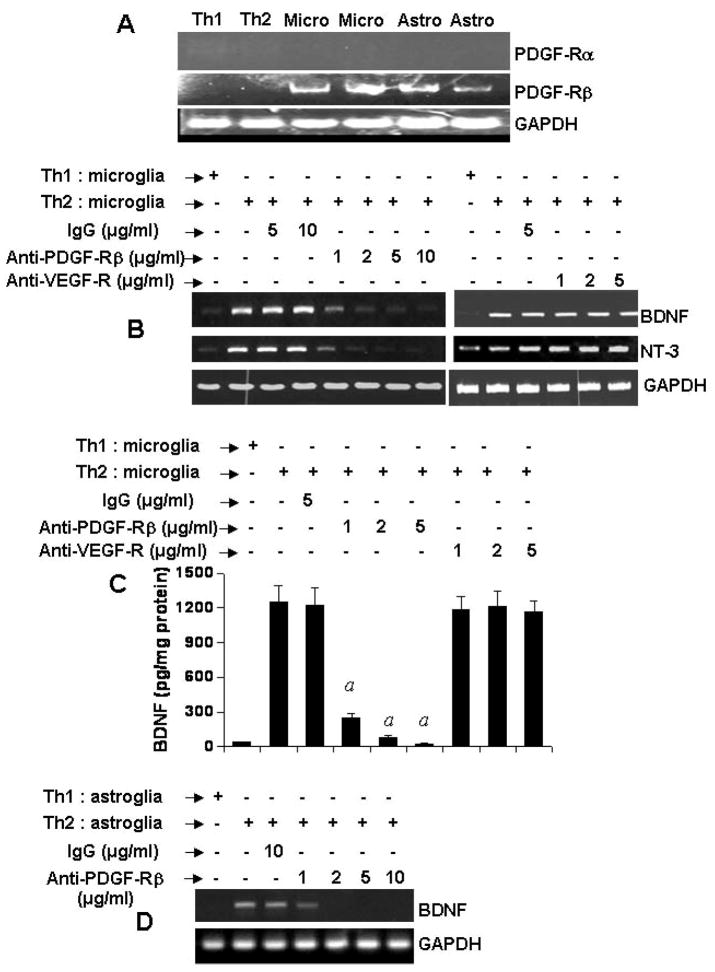
Earlier studies by Yong and colleagues (23) and Benveniste and colleagues (24) have delineated a role of vascular cell adhesion molecule 1 (VCAM-1) and intercellular adhesion molecule 1 (ICAM-1) in glial cell activation. However, neutralization of both VCAM-1 and ICAM-1 on microglia did not eliminate the contact activity of Th2 cells (data not shown). Then we focused on growth factor receptors. Both mouse primary microglia and astroglia but not MBP-primed Th1 and Th2 cells expressed platelet-derived growth factor receptor β (PDGF-Rβ) (Fig. 7A). However, as expected, we were unable to detect PDGF-Rα mRNA in either T cells (Th1 and Th2) or glial cells (microglia and astroglia) (Fig. 7A). We investigated if PDGF-Rβ was responsible for MBP-primed Th2 cell contact-mediated expression of neurotrophins in glial cells. Interestingly, pretreatment of mouse primary microglia with different concentrations of functional blocking antibodies against PDGF-Rβ but not vascular endothelial growth factor receptor (VEGF-R) inhibited Th2 cell-mediated expression of BDNF and NT-3 mRNAs in microglia (Fig. 7B). ELISA results in figure 7C show that blocking of PDGF-Rβ but not VEGF-R on microglia suppressed Th2 cell-mediated microglial production of BDNF. Similarly, neutralization of PDGF-Rβ but not VEGF-R on mouse primary astroglia also abrogated Th2 cell-mediated astroglial expression of BDNF mRNA (Fig. 7D). On the other hand, control IgG did not block the ability of Th2 cells to induce either microglial or astroglial expression of BDNF (Fig. 7). These results suggest that PDGF-Rβ but not VEGF-R is involved in Th2 cell contact-induced glial expression of neurotrophins.
Fig. 7. Effect of neutralizing antibodies against PDGF-Rβ and VEGF-R on MBP-primed Th2 cell-mediated expression of BDNF and NT-3 in mouse primary microglia and astroglia.
A) T cells (MBP-primed Th1 and Th2) and primary glial cells (microglia and astroglia) were analyzed for PDGF-Rα and PDGF-Rβ mRNAs by semi-quantitative RT-PCR. Microglia were incubated with different concentrations of neutralizing antibodies against either PDGF-Rβ or VEGF-R. Normal IgG was also included as controls. Excess antibodies were removed after 1 h of incubation followed by the stimulation of microglia by Th2 cells at a ratio of 0.5:1 T cell:microglia. After 1 h of stimulation, T cells were removed followed by incubation of adherent microglia in serum-free media. After 5 h of incubation (total), the expression of BDNF and NT-3 was analyzed by RT-PCR (B). After 24 h of incubation (total), supernatants were used to assay BDNF by ELISA (C). Data are mean ± S.D. of three different experiments. ap < 0.001 vs Th2 cells. (D) In another set of experiments, astroglia were incubated with different concentrations of antibodies against PDGF-Rβ. After 1 h of incubation, excess antibodies were removed followed by the stimulation of astroglia by Th2 cells as described above. After 5 h of incubation (total), the expression of BDNF was analyzed in astroglia by RT-PCR. Results represent three independent experiments.
Role of CREB in MBP-primed Th2 cell-induced glial expression of BDNF and NT-3
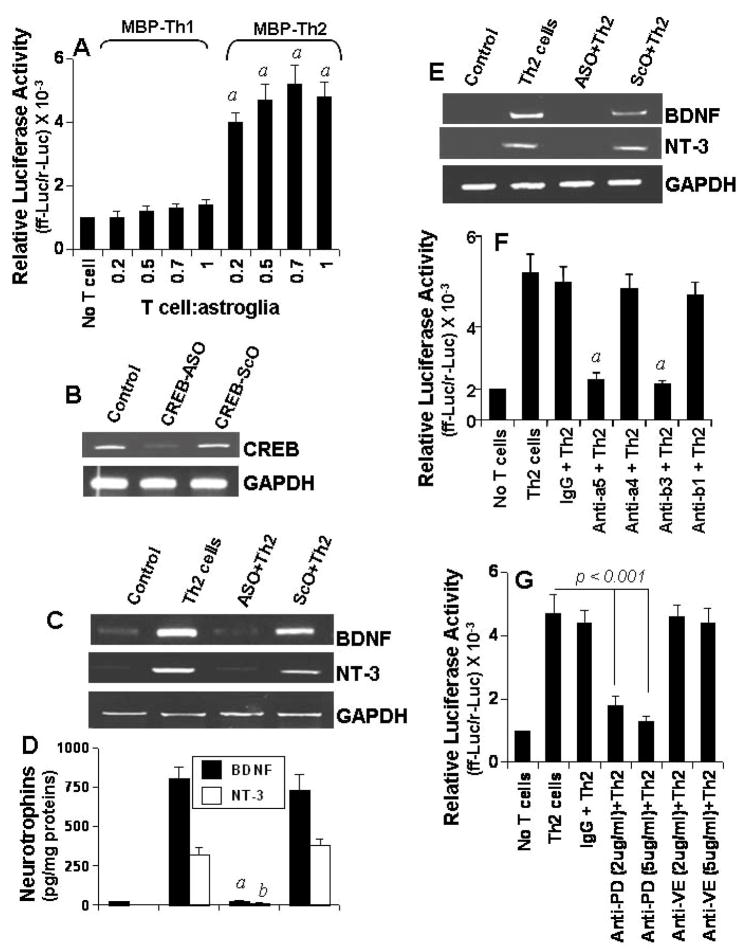
Next we investigated mechanisms by which MBP-primed Th2 cell contact induced the expression of BDNF and NT-3 in glial cells. Because the transcription factor CREB plays an important role in the expression of neurotrophins (25,26), we investigated if Th2 cells induced the activation of CREB in glia by cell-to-cell contact. The activation of CREB was monitored by the expression of luciferase from a CREB-dependent reporter construct, pCRE-Luc (Stratagene). Because the experiment required transfection and primary microglia are difficult cells to be transfected, we used primary astroglia. Interestingly Th2 cells but not Th1 cells markedly induced the activation of CREB in mouse primary astroglia (Fig. 8A). Although Th2 cells did not induce the activation of CREB in astroglia when added at a ratio of 0.1:1, the activation of CREB started at the ratio of 0.2:1 of T cell:glia, peaked at the ratio of 0.5:1 or higher ratios of T cell:glia (Fig. 8A). These results suggest that MBP-primed Th2 cells but not Th1 cells are capable of inducing the activation of CREB in glial cells by cell-to-cell contact.
Fig. 8. Role of CREB in MBP-primed Th2 cell contact-mediated glial expression of BDNF.
A) Mouse primary astrocytes were cotransfected with pCRE-Luc and pRL-TK. After 24 h of transfection, cells were stimulated with Th1 and Th2 cells. After 1 h, T cells were removed and adherent astrocytes received serum-free media. After 5 h, firefly and Renilla luciferase activities were assayed. Data are mean ± S.D. of three different experiments. ap < 0.001 vs control (no T cells). B) Primary microglia were incubated with 1 μM antisense (ASO) and scrambled (ScO) oligonucleotides against CREB. After 42 h of incubation, the expression of CREB mRNA was examined by RT-PCR. C) Microglia preincubated with 1 μM ASO or ScO against CREB for 36 h were stimulated with Th2 cells as described above. After 5 h, microglia were analyzed for BDNF and NT-3 mRNAs by RT-PCR. D) After 24 h, concentrations of BDNF and NT-3 were analyzed in supernatants by ELISA. ap < 0.001 vs BDNF-Th2 cells; bp < 0.001 vs NT3-Th2 cells. E) Mouse primary astroglia preincubated with 1 μM ASO or ScO against CREB for 36 h were stimulated with Th2 cells followed by analysis of BDNF and NT-3 mRNAs by RT-PCR. F) Th2 cells were treated with 5 μg/ml of control IgG or antibodies against α5, α4, β3, or β1 as described above followed by addition of these Th2 cells to mouse primary astrocytes (0.5:1 of T cell:glia) that were transfected with pCRE-Luc and pRL-TK. ap < 0.001 vs Th2 cells. (G) Primary astrocytes were transfected with pCRE-Luc and pRL-TK. After 24 h of transfection, astrocytes were incubated with control IgG or different concentrations of antibodies against either PDGF-Rβ (PD) or VEGF-R (VE) for 1 h followed by stimulation with Th2 cells (0.5:1 of T cell:glia). After 5 h, firefly and Renilla luciferase activities were assayed in astroglia. Data are mean ± S.D. of three different experiments.
Next we examined the role of CREB in Th2 cell-induced glial expression of BDNF and NT-3. For the inhibition of CREB, we employed antisense oligonucleotides but not SiRNA or dominant-negative construct because of difficulties in transfecting primary microglia. As reported earlier (11), following antisense (ASO) and scrambled (ScO) oligonucleotides were used to block CREB in both microglia and astroglia. CREB ASO: 5′-GTC TGC TCC AGA TTC-3′; CREB ScO: 5′-GAT CCC GAT TCG TCT-3′. According to figure 8B, ASO but not ScO against CREB suppressed the expression of CREB mRNA in mouse primary microglia. Consistent to a role of CREB in the expression of neurotrophins, ASO but not ScO against CREB markedly inhibited Th2 cell-induced microglial expression of BDNF and NT-3 mRNA (Fig. 8C) and production of BDNF and NT-3 proteins (Fig. 8D). Similarly, CREB ASO but not ScO also knocked down Th2 cell-induced expression of BDNF and NT-3 mRNA in mouse primary astroglia (Fig. 8E). These studies suggest that Th2 cells induce the expression of BDNF and NT-3 in glia via contact-mediated activation of CREB.
Role of α5β3 integrin and PDGF-Rβ in MBP-primed T cell contact-induced activation of CREB in glial cells
Because α5β3 integrin and PDGF-Rβ are involved in Th2 cell contact-mediated expression of neurotrophins in glial cells, we decided to investigate whether α5β3 integrin and PDGF-Rβ are coupled to the induction of neurotrophins through the activation of CREB. As described above, functions of α5β3 integrin and PDGF-Rβ were inhibited by specific functional blocking antibodies. It is clearly evident from figure 8F, functional blocking antibodies against α5 and β3 markedly abolished the ability of Th2 cells to induce contact-mediated activation of CREB in mouse primary astroglia. On the other hand, control IgG and functional blocking antibodies against α4 and β1 had no effect on Th2 cell contact-mediated astroglial activation of CREB. Consistent to the involvement of glial PDGF-Rβ but not VEGF-R in the expression of neurotrophins (Fig. 7), neutralization of astroglial PDGF-Rβ but not VEGF-R also knocked down Th2 cell contact-induced activation of CREB in astroglia (Fig. 8G). Taken together, these studies suggest that Th2 cell contact induces the activation of CREB in glia via α5β3 integrin and PDGF-Rβ.
Do gem-treated MBP-primed Th2 cells enter into the brain and induce the expression of neurotrophins in vivo in the brain?
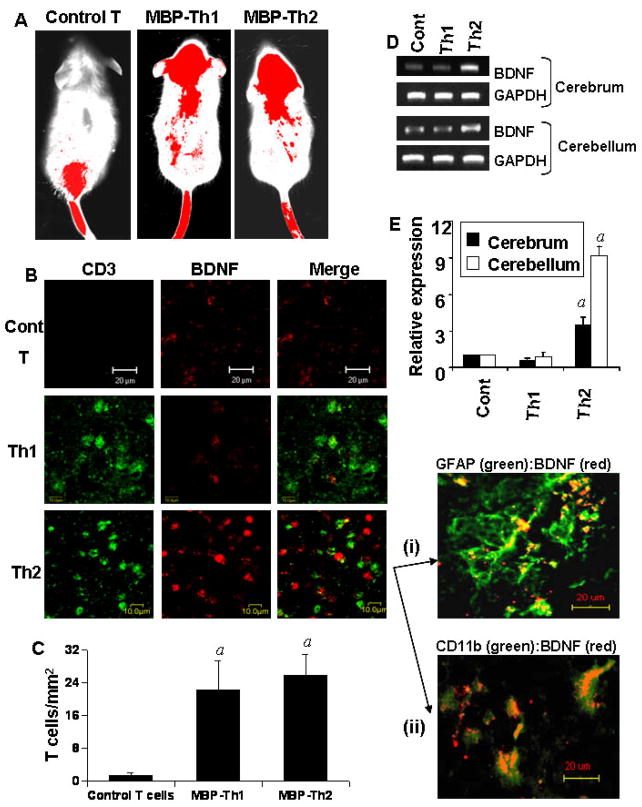
Next we examined if these MBP-primed Th2 cells were capable of entering into the CNS. Th1, Th2 and normal T cells were labeled with Alexa 680-SE NIR dye (Invitrogen) and transferred to SJL/J mice through tail vein injection. After 5 d of injection, mice were scanned by Odyssey (ODY-0854, Licor-Inc). As observed in figure 9A, labeled control T cells were mainly found in the lower part of the body. On the other hand, the presence of both MBP-primed Th1 and Th2 cells was traced over the brain and cervical spinal cord (Fig. 9A) suggesting that MBP-primed Th1 cells and gem-treated MBP-primed Th2 cells are probably capable of entering into the CNS. To further confirm this observation, cerebellar sections were immunostained with antibodies against CD3. We did not see CD3+ positive T cells in cerebellar sections of mice receiving normal T cells (Fig. 9B; upper panel). On the other hand, CD3+ T cells were present in cerebellar sections of mice receiving MBP-primed Th1 cells (Fig. 9B; middle panel) and gem-treated MBP-primed Th2 cells (Fig. 9B; lower panel). Quantitation of T cells in cerebellar sections shows that MBP-primed Th1 cells and MBP-primed Th2 cells were equally efficient in crossing the blood-brain barrier (Fig. 9C). On the other hand, normal T cells were unable to enter into the CNS (Fig. 9C). Next we investigated if these Th2 cells were capable of inducing BDNF in vivo in the brain. Immunofluorescence analysis showed that the expression of BDNF protein was much more in cerebellar sections of mice receiving MBP-primed Th2 cells than that of mice receiving either normal T cells or MBP-primed Th1 cells (Fig. 9B). Although CD3 did not directly co-localize with BDNF, CD3 positive T cells were found to be interacting with BDNF-expressing cells in brains of mice receiving Th2 cells (Fig. 9B). Furthermore, double-labeling experiments of cerebellar sections of mice receiving Th2 cells show that BDNF co-localized with GFAP-positive astrocytes (Fig. 9B-i) and CD11b-positive microglia (Fig. 9B-ii). By semi-quantitative RT-PCR analysis (Fig. 9D) and quantitative real-time PCR analysis (Fig. 9E), we also observed that Th2 cells but not Th1 cells induced the expression of BDNF in vivo in both cerebellum and cerebrum.
Fig. 9. MBP-primed Th2 cells but not Th1 cells induce the expression of BDNF in vivo in the brain of mice.
A) Control T cells, MBP-primed Th1 cells and gem-treated MBP-primed Th2 cells were labeled with Alexa 680-SE and labeled T cells (107 cells/mouse) were transferred to female SJL/J mice via tail-vein. After 5 d of injection, the movement of T cells was detected by scanning mice in Odyssey infra-red scanner. B) Female SJL/J mice received unlabeled control T cells, MBP-primed Th1 cells and MBP-primed Th2 cells via tail-vein injection. After 5 d of injection, cerebellar sections were double-labeled with antibodies against CD3 and BDNF. Cerebellar sections of mice receiving Th2 cells were also double-labeled with GFAP:BDNF (i) and CD11b:BDNF (ii). C) CD3 positive cells were counted in four cerebellar sections (two images per slide) of each of four mice using in an Olympus IX81 fluorescence microscope using the MicroSuite™ imaging software. ap < 0.001 vs control T cells. Total RNA isolated from cerebellum and cerebrum were analyzed by RT-PCR (D) and quantitative real-time PCR (E) for BDNF. Data are mean ± S.D. of three different experiments. ap < 0.001 vs control.
DISCUSSION
Activation of glial cells (microglia and astroglia) has been implicated in the pathogenesis of a variety of neurodegenerative diseases, including Alzheimer’s disease (AD), Parkinson’s disease (PD), stroke, Creutzfeld-Jacob disease, HIV-dementia, and multiple sclerosis (MS) (27). Upon activation, glial cells produce and secrete potentially neurotoxic pro-inflammatory molecules including IL-1β, IL-1α, TNF-α, IL-6, and NO that play an important role in the pathogenesis of neurodegenerative and neuroinflammatory disorders (27–30). Although activated glia produce different neurotoxic molecules, these activated glia could be redirected to produce neuroprotective factors as well. This is particularly important under pathophysiological conditions when neurons do not produce neurotrophins. However, mechanisms to boost the production of neurotrophins from glial cells are still elusive. Recently we have shown that MBP-primed Th1 cells induce different proinflammatory molecules (IL-1β, IL-1α, TNF-α, IL-6, and NO) in microglia through cell-to-cell contact (7,8,14). Studies described in this manuscript demonstrate that after Th2 switching, MBP-primed Th2 cells induce the expression of neurotrophins in glial cells via cell-to-cell contact. Our conclusion is based on the following observations. First, MBP-primed Th2 cells but not Th1 cells induced the production of BDNF and NT-3 in mouse primary microglia and astroglia. This effect was dose-dependent and it peaked at 0.7:1 or 0.5:1 of T cell:glia. Second, the placement of Th2 cells in a culture insert, where they were in close proximity to, but not contacting microglia, was unable to induce the production of neurotrophins in glial cells. Third, soluble factors of Th2 cells equivalent to T cells of 0.5:1 or 0.7:1 of T cell:glia were very poor inducers of neurotrophins. Fourth, plasma membranes of MBP-primed Th2 cells but not Th1 cells alone induced the expression of neurotrophins in glial cells.
Autoreactive T cells are a component of the normal immune system. It has been shown that T cells themselves are capable of producing neurotrophins (18,19). Copaxone (Cop-1) is a FDA-approved drug for MS that is given daily to MS patients by subcutaneous injection (19). Immunization with Cop-1 induces a T cells response partially cross-reactive with MBP; however, it does not lead to an autoimmune disease (19). It has been demonstrated that Cop-1-specific Th1 and Th2 cells produce BDNF (20–22). According to Kerschensteiner et al (21), both Th1 and Th2 CD4+ T cell lines specific for myelin autoantigens produce BDNF. We have also found that MBP-primed Th1 and Th2 cells produce BDNF (Fig. 2). These may raise question whether the release of BDNF and NT-3 by glial cells in response to Th2 cell stimulation is indeed attributed to glial cells.
Although both MBP-primed Th1 and Th2 cells themselves produced BDNF and NT-3 (Fig. 2), as evident from our trans-well and plasma membrane experiments, only Th2 but not Th1 cells induced the expression of BDNF and NT-3 in glial cells by cell-to-cell contact. Furthermore, we have observed that the expression of α5 and β3 integrins is higher in Th2 cells than Th1 cells and that neutralization of α5 and β3 integrins on Th2 cell surface abrogated Th2 cell contact-mediated expression of neurotrophins in glial cells. Earlier, we have demonstrated that MBP-primed Th1 cells induce the production of proinflammatory molecules (iNOS, IL-1β, TNF-α, and IL-6) from glial cells via α4β1 (VLA4)-contact-mediated glial activation of C/EBPβ (8,14). However, neutralization of α4 and β1 integrins on Th2 cells had no effect on Th2 cell contact-mediated expression of neurotrophins in glial cells suggesting the specificity of the effect. Although neutralization of α5 and β3 integrins knocked down Th2 cell-induced expression of BDNF in glial cells, functional blocking of these two integrins did not inhibit the expression of BDNF in MBP-primed Th2 cells suggesting that Th2 cells do not involve α5 and β3 integrins for the expression of its own BDNF and that α5 and b3 integrins are involved only when Th2 cells are inducing the expression of BDNF in glial cells by cell-to-cell contact. Moreover, Th2 cells were unable to induce neurotrophins in glial cells in which the function of cell surface PDGF-Rβ but not VEGF-R was blocked. These results clearly establish that the expression of neurotrophins in glial cells in response to Th2 cell stimulation is a contact-driven phenomenon. This is the first demonstration that α5β3 integrin and growth factor receptor PDGF-Rβ play important roles in the synthesis of neurotrophins in glial cells in response to T cell contact.
Although signaling mechanisms leading to the expression of neurotrophins are poorly understood, several studies have revealed an important role of cAMP response element (CRE) binding protein (CREB) in the expression of neurotrophins (25,26). Therefore, we were prompted to investigate if CREB was playing a role in T cell contact-mediated expression of neurotrophins in glial cells. Interestingly, only MBP-primed Th2 cells but not Th1 cells induced the activation of CREB in glia by cell-to-cell contact. Similarly Th2 cells but not Th1 cells also induced the expression of CREB-dependent neurotrophins in vivo in the brain. Furthermore, Th2 cells were unable to induce the expression of neurotrophins in astroglia and microglia in which CREB was knocked down by antisense oligonucleotides. Consistent to the involvement of α5β3 of T cells in contact-mediated glial expression of neurotrophins, neutralization of α5 and β3 but not α4 and β1 on Th2 cells abrogated the ability of these cells to induce contact-mediated activation of CREB in glial cells. Functional blocking of PDGF-Rβ but not VEGF-R on glial cells also suppressed Th2 cell-induced activation of CREB in glial cells. Taken together, these results suggest that Th2 cells induce the expression of neurotrophins in glial cells due to their ability to induce glial activation of CREB and that the activation of CREB is mediated via possible contact between α5β3 integrin of Th2 cells and PDGF-Rβ of glial cells.
Neurotrophic factors derived from microglia and astroglia may support functioning and viability of sick neurons, neuronal stem cells and myelin producing oligodendrocytes in neuroinflammatory and neurodegenerative CNS. Therefore, understanding the mechanism by which activated glial cells could be redirected to produce neurotrophic factors within the diseased CNS may directly impact upon the treatment of patients with neurodegenerative and neuroinflammatory disorders. Here we demonstrate that MBP-primed Th2 cells induce the activation of CREB and the expression of neurotrophic molecules (BDNF and NT-3) in glial cells via cell-to-cell contact involving α5β3 and PDGF-Rβ. Furthermore, these ex vivo-modified T cells infiltrate into the CNS and induce the expression of neurotrophins in vivo in the brain. Therefore, sending ex vivo-modified autologous Th2 cells into the CNS of patients with various neurological diseases would be an important strategy to redirect the diseased CNS towards the normal one by enhancing the expression of CREB and neurotrophins.
Supplementary Material
Acknowledgments
This study was supported by grants from National Multiple Sclerosis Society (RG3422A1/1), National Institutes of Health (NS39940 and NS48923) and Michael J. Fox Foundation for Parkinson’s Research.
References
- 1.Casaccia-Bonnefil P, Gu C, Chao MV. Adv Exp Med Biol. 1999;468:275–282. doi: 10.1007/978-1-4615-4685-6_22. [DOI] [PubMed] [Google Scholar]
- 2.Althaus HH. Prog Brain Res. 2004;146:415–432. doi: 10.1016/S0079-6123(03)46026-3. [DOI] [PubMed] [Google Scholar]
- 3.Spina MB, Squinto SP, Miller J, Lindsay RM, Hyman C. J Neurochem. 1992;59:99–106. doi: 10.1111/j.1471-4159.1992.tb08880.x. [DOI] [PubMed] [Google Scholar]
- 4.Date I, Yoshimoto Y, Imaoka T, Miyoshi Y, Gohda Y, Furuta T, Asari S, Ohmoto T. Brain Res. 1993;621:150–154. doi: 10.1016/0006-8993(93)90312-b. [DOI] [PubMed] [Google Scholar]
- 5.Flanders KC, Ren RF, Lippa CF. Prog Neurobiol. 1998;54:71–85. doi: 10.1016/s0301-0082(97)00066-x. [DOI] [PubMed] [Google Scholar]
- 6.Kordower JH, Palfi S, Chen EY, Ma SY, Sendera T, Cochran EJ, Cochran EJ, Mufson EJ, Penn R, Goetz CG, Comella CD. Ann Neurol. 1999;46:419–424. doi: 10.1002/1531-8249(199909)46:3<419::aid-ana21>3.0.co;2-q. [DOI] [PubMed] [Google Scholar]
- 7.Dasgupta S, Jana M, Liu X, Pahan K. J Biol Chem. 2002;277:39327–39333. doi: 10.1074/jbc.M111841200. [DOI] [PMC free article] [PubMed] [Google Scholar]
- 8.Dasgupta S, Jana M, Liu X, Pahan K. J Biol Chem. 2003;278:22424–22431. doi: 10.1074/jbc.M301789200. [DOI] [PMC free article] [PubMed] [Google Scholar]
- 9.Saha RN, Pahan K. J Neuroimmune Pharmacol. 2006;1:212–222. doi: 10.1007/s11481-006-9020-8. [DOI] [PMC free article] [PubMed] [Google Scholar]
- 10.Giulian D, Baker TJ. J Neurosci. 1986;6:2163–2178. doi: 10.1523/JNEUROSCI.06-08-02163.1986. [DOI] [PMC free article] [PubMed] [Google Scholar]
- 11.Roy A, Fung YK, Liu X, Pahan K. J Biol Chem. 2006;281:14971–14980. doi: 10.1074/jbc.M600236200. [DOI] [PMC free article] [PubMed] [Google Scholar]
- 12.Dasgupta S, Jana M, Liu X, Zhou Y, Banik NL, Pahan K. J Immunol. 2003;170:3874–3882. doi: 10.4049/jimmunol.170.7.3874. [DOI] [PubMed] [Google Scholar]
- 13.Dasgupta S, Jana M, Zhou Y, Fung YK, Ghosh S, Pahan K. J Immunol. 2004;173:1344–1354. doi: 10.4049/jimmunol.173.2.1344. [DOI] [PubMed] [Google Scholar]
- 14.Dasgupta S, Jana M, Liu X, Pahan K. J Biol Chem. 2005;280:32609–32617. doi: 10.1074/jbc.M500299200. [DOI] [PMC free article] [PubMed] [Google Scholar]
- 15.Jana M, Pahan K. Free Rad Biol Med. 2005;39:823–831. doi: 10.1016/j.freeradbiomed.2005.05.014. [DOI] [PMC free article] [PubMed] [Google Scholar]
- 16.Jana M, Liu X, Koka S, Ghosh S, Petro TM, Pahan K. J Biol Chem. 2001;276:44527–44533. doi: 10.1074/jbc.M106771200. [DOI] [PMC free article] [PubMed] [Google Scholar]
- 17.Lovett-Racke AE, Hussain RZ, Northrop S, Choy J, Rocchini A, Matthes L, Chavis JA, Diab A, Drew PD, Racke MK. J Immunol. 2004;172:5790–5798. doi: 10.4049/jimmunol.172.9.5790. [DOI] [PubMed] [Google Scholar]
- 18.Aharoni R, Kayhan B, Eilam R, Sela M, Arnon R. Proc Natl Acad Sci USA. 2003;100:14157–14162. doi: 10.1073/pnas.2336171100. [DOI] [PMC free article] [PubMed] [Google Scholar]
- 19.Wolinsky JS. Adv Neurol. 2006;98:273–292. [PubMed] [Google Scholar]
- 20.Ziemssen T, Kumpfel T, Klinkert WE, Neuhaus O, Hohlfeld R. Brain. 2002;125:2381–2391. doi: 10.1093/brain/awf252. [DOI] [PubMed] [Google Scholar]
- 21.Kerschensteiner M, Gallmeier E, Behrens L, Leal VV, Misgeld T, Klinkert WE, Kolbeck R, Hoppe E, Oropeza-Wekerle RL, Bartke I, Stadelmann C, Lassmann H, Wekerle H, Hohlfeld R. J Exp Med. 1999;189:865–870. doi: 10.1084/jem.189.5.865. [DOI] [PMC free article] [PubMed] [Google Scholar]
- 22.Hohlfeld R, Kerschensteiner M, Stadelmann C, Lassmann H, Wekerle H. J Neuroimmunol. 2000;107:161–166. doi: 10.1016/s0165-5728(00)00233-2. [DOI] [PubMed] [Google Scholar]
- 23.Chabot S, Williams G, Yong VW. J Clin Invest. 1997;100:604–612. doi: 10.1172/JCI119571. [DOI] [PMC free article] [PubMed] [Google Scholar]
- 24.Lee SJ, Drabik K, Van Wagoner NJ, Lee S, Choi C, Dong Y, Benveniste EN. J Immunol. 2000;165:4658–4666. doi: 10.4049/jimmunol.165.8.4658. [DOI] [PubMed] [Google Scholar]
- 25.Mellstrom B, Torres B, Link WA, Naranjo JR. Crit Rev Neurobiol. 2004;16:43–49. doi: 10.1615/critrevneurobiol.v16.i12.40. [DOI] [PubMed] [Google Scholar]
- 26.Tardito D, Perez J, Tiraboschi E, Musazzi L, Racagni G, Popoli M. Pharmacol Rev. 2006;58:115–134. doi: 10.1124/pr.58.1.7. [DOI] [PubMed] [Google Scholar]
- 27.Gonzalez-Scarano F, Baltuch G. Annu Rev Neurosci. 1999;22:219–240. doi: 10.1146/annurev.neuro.22.1.219. [DOI] [PubMed] [Google Scholar]
- 28.Maimone D, Gregory S, Arnason BG, Reder AT. J Neuroimmunol. 1991;32:67–74. doi: 10.1016/0165-5728(91)90073-g. [DOI] [PubMed] [Google Scholar]
- 29.Ruddle NH, Bergman CM, McGrath KM, Lingenheld EG, Grunnet ML, Padula SJ, Clark RB. J Exp Med. 1990;172:1193–1200. doi: 10.1084/jem.172.4.1193. [DOI] [PMC free article] [PubMed] [Google Scholar]
- 30.Samoilova EB, Horton JL, Hilliard B, Liu TS, Chen Y. J Immunol. 1998;161:6480–6486. [PubMed] [Google Scholar]
Associated Data
This section collects any data citations, data availability statements, or supplementary materials included in this article.


