Abstract
Nonlinear microscopies including multiphoton excitation fluorescence microscopy and multiple-harmonic generation microscopy have recently gained popularity for cellular and tissue imaging. The optimization of these imaging methods for minimally invasive use will require optical fibers to conduct light into tight space where free space delivery is difficult. The delivery of high peak power laser pulses with optical fibers is limited by dispersion resulting from nonlinear refractive index responses. In this paper, we characterize a variety of commonly used optical fibers in terms of how they affect pulse profile and imaging performance of nonlinear microscopy; the following parameters are quantified: spectral bandwidth and temporal pulse width, two-photon excitation efficiency, and optical resolution. A theoretical explanation for the measured performance of these is also provided.
Keywords: Fiber Characterization, Pulse Compression, Photonic Crystal Fiber, Two-photon Microscopy, Optical Resolution
INTRODUCTION
Nonlinear microscopy provides intrinsic three-dimension (3D) resolution, allows deep imaging into tissues, achieves submicron optical resolution, and minimizes photodamage and photobleaching (Denk and others, 1990; So and others, 2000). The term nonlinear microscopy now encompasses a broad class of techniques such as multiphoton-excited fluorescence imaging, multiple-harmonic generation imaging, and coherent anti-Stokes Raman imaging (Evans and others, 2007; Flusberg and others, 2005; Yu and others, 2007). While nonlinear microscopy has found applications in many biological studies, many in-vivo applications will require adapting this technology into an endoscopic format that requires delivering femtosecond optical pulses through optical fibers. Traditional optical fibers conduct light, based on total internal reflection (TIR), but are limited by optical loss and dispersion. Minimizing impurities during the manufacturing process dramatically reduced optical loss. Dispersion management has focused on chromatic dispersion reduction to optimize long haul optical communication. However, the requirements for optical pulse delivery with fiber optics in nonlinear microscopy are quite different from those for optical communication. First, these two applications operate in different spectral windows. The optical window for nonlinear microscopy is determined by the absorption spectra of typical endogenous and exogenous fluorophores, the wavelength-dependent attenuation coefficients of tissues, and the operating wavelengths of available high-power pulsed lasers. The optical window for optical communication is mostly determined by identifying the spectral range where attenuation due to Rayleigh scattering and chromatic dispersion in fibers are minimized (Ghatak and Thyagarajan, 1998). Given the constraints in the optical window for nonlinear microscopy, chromatic dispersion often cannot be minimized and results in lower performance in fiber optic-based nonlinear microscopy. Far from the zero dispersion wavelength, the group velocity dispersion (GVD), which characterizes the wavelength dependence of the group velocity in a medium, becomes dominant. This effect becomes especially pronounced for femtosecond optical pulses, since a wide spectral bandwidth is needed to produce these ultrafast optical pulses (time-bandwidth limit). Linear prechirping (Fork and others, 1984; Treacy, 1968) is often needed to compensate for the GVD introduced by the fiber (Helmchen and others, 2002; Myaing and others, 2003). Second, nonlinear microscopy requires ultrafast optical pulses of substantially higher energy than those in telecommunication. As optical power through a fiber increases, nonlinear effects become more prominent. These nonlinear effects include self phase modulation (SPM) that enlarges spectral bandwidth, and broadens temporal pulse width (Agrawal, 2001). The optical pulse distortion which results from fiber delivery often cannot be fully compensated for these nonlinear effects by simple linear prechirping approach, and its pulse width often broadens with input power (Helmchen and others, 2002). Therefore, the effects on high power ultrafast optical pulse delivery require careful investigation for nonlinear microscopy applications.
Recently developed photonic crystal materials have been used in the manufacturing of optical fibers resulting in the availability of photonic crystal fibers (PCF) (Knight and Skryabin, 2007). Photonic crystals are dielectric or metallic materials with the periodic structure of the refractive index. The periodicity of the refractive index results in photonic bandgaps (PBGs), the range of optical frequencies where light cannot propagate. The PBG can be designed such that it is independent of the light propagation direction and polarization. There are two main types of photonic crystal fibers: PBG-based fiber (Cregan and others, 1999) and modified total internal reflection (MTIR) based fiber (Birks and others, 1997; Knight and others, 1996). MTIR-based fiber is analogous to TIR-based fiber, although its cladding is made of photonic crystal. Generally, the PBG-based fiber core has a lower effective refractive index than the cladding, whereas the MTIR-based fiber core has higher one than cladding. PCF has various potential applications in nonlinear microscopy imaging and telecommunications areas, since it has better optical characteristics than TIR-based optical fibers in terms of guiding, dispersion, and refraction (Lourtioz, 2005). It has been shown that the dispersion of ultrafast optical pulses can be significantly reduced by using photonic crystal fibers (Gobel and others, 2004; Kim and others, 2005; McConnell and Riis, 2004; Tai and others, 2004). Importantly, photonic crystal fibers also offer better performance than traditional fibers in conducting high power ultrafast optical pulses. Despite its promises, the effects of ultrafast pulse delivery using photonic crystal fibers on the performance of nonlinear microscopes still need to be further quantified.
Several researchers have studied the performance of delivering ultrafast optical pulses with optical fibers. Step-index single-mode fiber delivery had been well characterized (Bird and Gu, 2002; Helmchen and others, 2002), but their performances with step-index multimode fiber were partially described (Lago and others, 1995). The use of pulse compressor to compensate for chromatic dispersion of these step-index single-mode fibers has been studied (Helmchen and others, 2002). Some types of PCFs, hollow-core PCF (Gobel and others, 2004; Tai and others, 2004), TIR-based PCF (McConnell and Riis, 2004), and double-clad PCF (Fu and others, 2005; Myaing and others, 2003), were also studied in terms pulse spectral and temporal profiles. Most prior studies have only demonstrated the feasibility for two-photon excitation (TPE), but the efficiency to induce nonlinear effects by light pulses after fiber delivery has not been quantified compared with free space delivery. Further, the effects of fiber delivery on optical resolutions in the nonlinear microscopy have not been evaluated.
In this paper, we systematically characterize the performance of two-photon microscopic imaging using a variety of optical fibers for excitation light delivery. The performance is evaluated, based on the parameters including: spectral bandwidth, temporal pulse width, two-photonex citation efficiency, and microscope optical resolution. Additionally, the effect of optical pulse compensation is evaluated based on optical pulse profile and two-photon excition efficiency.
MATERIAL AND METHODS
Instrumentation
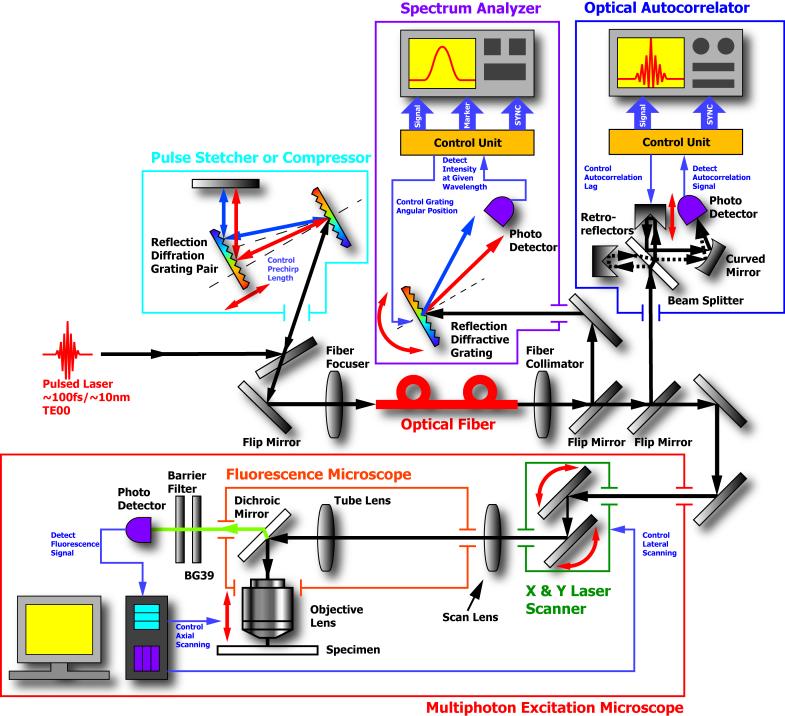
Figure 1 shows the experimental apparatus used to characterize the performance of a nonlinear microscope when ultrafast optical pulses are conducted through a variety of optical fibers. The pulses were generated by a Ti:Sapphire femtosecond laser (Tsunami, Spectra-Physics, Mountain View, CA), which was pumped by a continuous wave solid state laser (Millennia V, Spectra-Physics, Mountain View, CA). The Ti:Sapphire is tunable over a broad range in the near-infrared (NIR) wavelength range, producing pulse widths as short as 50 fs with the pulse repetition rate of ∼80MHz. In our experiment design, we chose ∼100 fs ultrafast optical pulse with the center wavelength of 780nm. The pulse width is short enough to achieve efficient TPE. This wavelength is suitable for the excitation of many endogenous and exogenous fluorophores in biological specimens. A ruled grating-based optical pulse compressor (Treacy, 1968) was installed for prechirping to compensate for chromatic dispersion in some measurements. The properties of the optical pulses were examined by an optical autocorrelator and a spectrum analyzer in the temporal and the spectral domain respectively. The collimated light after fiber delivery was steered into a two-photon microscope based on an inverted platform (Axiovert S100TV, Carl Zeiss MicroImaging Inc., Thornwood, NY). A galvanometric laser scanning system (6350, Cambridge Technology, Cambridge, MA) was employed for lateral raster scanning and a piezoelectric objective positioner (P-721.00, Physik Instrumente L.P., Auburn, MA) was installed for axial scanning. These experiments were performed using a 40X oil-immersion objective lens (Fluar, 40X / 1.30 Oil, Carl Zeiss MicroImaging Inc., Thornwood, NY) for high resolution imaging. A photomultiplier tube (PMT) (R7400P, Hamamatsu Photonics K. K., Hamamatsu, Japan) was used in single photon counting mode for light detection.
Fig. 1.
An experimental design for measuring ultrafast optical pulse characteristics through optical fibers and the resultant two-photon excitation fluorescence microscopy performance. The experimental apparatus consists of a pulse compressor, an optical fiber coupling system including a fiber focuser and a fiber collimator, a two-photon excitation laser scanning fluorescence microscope. The pulse compressor provides linear prechirping to compensate for chromatic dispersion in the system. The optical pulse profile can be measured with an optical autocorrelator and a spectrum analyzer. The delivered optical pulses enter into a two-photon excitation fluorescence microscope where the TPE and the optical resolution are measured.
Optical Fibers
TIR-based fibers are categorized into step-index fibers, in which the refractive index at the core-cladding boundary changes abruptly, and graded-index fibers, in which the refractive index in the core changes gradually as it reaches to the refractive index of the cladding. They are also classified into single-mode fibers or multimode fibers, depending on how many transverse modes they propagate. PCF includes MTIR-based fiber and PBG-based fiber as described earlier. Among those fibers, six common commercially available optical fibers were selected in this experiment as listed in Table 1. For step-index fibers, three fibers with different core size and number of modes were used: a single-mode fiber (SISMF5um), a slightly large-core fiber (SIMMF10um) and a multimode fiber (SIMMF50um). This wide selection allows the effects of different core size and different number of propagating modes to be evaluated. Graded-index fiber (GIMMF50um) was also used to investigate the effects of having graded-index versus step-index. For the case of PCF, we chose two fibers: a hollow-core photonic crystal fiber (HCPCF6um) and a double-clad photonic crystal fiber (DCPCF16um). HCPCF6um employs PBG, whereas DCPCF16um uses MTIR which enables only single-mode light delivery even though its core is large enough to carry multiple modes. Two-meter fiber was used for each case as it is a reasonable length for most biomedical applications. All fibers except for PCFs had FC/APC connectors on both ends to avoid back-reflection to light source. No connectors were used in PCFs because the air-silica hole structure used in constructing photonic crystal may be contaminated during the polishing process needed in connecterizing the fiber.
Table 1.
List of optical fibers used in the fiber characterization
| Fiber type (Manufacturer’s part number) |
Core (μm) |
Cladding (μm) |
Fiber NA |
Manufacturer | Notation |
|---|---|---|---|---|---|
| Hollow-core photonic crystal fiber (AIR-6-800) |
6 | 125 | 0.17 | Crystal Fibre A/S, Birkerød, Denmark |
HCPCF6um |
| Double-clad photonic crystal fiber (DC-165-16-Passive) |
16 | *165 /350 | 0.04 | DCPCF16um | |
|
| |||||
| Step-index single-mode fiber (SMJ-3AF3AF-780-5/125-3-2) |
5 | 125 | 0.14 | OZ optics, Ontario, Canada |
SISMF5um |
| Step-index multimode fiber (QMMJ-3AF3AF-UVVIS-10/125-3-2) |
10 | 125 | 0.10 | SIMMF10um | |
| Step-index multimode fiber (QMMJ-3AF3AF-IRVIS-50/125-3-2) |
50 | 125 | 0.22 | SIMMF50um | |
| Graded-index multimode fiber (MMJ-3AF3AF-IRVIS-50/125-3-2) |
50 | 125 | 0.22 | GIMMF50um | |
inner cladding/outer cladding
Measurements
We first measured the coupling efficiency of these fibers, defined here as the ratio the optical power after fiber output to the optical power before fiber input. It was obtained by measuring average optical power both before and after fiber delivery with a thermopile power meter (LaserMate with LD10 sensor, Coherent Inc., Santa Clara, CA). We further measured the full-width-at-half-maximum (FWHM) of the temporal and spectral profile of the optical pulse after fiber delivery and compared these parameters with free space propagation. Two different approaches are commonly used to measure pulse temporal profile: optical autocorrelation (Rullière, 2005)and frequency-resolved optical gating (FROG) (Trebino, 2000). FROG measurement provides more detailed information. However, commercially available FROG is designed to measure pulses width in the range of 50 to 200 fs and the optical pulses broadened by some fibers can be as wide as several picoseconds. Thus, an interferometric optical autocorrelator (Autocorrelator MINI, APE GmbH, Berlin, Germany) was chosen in this experiment because it has very high signal to noise ratio (SNR), and is capable of measuring autocorrelation up to 15 ps. In this paper, we define temporal pulse width of the optical pulse as the FWHM of autocorrelaton function. We also measured power spectrum of these pulses to provide complementary information since the highly chirped optical pulse shape cannot be adequately characterized by optical autocorrelation alone. A laser spectrum analyzer (E201LSA03A, Imaging System Group, Horseheads, NY) was used and we define the spectral bandwidth of the optical pulse as the FWHM of optical power spectrum. Using the two-photon excitation fluorescence microscope, we further measured TPE efficiency and optical resolution. TPE efficiency is described as ratio of the number of the fluorescence photons detected from a specimen as a function of optical power delivered by the microscope objective. A 232 μM aqueous fluorescein (fluorescein-5-isothiocyanate, Invitrogen, Carlsbad, CA) solution was used as a standard specimen in all these measurement. For optical resolution measurements, the point spread function (PSF) of 0.1 μm diameter carboxylate-modified yellow-green (505/515) fluorescent beads (F8803, Invitrogen, Carlsbad, CA) were imaged in 3D. The resolution is quantified by the FWHMs of the PSF along lateral and axial directions.
RESULTS AND DISCUSSION
Characteristics of ultrafast optical pulse through the fibers
Fiber coupling efficiency
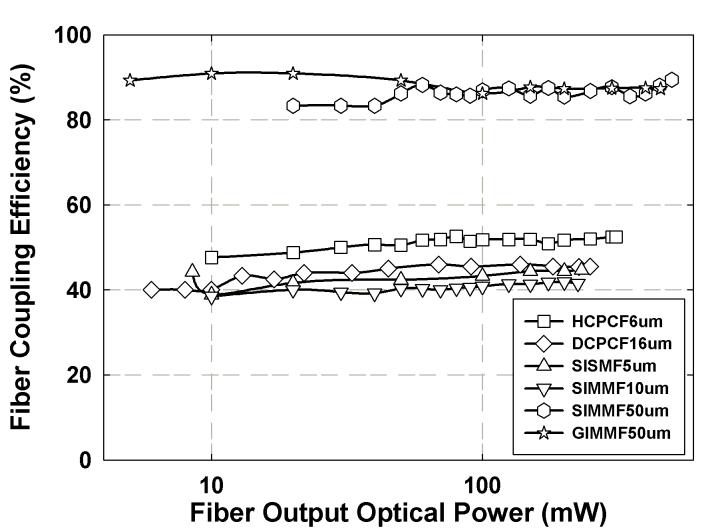
Figure 2 presents maximally achieved coupling efficiency for each fiber with respect to fiber output optical power. First, the coupling efficiency is also mostly independent of fiber output optical power. All the fibers with smaller core have 40-50% coupling efficiency, and the others have 80-90% except for DCPCF16um. In this special case, its coupling efficiency is similar to smaller core fibers due to low numerical aperture (NA) of the fiber core.
Fig. 2.
The maximum coupling efficiencies for different types of fibers are plotted. The x-axis represents the fiber output optical power on a logarithmic scale. Fiber coupling efficiency is observed to be power-independent. All the small-core fibers have 40-50%, whereas most of the large-core fibers have 80-90%. Note that DCPCF16um has similar coupling efficiency to small-core ones due to its small fiber core NA, even though it has relatively large core.
Coupling efficiency is associated with optical loss. The optical loss generally includes all the loss through the fiber such as coupling loss and optical power attenuation which is negligible in two-meter fiber length. Furthermore, collimating the light after the fiber entails little loss, whereas optical loss occurs primarily during the coupling of light into the fiber. The spot diameter of focused rays on the surface of fiber core can be calculated assuming a diffraction-limited spot size. If we assume the lens aperture is circular, and the rays have uniform intensity and the NA of the lens ( NAlens ) is smaller than the NA of the fiber ( NAcore ), the theoretical coupling efficiency εcoupling can be simplified as follows.
| (1) |
where dcore is the core diameter of fiber, dFWHM is a spot intensity FWHM for circular aperture, and λ is center wavelength of the optical pulse. The coupling efficiency is a function of NAlens, but it is more complicated than Eq.(1) if NAlens > NAcore. The NAlens used in this experiment is 0.10 - 0.30, resulting in a spot diameter of 1.3 - 4.0 μm, and practically, NAlens is not always smaller than NAcore. Nevertheless, it is clear that the coupling efficiency of the fiber increases as fiber core size increases, but a large fiber core allows the propagation of a large number of modes that may interfere, resulting in a loss of TPE efficiency and image resolution. For a fiber with much smaller NAcore than NAlens, such as the DCPCF16um, it has a low coupling efficiency although its core size is relatively large, since the difference between NAlens and NAcore is dominant in determining the coupling efficiency.
Temporal and spectral optical pulse profile
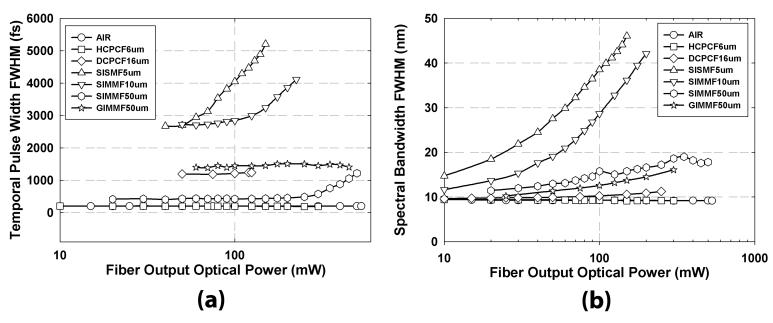
To observe fiber delivery effects on the ultrafast optical pulse, the optical pulse profile should be analyzed both temporally and spectrally since the intensity spectrum complements the temporal profile in the characterization of ultrafast optical pulses. Figure 3 plots the temporal pulse width and the spectral bandwidth of the optical pulse with respect to fiber output optical power. Free space light delivery (denoted in figures as AIR) was also measured as a reference. From the figure 3(a), extrapolating temporal pulse width to low optical power, the temporal pulse broadening is substantially higher than free space delivery for some fibers, indicating that dispersion effects are significant, especially for small-core TIR-based fibers (SISMF5um and SIMMF10um). Moreover, they also exhibit strong power-dependent temporal broadening. TIR-based multimode fibers (SIMMF50m and GIMMF50um) and DCPCF16um are relatively power-independent and maintain relatively short temporal pulse width until the fiber output optical power is very high. Nevertheless, the temporal pulse width of HCPCF6um is almost identical to free space delivery. In addition, its temporal pulse width is independent of optical power. In figure 3(b), at low fiber output power, the spectral bandwidth remains narrow for all fibers. However, the spectra broaden as the fiber output optical power increases in TIR-based fibers (SISMF5um, SIMMF10um, SIMMF50um, and GIMMF50um). The spectral broadening is greater for smaller core fibers. Graded-index fiber (GIMMF50um) has less spectral broadening than step-index fiber (SIMMF50um) of same core size. In contrast, HCPCF6um transmits ultrafast optical pulse without any spectral distortion. Moreover, its spectral bandwidth and temporal profile are independent of fiber output optical power. DCPCF16um has nearly constant spectral bandwidth over the optical power, but demonstrates very low spectral distortion at high fiber output optical power.
Fig. 3.
(a) Temporal pulse width and (b) spectral bandwidth of the optical pulse after various fiber delivery methods are plotted. Free space delivery is included as a reference. The x-axis represents fiber output optical power on a logarithmic scale for both (a) and (b). HCPCF6um demonstrates intact optical pulse delivery from the experimental results.
These observations can be explained by nonlinear fiber optics theory. From the pulse propagation equation for ultrafast optical pulse through the single-mode fiber, the length scale for dispersion and nonlinearity can be introduced, assuming that the nonlinear effects except for SPM are negligible and GVD is much larger than third order dispersion (TOD), β2 >> β3 (Agrawal, 2001). Dimensionless length can be also expressed as below:
| (2) |
LD and LNL represents dispersion length with GVD and nonlinear length respectively. β2 is a GVD, T0 is initial pulse width, P0 is peak power of initial optical pulse and γ is a nonlinear parameter. In addition, n2 is a nonlinear index coefficient, ω0 is the center frequency of initial optical pulse, c is the speed of light in free space, and Aeff is the effective core area related to core size and core-cladding index difference. From Eq.(2), the nonlinear effect dominates dispersion if LNL is shorter than LD, and vice versa. Since LNL is proportional to Aeff , the nonlinear effects such as SPM and Kerr effect become dominant as core size decreases. These nonlinear effects are strongly related to the spectral broadening, irrespective of material dispersion since it is caused by phase mismatching between different wavelengths. The experimental results show that the pulses delivered by all the fibers have the same initial spectral bandwidths at very low optical power based on the extrapolation; this observation confirms the spectral bandwidth analysis of the optical pulse. For the temporal broadening, its dominant factor depends on the ratio of the dispersion length to the nonlinear length. At the very low optical power, chromatic dispersion is the major cause of temporal broadening. At high optical power, temporal broadening is mostly due to nonlinear effects. The level of nonlinear effects also depends on the core size of fiber.
Our experimental results for solid-core fibers (DCPCF16um, SISMF5um, SIMMF10um, and SIMMF50um) agree with this theory for TIR-based single-mode fibers. In addition to chromatic dispersion, material dispersion is also present, but is the same for all fibers at a given fiber length regardless of fiber core size. Further, fiber core size is also associated with number of modes which fiber can deliver. For single-mode delivery, there is waveguide dispersion (Ghatak and Thyagarajan, 1998), but is in general negligible in our spectral range. For multimode fibers, intermodal dispersion may exist. Thus, total dispersion at very low optical power also depends on the number of modes and that explains different core size fibers shows different total dispersion. Regarding the type of fiber cores, the light propagates in the graded-index core along the longer optical path, compared with step-index core due to different refractive index profile, since the graded-index core is designed for the light to travel along parabolic path instead of linear one. For a given fiber length, greater temporal broadening due to material dispersion occurs in the graded-index fiber, and results shows SIMMF50um has lower temporal broadening than GIMMF50um. In addition, both are multimode fibers, and their spectral bandwidths are quite different because the spectral profile of the optical pulse depends on the propagating modes in the fiber. It is difficult to measure spectral bandwidth for multimode fiber due to the sensitivity of propagating modes to fiber bending. Nonetheless, we observe that nonlinear effects are less apparent in large-core fibers since their spectral bandwidths have only weak power dependence. Although the pulse propagation equation presented in Eq.(2) is derived for single-mode fibers,it does predict that nonlinear effects in multimode fibers are not dominant since these fibers’ effective areas are large. Further, spectral bandwidth in graded-index fiber (GIMMF50um) is less affected by the nonlinear effect than in step-index fiber (SIMMF50um). This difference comes from the difference in refractive index structures of these fibers.
For PCF fibers, HCPCF6um shows neither material dispersion nor nonlinear effects since the ultrafast optical pulse travels mostly through the hollow-core where the refractive index is uniform anywhere. In contrast, the behavior of DCPCF16um is quite different, based on differences in the mechanisms of guiding light. In MTIR-basedfiber, similar to conventional optical fiber, light propagates through material with wavelength and power-dependent refractive index.
The performance in the nonlinear microscopy after fiber deliveries
Two-photon Excitation Efficiency
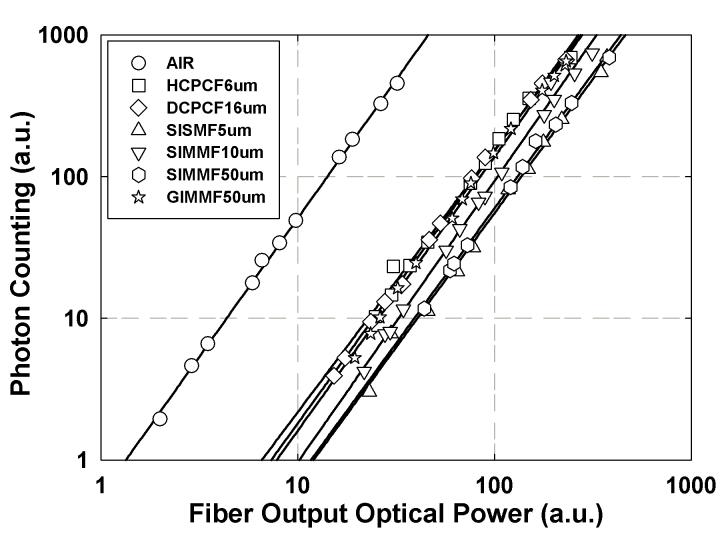
TPE efficiency measures the efficiency of fluorophores excited by light pulses. Figure 4 shows TPE efficiency for various fibers as a function of power. In a log-log plot, a quadratic dependence on power implies the power dependence should be linear with a slope of 2. All fibers show quadratic dependence as expected for two-photon process. In our experiments, hollow-corephotonic crystal fiber (HCPCF6um) delivery has the best TPE efficiency after fiber delivery. Due to large temporal pulse width broadening, single-mode fiber (SISMF5um) delivery has the worst TPE efficiency. TPE efficiency can be theoretically calculated as (Denk and others, 1990):
| (3) |
Fig. 4.
TPE efficiency in a two-photon excitation fluorescence microscope with light pulses delivered by different fibers. Quadratic dependence of sample fluorescence as a function of power indicates TPE process. Fiber delivery is much less efficient for TPE than for free space delivery. Among all the fibers tested, HCPCF6um is the most efficient fiber delivery medium.
where na is the number of photons absorbed per fluorophore per pulse, τp is the pulse width, δ is fluorophore’s two-photon absorption at given wavelength λ, Po is average laser power, fp is laser repetition rate, ħ is Planck’s constant, c is the speed of light, and NAeff is the effective NA of objective lens. From Eq. (3), fiber delivery does not change any parameters except for τp and NAeff . If NAeff remains constant, the coefficient of TPE efficiency is inversely proportional to τp, temporal pulse width. Since τp often broadens with fiber delivery, the TPE efficiency is expected to decrease when light is conducted through fibers. It is interesting to note that the TPE efficiency for hollow-core PCF (HCPCF6um) is significantly lower than free space delivery, even though both spectral bandwidths and temporal pulse widths are comparable for both delivery methods. The discrepancy between the theory and the measurement may originate from the fact that the fiber output light is not single mode and hence there is effectively lower NA. Another possibility is that this TPE theory assumes that optical pulse delivered through fibers is transform-limited, or chirp-free optical pulse. It has been reported that TOD can be significant in photonic crystal fibers, and the balance between normal GVD and TOD results in soliton-like behavior resisting dispersion of ultrafast pulses in some cases (Ouzounov and others, 2003). However, the phase shift induced by these high order dispersions can also generate the chirping of the pulses as well as the change of pulse shapes. Since optical pulse shape plays major role in TPE efficiency (Bardeen and others, 1999), and the temporal width of the autocorrelation profile cannot determine if the pulse is chirped or chirp-free, chirping effect may be another major source to deteriorate TPE efficiency. If intermodal dispersion is induced, TPE efficiency can decrease significantly, since TPE process is sensitive to the wavefront mismatch caused by intermodal dispersion.
Point spread function
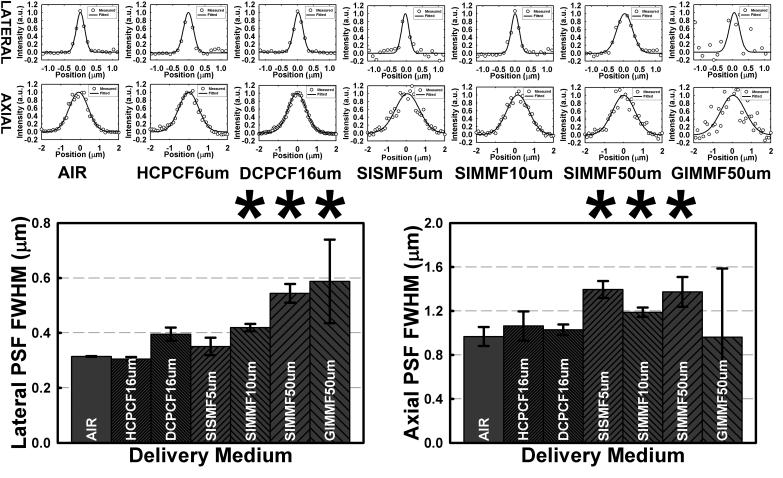
Optical resolution is usually defined by the Rayleigh criterion that can be operationally quantified from the FWHM of the PSF. Figure 5 shows the measurements of both lateral and axial PSF for the two-photon microscope after light is delivered by the different fibers. For each fiber delivery method, top figures are intensity profiles of a point source in the solution, and bottom figures show the FWHM measurements. As seen in the figures, the FWHM of lateral PSF increases with the number of modes that the fiber delivers, whereas the FWHM of axial PSF is not sensitive to the number of delivered modes.
Fig. 5.
PSFs in a two-photon excitation fluorescence microscope using different fiber delivery methods. The top figures show both the lateral and the axial PSF measurements with light delivered through various fibers. Free space delivery is included for comparison. Bottom figures represent statistical analysis of the lateral and the axial PSF FWHMs for each delivery method. The lateral resolution is dependent on the number of modes that the fiber supports, whereas the axial resolution is almost independent of delivery method. The symbol, *, on top of bars, indicates that optical resolution is statistically different from free space delivery, based on a t-test with P<0.05.
Theoretically, the excitation PSF determines the optical resolution in laser scanning microscopy with photodetector such as PMT. The excitation PSF intensity profile can be calculated as shown in So et. al. (So and others, 2000), and the lateral and the axial optical resolution can be estimated, using a Gaussian fit of the PSF (Zipfel and others, 2003).
| (4) |
n is effective refractive index of the specimen, FWHMxy is the FWHM of lateral PSF and FWHMz is the FWHM of axial PSF function. As expressed in Eq. (4), optical resolution is determined by NAeff and λ. However, the basic assumption for above equations is that the illumination light has a distortion-free wavefront and its intensity is uniform in the lateral direction. The lateral PSF profile depends how many modes are delivered. When the number of delivered modes is close to unity, the experimentally measured PSF is close to the theoretical one; otherwise, the lateral optical resolution is degraded. The axial resolution was found to be less dependent on the delivery modes and may be a result of the lateral nature of these spatial modes. In Eq.(4), axial resolution is found to be more sensitive to the objective NA and the sample’s refractive index, but they are irrelevant to our experimental results since same objective and sample were used. The effect of spatial modes on axial resolution requires further investigation.
Two-photon excitation fluorescence imaging
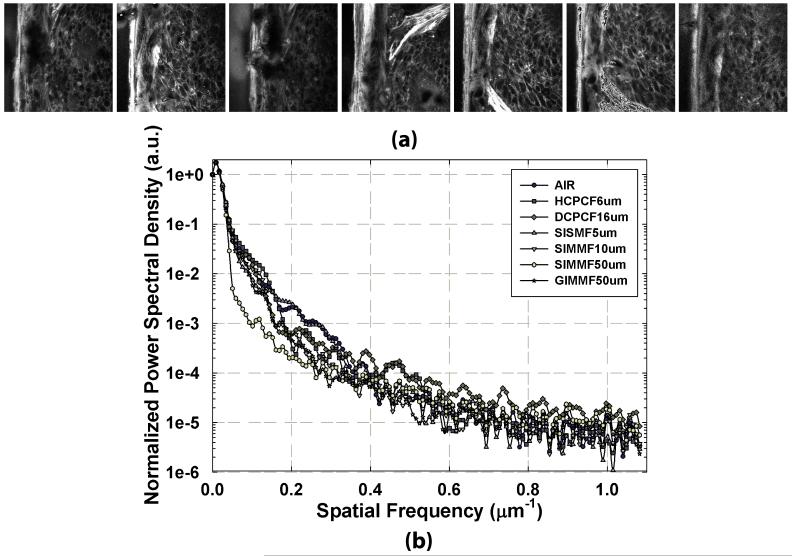
The resolution of the two-photon excitation fluorescence microscope was further evaluated in the imaging of biological specimen. Two-photon excitation fluorescence microscopy can effectively image human skin, using optical fiber for light delivery. Human tissue was fixed and H&E (haematoxylin and eosin) stained. Eosin (Berlman, 1971) produces fluorescence during two-photon imaging. For the 40× oil-immersion objective lens used, the image field of view was 120 μm by 120 μm. Figure6(a) shows human skin fluorescence images taken in using different fibers for light delivery. In terms of image resolution and detail, the difference between fiber delivery methods appears to be minimal. In order to better quantify these differences, we used power spectral image analysis (Lim, 1990; Oppenheim and others, 1999). The power spectra for human skin were measured with different fiber delivery methods in the figure6(b). As expected, image power spectra confirm the results of lateral PSF measurements. Images with single-mode fibers have more power than those with multimode fibers at the given spatial frequency range where tissue details exist. At the high spatial frequency region, there is no power spectral density difference for different delivery methods since these high frequency features are dominated by photon shot noise in the image.
Fig. 6.
(a) Two-photon excitation fluorescence images for H&E-stained ex-vivo human skin with different fiber delivery methods. From left to right: AIR, HCPCF6um, DCPCF16um, SISMF5um, SIMMF10um, SIMMF50um and GIMMF50um (b) The power spectra of images obtained with different fiber delivery methods. Power spectral image analysis was performed on a series of human skin images obtained in (a). At low spatial frequency range, the images acquired using fibers with small number of modes have higher power spectral densities than those with large number of modes. At high spatial frequency region, power spectral density levels for all the fiber delivery methods, including free space delivery, are same since noise dominates at this regime. The maximum spatial frequency for given NA is 2.3 μm-1
Linear prechirping effects for the fiber deliveries
Temporal pulse broadening results in lowering TPE efficiency, which is inversely proportional to temporal pulse width. The major cause of the pulse broadening originates from chromatic dispersion where material dispersion is dominant. To eliminate broadening effect, an optical pulse compressor is often used for prechirping the pulses linearly (Fork and others, 1984). The pulse compressor mainly consists of a reflective diffraction grating pair configured so that the blue components of the optical pulse propagate faster than its red components (Treacy, 1968), in contrast to the chirping that occurs in the optical fiber delivery. This effect is called linear prechirping and increases with the grating pair separation. At the grating pair separation where linear prechirping cancels out chromatic dispersion, the optical pulse width can be restored close to original one after fiber delivery in the fiber. We measured the impact of linear prechirping on the TPE coefficient as well as optical pulse profile. Large-core fibers (SIMMF50um and GIMMF50um) were not used in these experiments since they do not provide good optical resolutions for nonlinear microscopy imaging. In the following discussion, a suffix ‘.PC’ after the fiber name indicates the linearly prechirped result.
Effects of linear prechirping on ultrafast optical pulse
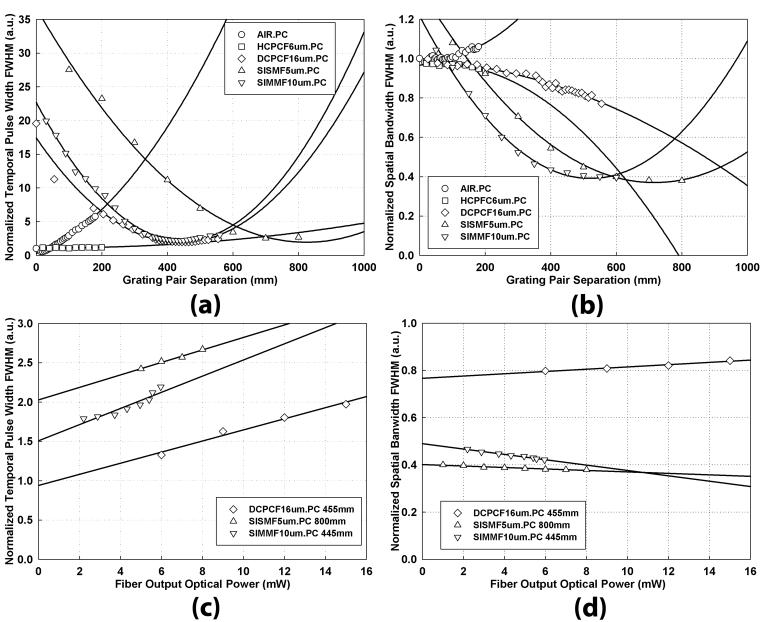
Figure 7 shows linear prechirping results of the ultrafast optical pulse. The optical pulses after the fiber deliveries with the linear prechriping were measured with respect to grating pair separation. As shown in figure 7(a), the linear prechirping only broadens the pulses for free space (AIR.PC) and hollow-core fiber (HCPCF6um.PC) since the optical pulses which travel through them are chirp-free. For solid-core fibers (DCPCF16um.PC, SISMF5um.PC and SIMMF10um.PC), prechirping is quite effective, but this procedure cannot completely restore the optical pulse back to the original temporal width. In terms of prechirping effect on the spectral bandwidth, spectral narrowing occurs for all the fibers, while a little spectral broadening is shown in free space delivery. (See Figure 7(b).) At the optimal grating pair separation where minimum temporal pulse width was obtained, we measured temporal pulse width and spectral bandwidth for solid-core fibers as the functions of fiber output optical power in figure 7(c) and 7(d) respectively. Note that free space delivery and for hollow-core PCF cases are not shown since their pulse profiles are already optimal with no prechirping. Similar to the results without linear prechriping, both the temporal and the spectral broadening of the optical pulses are dependent on the fiber output optical power.
Fig. 7.
The effects of linear prechirping on (a) temporal pulse width and (b) spectral bandwidth of the optical pulse with respect to grating pair separation are shown. At the optimal grating pair separation in the pulse compressor, power dependences are also observed in terms of (c) temporal pulse width and (d) spectral bandwidth.
Transform-limited ultrafast optical pulses become prechirped or negatively chirped through pulse compression. There may be further temporal broadening due to phase mismatchingand the spectral broadening due to residual phase distortion (Washburn and others, 2000). For HCPCF6um.PC, prechirping the optical pulse results in some temporal broadening and spectral narrowing, a behavior that is different from free space delivery. Both DCPCF16um.PC and SIMMF10um.PC have similar pulse compression behaviors for a given fiber length since material dispersion is dominant. The optical grating pair separations to optimize their pulse profiles are also comparable. However, SISMF5um.PC requires much longer distance between gratings to compensate for pulse broadening. This means that the optical pulse delivered with single-mode fiber has additional pulse broadening due to the nonlinear effects in this smaller core fiber. It is interesting to observe that spectral narrowing occurs for solid-core fibers; this observation agrees with spectral narrowing due to SPM (Oberthaler and Hopfel, 1993). Even after the temporal pulse width is optimized using the pulse compressor, we observe that the pulse profiles for some fibers can be quite different from the original transform-limited condition and the pulse profiles show power dependence due to nonlinear effects such as SPM and Kerr effect. Finally, our observations for the behaviors of SISMF5um and SIMMF10um for nonlinear microscopy imaging are also consistent with the observation of Helmchen et. al.(Helmchen and others, 2002).
Effects of linear prechirping on nonlinear microscopy performance
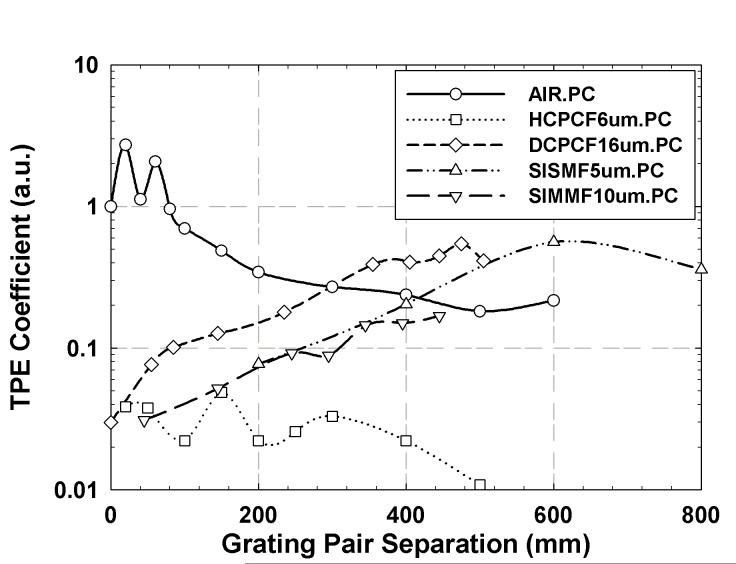
Figure 8 shows the impact of linear prechirping on TPE efficiency. The TPE efficiencies for the different fibers were normalized to that of free space delivery with chirp-free optical pulse, and they are inversely proportional to the temporal pulse widths shown in the figure 7(a). In the TPE efficiency curve, the grating pair separation to maximize TPE efficiency is slightly longer than the distance that minimizes temporal pulse width. This effect is caused by the additional dispersion introduced by optical components such as the objective in the microscope. Without the linear chirping, HCPCF6um has the best TPE efficiency although it remains 20 times worse than free space delivery. However, with linear prechirping, the TPE efficiency for solid-core fibers can be significantly improved. At optimal prechirping, DCPCF16um.PC and SISMF5um.PC have TPE efficiencies of a factor of two from free space delivery.
Fig. 8.
The normalized TPE coefficients affected by the linear prechirping were measured in the function of grating pair separation. TPE coefficient for each fiber delivery was measured and normalized by the one for chirp-free optical pulse delivery in free space.
CONCLUSION
In this paper, we characterized the performance of a variety of optical fibers that may be used for nonlinear optical microscopy. We observed ultrafast optical pulse profile both temporally and spectrally. Spectral bandwidth is sensitive to nonlinear effects such as SPM and Kerr effect, whereas temporal pulse width is affected by both nonlinear effects and chromatic dispersion. The nonlinear effects originate from the nonlinearity of refractive index in the fiber core materials. We measured two-photon excitation fluorescence microscopy performance in terms of TPE efficiency and optical resolution. A TPE process was observed for all the fiber delivery methods, but their signal levels depends on spectral bandwidth, temporal pulse width, spatial intensity profile, and phase mismatch induced by mode shape, chirping, and intermodal dispersion. Optical resolution was evaluated by PSF measurements. We observed that optical resolution is relatively insensitive to laser pulse temporal profile, albeit more sensitive laterally than axially. In addition, the linear prechirping is important to maximize the TPE efficiency of solid-core TIR- based and MTIR-based fibers.
In conclusion, the double-clad PCF and some step-index single-mode fibers are strong candidates for delivering the ultrafast optical pulse for nonlinear microscopic and endoscopic imaging with linear prechirping. However, it should be noted that the performances of these fibers are power-dependent, and generally degrades at higher power. Since this power degradation behavior is relatively modest for the typical power level used in nonlinear microscope imaging, it is more important to optimize linear prechirping for different fiber lengths. Although the hollow-core PCF appears to have excellent pulse characteristics after delivery, its TPE efficiency is not acceptable for most nonlinear microscope applications. The reason for the low TPE efficiency is not fully understood and further investigations based on modal analysis and spatio-temporal analysis using FROG are needed. Nonetheless, this fiber may be used where high power delivery is required without any power-dependent nonlinearity, such as in constructing portable multifocal multiphoton excitation fluorescence microscopes.
ACKNOWLEDGEMENT
This work is supported by NIH R33 CA091354 and Singapore-MIT Alliance.
REFERENCES
- Agrawal GP. Nonlinear fiber optics. xvi. Academic Press; San Diego: 2001. p. 466. [Google Scholar]
- Bardeen CJ, Yakovlev VV, Squier JA, Wilson KR, Carpenter SD, Weber PM. Effect of pulse shape on the efficiency of multiphoton processes: Implications for biological microscopy. Journal of Biomedical Optics. 1999;4(3):362–367. doi: 10.1117/1.429937. [DOI] [PubMed] [Google Scholar]
- Berlman IB. Handbook of fluorescence spectra of aromatic molecules. xiv. Academic Press; New York: 1971. p. 473. [Google Scholar]
- Bird D, Gu M. Fibre-optic two-photon scanning fluorescence microscopy. Journal of Microscopy-Oxford. 2002;208:35–48. doi: 10.1046/j.1365-2818.2002.01059.x. [DOI] [PubMed] [Google Scholar]
- Birks TA, Knight JC, Russell PS. Endlessly single-modephotonic crystal fiber. Optics Letters. 1997;22(13):961–963. doi: 10.1364/ol.22.000961. [DOI] [PubMed] [Google Scholar]
- Cregan RF, Mangan BJ, Knight JC, Birks TA, Russell PS, Roberts PJ, Allan DC. Single-mode photonic band gap guidance of light in air. Science. 1999;285(5433):1537–1539. doi: 10.1126/science.285.5433.1537. [DOI] [PubMed] [Google Scholar]
- Denk W, Strickler JH, Webb WW. Two-Photon Laser Scanning Fluorescence Microscopy. Science. 1990;248(4951):73–76. doi: 10.1126/science.2321027. [DOI] [PubMed] [Google Scholar]
- Evans CL, Xu XY, Kesari S, Xie XS, Wong STC, Young GS. Chemically-selective imaging of brain structures with CARS microscopy. Optics Express. 2007;15(19):12076–12087. doi: 10.1364/oe.15.012076. [DOI] [PubMed] [Google Scholar]
- Flusberg BA, Cocker ED, Piyawattanametha W, Jung JC, Cheung ELM, Schnitzer MJ. Fiber-optic fluorescence imaging. Nature Methods. 2005;2(12):941–950. doi: 10.1038/nmeth820. [DOI] [PMC free article] [PubMed] [Google Scholar]
- Fork RL, Martinez OE, Gordon JP. Negative Dispersion Using Pairs of Prisms. Optics Letters. 1984;9(5):150–152. doi: 10.1364/ol.9.000150. [DOI] [PubMed] [Google Scholar]
- Fu L, Gan XS, Gu M. Nonlinear optical microscopy based on double-clad photonic crystal fibers. Optics Express. 2005;13(14):5528–5534. doi: 10.1364/opex.13.005528. [DOI] [PubMed] [Google Scholar]
- Ghatak AK, Thyagarajan K. An introduction to fiber optics. xvi. Cambridge University Press; Cambridge ; New York: 1998. p. 565. [Google Scholar]
- Gobel W, Nimmerjahn A, Helmchen F. Distortion-free delivery of nanojoule femtosecond pulses from a Ti : sapphire laser through a hollow-core photonic crystal fiber. Optics Letters. 2004;29(11):1285–1287. doi: 10.1364/ol.29.001285. [DOI] [PubMed] [Google Scholar]
- Helmchen F, Tank DW, Denk W. Enhanced two-photon excitation through optical fiber by single-mode propagation in a large core. Applied Optics. 2002;41(15):2930–2934. doi: 10.1364/ao.41.002930. [DOI] [PubMed] [Google Scholar]
- Kim D, Kim KH, Yazdanfar S, So PTC. Optical biopsy in high-speed handheld miniaturized multifocal multiphoton microscopy. SPIE; San Jose, CA, USA: 2005. pp. 14–22. [Google Scholar]
- Knight JC, Birks TA, Russell PS, Atkin DM. All-silica single-mode optical fiber with photonic crystal cladding. Optics Letters. 1996;21(19):1547–1549. doi: 10.1364/ol.21.001547. [DOI] [PubMed] [Google Scholar]
- Knight JC, Skryabin DV. Nonlinear waveguide optics and photonic crystal fibers. Optics Express. 2007;15(23):15365–15376. doi: 10.1364/oe.15.015365. [DOI] [PubMed] [Google Scholar]
- Lago A, Obeidat AT, Kaplan AE, Khurgin JB, Shkolnikov PL, Stern MD. 2-Photon-Induced Fluorescence of Biological Markers Based on Optical Fibers. Optics Letters. 1995;20(20):2054–2056. doi: 10.1364/ol.20.002054. [DOI] [PubMed] [Google Scholar]
- Lim JS.Two-dimensional signal and image processing 1990xvi694.Prentice Hall; Englewood Cliffs, N.J. p., [4] p. of plates p. [Google Scholar]
- Lourtioz JM. Photonic crystals : towards nanoscale photonic devices. xviii. Springer; Berlin: 2005. p. 426. [Google Scholar]
- McConnell G, Riis E. Two-photon laser scanning fluorescence microscopy using photonic crystal fiber. Journal of Biomedical Optics. 2004;9(5):922–927. doi: 10.1117/1.1778734. [DOI] [PubMed] [Google Scholar]
- Myaing MT, Ye JY, Norris TB, Thomas T, Baker JR, Wadsworth WJ, Bouwmans G, Knight JC, Russell PSJ. Enhanced two-photon biosensing with double-clad photonic crystal fibers. Optics Letters. 2003;28(14):1224–1226. doi: 10.1364/ol.28.001224. [DOI] [PubMed] [Google Scholar]
- Oberthaler M, Hopfel RA. Special Narrowing of Ultrashort Laser-Pulses by Self-Phase Modulation in Optical Fibers. Applied Physics Letters. 1993;63(8):1017–1019. [Google Scholar]
- Oppenheim AV, Schafer RW, Buck JR. Discrete-time signal processing. xxvi. Prentice Hall; Upper Saddle River, N.J.: 1999. p. 870. [Google Scholar]
- Ouzounov DG, Ahmad FR, Muller D, Venkataraman N, Gallagher MT, Thomas MG, Silcox J, Koch KW, Gaeta AL. Generation of megawatt optical solitons in hollow-corephotonic band-gap fibers. Science. 2003;301(5640):1702–1704. doi: 10.1126/science.1088387. [DOI] [PubMed] [Google Scholar]
- Rullière C. Femtosecond laser pulses : principles and experiments. xvi. Springer Science+Business Media; New York: 2005. p. 426. [Google Scholar]
- So PTC, Dong CY, Masters BR, Berland KM. Two-photon excitation fluorescence microscopy. Annual Review of Biomedical Engineering. 2000;2:399–429. doi: 10.1146/annurev.bioeng.2.1.399. [DOI] [PubMed] [Google Scholar]
- Tai SP, Chan MC, Tsai TH, Guol SH, Chen LJ, Sun CK. Two-photon fluorescence microscope with a hollow-core photonic crystal fiber. Optics Express. 2004;12(25):6122–6128. doi: 10.1364/opex.12.006122. [DOI] [PubMed] [Google Scholar]
- Treacy EB. Compression of picosecond light pulses. Physics Letters A. 1968;28(1):34–35. [Google Scholar]
- Trebino R. Frequency-resolved optical gating : the measurement of ultrashort laser pulses. xvii. Kluwer Academic; Boston: 2000. p. 425. [Google Scholar]
- Washburn BR, Buck JA, Ralph SE. Transform-limited spectral compression due to self-phase modulation in fibers. Optics Letters. 2000;25(7):445–447. doi: 10.1364/ol.25.000445. [DOI] [PubMed] [Google Scholar]
- Yu CH, Tai SP, Kung CT, Wang IJ, Yu HC, Huang HJ, Lee WJ, Chan YF, Sun CK. In vivo and ex vivo imaging of intra-tissue elastic fibers using third-harmonic-generation microscopy. Optics Express. 2007;15(18):11167–11177. doi: 10.1364/oe.15.011167. [DOI] [PubMed] [Google Scholar]
- Zipfel WR, Williams RM, Webb WW. Nonlinear magic: multiphoton microscopy in the biosciences. Nature Biotechnology. 2003;21(11):1368–1376. doi: 10.1038/nbt899. [DOI] [PubMed] [Google Scholar]


