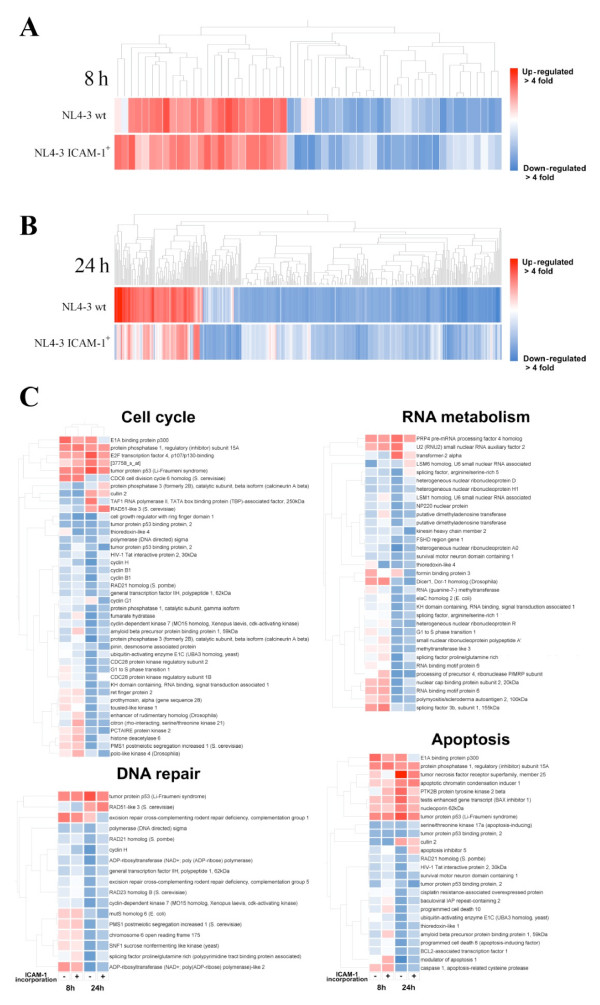
Figure 2.
Hierarchical clustering and gene ontology analysis of microarray data. (A) A hierarchical clustering of the 56 genes that are modulated (down- or up-regulated) by either NL4-3 wt or NL4-3 ICAM-1+ at 8 h post-infection (as determined by a two-fold threshold) has been defined using the correlation function of GeneSpring 6.0. (B) A hierarchical clustering of the 363 genes that are modulated (down- or up-regulated) by either NL4-3 wt or NL4-3 ICAM-1+ at 24 h post-infection (as determined by a two-fold threshold) has been defined using the correlation function of GeneSpring 6.0. (C) Hierarchical clustering of genes belonging to selected Gene Ontology categories identified by a Gene Ontology overrepresentation analysis as being significantly enriched within the list of genes modulated by HIV-1 is shown.

