

Abstract
Background
Insulin analogues may be associated with fewer episodes of hypoglycemia than conventional insulins. However, they are costly alternatives. We compared the cost-effectiveness of insulin analogues and conventional insulins used to treat type 1 and type 2 diabetes mellitus in adults.
Methods
We conducted a cost-effectiveness evaluation of insulin analogues versus conventional insulins using the Center for Outcomes Research Diabetes Model. We compared rapid-acting analogues (insulin aspart and insulin lispro) with regular human insulin, and long-acting analogues (insulin glargine and insulin detemir) with neutral protamine Hagedorn insulin. We derived clinical information for the comparisons from meta-analyses of randomized controlled trials. We obtained cost and utility estimates from published sources. We performed sensitivity analyses to test the robustness of our results.
Results
For type 1 diabetes, insulin aspart was more effective and less costly than regular human insulin. Insulin lispro was associated with an incremental cost of Can$28 996 per quality-adjusted life-year. The incremental cost per quality-adjusted life-year was Can$87 932 for insulin glargine and Can$387 729 for insulin detemir, compared with neutral protamine Hagedorn insulin. For type 2 diabetes, insulin aspart was associated with an incremental cost of Can$22 488 per quality-adjusted life-year compared with regular human insulin. For insulin lispro, the incremental cost was Can$130 865. Compared with neutral protamine Hagedorn insulin, insulin detemir was less effective and more costly. Insulin glargine was associated with an incremental cost of Can$642 994 per quality-adjusted life-year. The model was sensitive to changes in the effect size of hemoglobin A1c and to decrements applied to utility scores when fear of hypoglycemia was included as a factor.
Interpretation
The cost-effectiveness of insulin analogues depends on the type of insulin analogue and whether the patient receiving the treatment has type 1 or type 2 diabetes. With the exception of rapid-acting insulin analogues in type 1 diabetes, routine use of insulin analogues, especially long-acting analogues in type 2 diabetes, is unlikely to represent an efficient use of finite health care resources.
Insulin agents available for the treatment of diabetes mellitus include conventional insulins and insulin analogues. Insulin analogues were developed to mimic more closely the separate bolus and basal components of insulin secretion.1 Rapid-acting (bolus or mealtime) and long-acting (basal or background) analogue formulations are available. This new class of drugs has been promoted as providing more flexible treatment schedules and a reduced risk of hypoglycemia relative to conventional insulins.1
The cost of insulin analogues exceeds that of conventional insulins.2,3 More than US$7.3 billion was spent globally on the purchase of insulin products in 2005 — an increase of 19% over the previous year.4 It has been suggested that the increased expenditure was due to both the increasing prevalence of diabetes and the increased use of insulin analogues.5
We performed an analysis of the cost-effectiveness of insulin analogues compared with conventional insulins in the management of type 1 or type 2 diabetes in adults.
Methods
The economic model
We used the Center for Outcomes Research Diabetes Model6 to calculate the cost-effectiveness estimates. This model, described in detail by Palmer and colleagues,6 has been validated against published clinical and epidemiologic studies (Figure 1).7 Using data derived from the published literature, the model uses mathematical equations to determine the diabetes-related complications that would occur throughout a patient's life span.6 The equations take into consideration risk factors such as age and hemoglobin A1c levels, as well as patient characteristics, type of diabetes and history of diabetes-related complications.6 For type 1 and type 2 diabetes, correlation analyses produced R2 estimates of 0.9778 and 0.8861, which demonstrate that simulations in the Center for Outcomes Research Diabetes Model6 provide a reasonably accurate representation of patient outcomes in real-life settings.7

Figure 1: Schematic representation of the Center for Outcomes Research Diabetes Model (adapted and simplified from the original schematic by Palmer and colleagues6,7). The cycle length is 1 day for mild to moderate hypoglycemia, 3 months for severe hypoglycemia and 1 month for ulcer submodels. All other submodels have a cycle length of 1 year.
We derived the clinical effects of therapy (hemoglobin A1c, mild to moderate hypoglycemia and severe hypoglycemia), required as inputs for the model, from meta-analyses of randomized controlled trials (Table 1).8–10 We compared rapid-acting insulin analogues (insulin aspart and insulin lispro) with regular human insulin. We compared long-acting analogues (insulin glargine and insulin detemir) with neutral protamine Hagedorn insulin. For treatment comparisons, we compared insulin products either alone or in combination with an equivalent basal-bolus insulin.
Table 1

We used a time horizon of 60 years for patients with type 1 diabetes and 35 years for patients with type 2 diabetes. We derived patient characteristics from the published literature; these are reported in detail elsewhere.11
Determination of costs
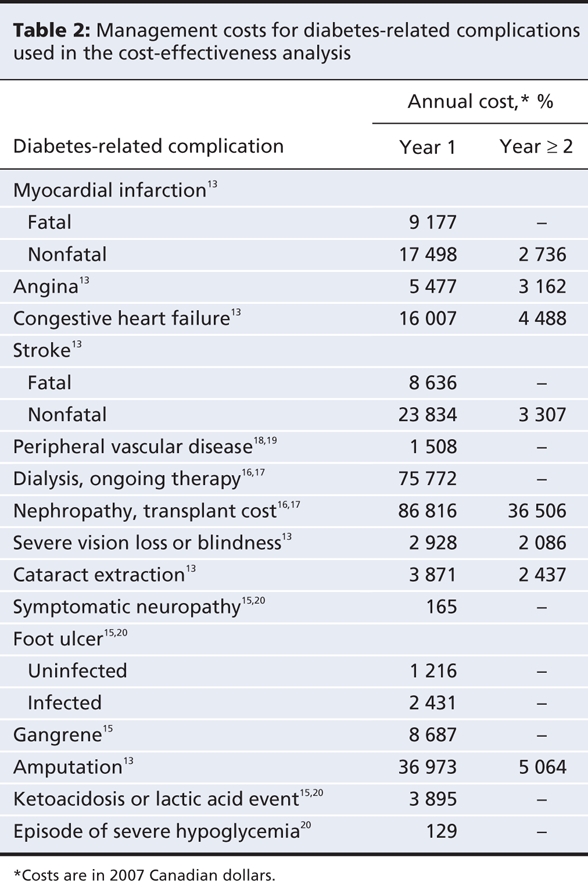
We used the perspective of a Canadian third-party payer such as a ministry of health or a single-payer insurance provider. Therefore, we included only direct health care costs in the model.12 We obtained costs for diabetes-related complications from the Ontario Diabetes Economic Model,13 the Alberta Health Costing Project14 and other published sources15–17 (Table 2). We included costs for inpatient and outpatient services, emergency department visits, subsequent prescriptions, long-term care and home-care services.
Table 2
We obtained unit costs for drugs from the Ontario Drug Benefit Formulary Comparative Drug Index (June 6, 2007)2 and the PPS Pharma Buyers Guide, Ontario Edition (July 2007) (Table 3).3 We assumed a cartridge-to-vial ratio of 65:35 based on utilization data from the Ontario Ministry of Health and Long-Term Care that was supplied by the Canadian Optimal Medication Prescribing and Utilization Service Advisory Committee. We assumed an average patient weight of 69 kg21–23for adults with type 1 diabetes and 91 kg14,15 for those with type 2 diabetes.
Table 3
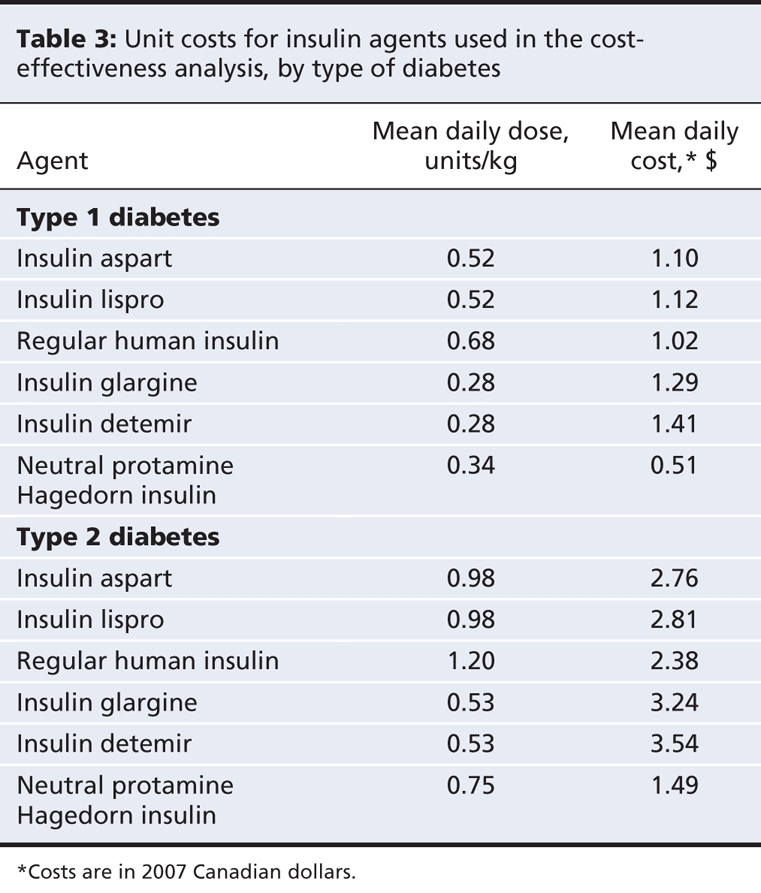
We estimated the mean daily dose for each treatment (Table 3) based on data from a patient sample supplied by an endocrinologist member of the Canadian Optimal Medication Prescribing and Utilization Service Expert Review Committee. The committee is an advisory body that makes recommendations related to the identification, evaluation and promotion of optimal drug prescribing and use in Canada. Its 12 members include endocrinologists, family physicians, pharmacists, health economists and members of the public.
Using Canadian guidelines for the economic evaluation of health technologies,12 we applied a rate of discount of 5% to both costs and outcomes. Using the health component of the Consumer Price Index,25 we adjusted all costs to 2007 Canadian dollars.
Outcome measures
The primary outcome measure was the quality-adjusted life-year, which captures both length of life (expressed in years) and quality of life (expressed as a utility score). A utility score is a standardized measurement of a person's preference about his or her state of health.26,27 A widely used instrument for determining utility scores is the EuroQol-5D.26–28 It consists of 5 dimensions: mobility, self-care, usual activities, pain or discomfort, and anxiety or depression.26–28 Each dimension has 3 levels of severity, for a total of 243 possible combinations of health states that are standardized against population norms.26–28 Based on a respondent's information, a summary value can be calculated, with 0 representing death and 1 representing full health.26–28 Health states valued as being worse than death can have negative scores.26–28
We derived utility estimates for our analysis from a catalogue of EuroQol-5D28 index scores for the population of the United States.29,30 The scores in the catalogue are adjusted for chronic conditions and determinants of health such as age, comorbidities, sex, ethnic background, income and education.31 Patients with uncomplicated type 1 diabetes were assigned a utility score of 0.783.29,30,32 Those with type 2 diabetes were assigned a utility score of 0.800.29,30 For diabetes-related complications, we applied decrements to the utility scores, shown in Appendix 1 (available at www.cmaj.ca/cgi/content/full/180/4/400/DC2).
Episodes of hypoglycemia were assumed to reduce a patient's ability to perform usual activities and to increase anxiety or depression,33 which would result in an intermittent decrease in utility. An episode of severe hypoglycemia was assumed to decrease utility scores by 0.54933 for a period of 24 hours.34,35 Patients with type 1 diabetes were assumed to have 0.96 episodes of severe hypoglycemia per year.36 Patients with type 2 diabetes were assumed to experience 0.28 episodes per year.37
For each episode of mild to moderate hypoglycemia, the utility score was assumed to decrease by 0.16733 for a period of 15 minutes.38,39 We assumed that patients with type 1 diabetes would experience 24.3636 episodes of hypoglycemia per year. Patients with type 2 diabetes were assumed to have 10.20 episodes per year.40
It has been suggested that a patient's fear of future episodes of hypoglycemia may have a chronic detrimental impact on his or her health-related quality of life.41 Estimates of the impact of fear on utility scores, however, have varied considerably.41–45 Because patients with poorly controlled diabetes are more likely to have hypoglycemia, it is uncertain whether the lower utility scores that have been reported are attributable to hypoglycemia and fear of future episodes or to severity of disease.41 Moreover, the Center for Outcomes Research Diabetes Model6 accommodates fear of hypoglycemia by applying a chronic decrement to health-related quality-of-life scores in the conventional-insulin arm, but not in the insulin-analogue arm. We therefore did not apply a chronic decrement to the utility score for fear of future episodes in the base-case analysis. However, we explored the impact of applying a chronic decrement for this factor through sensitivity analysis.
Sensitivity analysis
We assessed the effect of uncertainty across multiple model variables using nonparametric boot-strapping27,46 and second-order Monte Carlo simulations.47,48 We estimated the probability that a treatment was cost-effective at a particular threshold by plotting the results of the boot-strapping iterations using acceptability curves of cost-effectiveness. We performed one-way sensitivity analyses47 to examine the robustness of results to variation in parameters and model assumptions (reported in detail elsewhere11).
Results
Type 1 diabetes
The expected lifetime cost per patient with type 1 diabetes was lower for treatment with insulin aspart than for treatment with regular human insulin. The effectiveness of insulin aspart was higher than that of regular human insulin. The use of insulin aspart was thus shown to be cost-saving. Treatment of type 1 diabetes with insulin lispro was more effective, albeit more costly, than treatment with regular human insulin, which resulted in an incremental cost of Can$28 996 per quality-adjusted life-year (Table 4).
Table 4

Insulin glargine and insulin detemir generated more quality-adjusted life-years than did neutral protamine Hagedorn insulin, albeit at an increased cost. When compared with neutral protamine Hagedorn insulin, insulin glargine was associated with an incremental cost of Can$87 932, and insulin detemir with an incremental cost of Can$387 729, per quality-adjusted life-year (Table 4).
At a cost-effectiveness threshold of Can$50 000 per quality-adjusted life-year (Appendix 2, available at www.cmaj.ca/cgi/content/full/180/4/400/DC2), the probability that insulin aspart was more cost-effective than conventional insulin was 68.8% (Figure 2). The probability that each of the other analogues was more cost-effective than conventional insulin was 51.2% for insulin lispro, 42.5% for insulin glargine and 29.2% for insulin detemir (Figure 2).

Figure 2: Cost-effectiveness acceptability curves of insulin analogues for the treatment of type 1 and type 2 diabetes mellitus in adults, by treatment comparison. Costs are in 2007 Canadian dollars.
When fear of hypoglycemia was incorporated as a complication in the model, results from sensitivity analyses showed that insulin aspart remained cost-saving when compared with conventional insulin. However, the incremental cost per quality-adjusted life-year decreased to Can$1117 for insulin lispro, Can$17 225 for insulin glargine and Can$25 666 for insulin detemir. Conversely, when no difference in hemoglobin A1c between treatment comparators was assumed, the incremental costs per quality-adjusted life-year increased to Can$104 598 for insulin aspart, Can$673 041 for insulin lispro, Can$916 401 for insulin glargine and Can$1 958 928 for insulin detemir (Appendix 3, available at www.cmaj.ca/cgi/content/full/180/4/400/DC2). Results from other sensitivity analyses are reported elsewhere.10
Type 2 diabetes
Our model showed that both insulin aspart and insulin lispro were more effective than regular human insulin in the treatment of type 2 diabetes in adults who required insulin therapy. Both were also more costly. Treatment with insulin aspart resulted in an incremental cost of Can$22 488 per quality-adjusted life-year. Treatment with insulin lispro resulted in an incremental cost of Can$130 865 per quality-adjusted life-year (Table 4).
Insulin glargine was more effective, albeit more costly, than neutral protamine Hagedorn insulin, which resulted in an incremental cost of Can$642 994 per quality-adjusted life-year. Insulin detemir was more costly and less effective than neutral protamine Hagedorn insulin (Table 3).
At a cost-effectiveness threshold of Can$50 000 per quality-adjusted life-year, the probability that each of the insulin analogues was more cost-effective than conventional insulin was 52.3% for insulin aspart, 46.3% for insulin lispro, 25.1% for insulin glargine and 10.8% for insulin detemir (Figure 2).
Results from the sensitivity analyses showed that, when fear of hypoglycemia was included in the model, the incremental costs per quality-adjusted life-year decreased to Can$4429 for insulin aspart, Can$12 115 for insulin lispro, Can$73 989 for insulin glargine and Can$234 606 for insulin detemir. By contrast, when no difference in hemoglobin A1c between treatment comparators was assumed, the incremental costs per quality-adjusted life-year increased to Can$543 584 for insulin aspart, Can$80 445 for insulin lispro, Can$1 577 457 for insulin glargine and Can$882 155 for insulin detemir (Appendix 3). Results from other sensitivity analyses are reported elsewhere.11
Interpretation
Our results suggest that treatment with insulin analogues is associated with a reduction in diabetes-related complications (i.e., higher number of quality-adjusted life-years) relative to conventional insulins. However, benefits conferred and associated cost-savings do not offset the increased acquisition cost of insulin analogues. Consequently, compared to conventional insulin therapy, routine use of insulin analogues is likely to be associated with an incremental cost to third-party payers. For patients with type 1 diabetes, use of rapid-acting insulin analogues was associated with incremental costs per quality-adjusted life-year that were lower than widely cited cost-effectiveness thresholds49–51 (Appendix 2). Results for rapid-acting analogues in adults with type 2 diabetes, and for long-acting analogues in adults with type 1 diabetes, were less clear. In some instances, the incremental costs per quality-adjusted life-year were lower than widely cited cost-effectiveness thresholds; however, in others, they exceeded these thresholds. Findings for long-acting insulin analogues in adults with type 2 diabetes were more consistent. In these instances, incremental costs per quality-adjusted life-year exceeded widely cited cost-effectiveness thresholds.
Using our approach to economic modelling, we found that the cost-effectiveness of insulin analogues depended overall on the type of insulin analogue used and whether patients receiving the treatment had type 1 or type 2 diabetes. In a health care system without budgetary restraints, all medications would be accessible to all patients. However, if available resources are insufficient to support provision of all effective medications, the goal becomes one of achieving an optimal trade-off between allocating resources prudently and maximizing the overall health of the population.26–28 As in other instances in which new therapies are more expensive than traditional ones, the decision to fund insulin analogues seems to depend on how much a decision-maker is willing to pay per quality-adjusted life-year gained and on the availability of scarce resources.26–28 In light of the increasing prevalence of diabetes52,53 and increased acquisition costs for insulin analogues (particularly long-acting analogues), consideration must be given to the economic burden of providing these agents to all patients with diabetes.
It seems unlikely that routine use of insulin analogues, in particular long-acting analogues, in all patients with diabetes would represent an efficient use of finite health care resources. However, for some patients who are at high risk of hypoglycemia, the use of insulin analogues may prove to be cost-effective. Further research is needed to determine the cost-effectiveness of insulin analogues relative to conventional insulin in such patients.
Limitations
Limitations of our analyses warrant mention. First, our use of decision-modelling to estimate long-term diabetes-related outcomes is complex. For example, the model's projections are based on trials of short duration with highly selective populations who may differ from real-world patients with respect to age, comorbidities, adherence to treatment and concomitant medication use. Thus, the effectiveness of these therapies in clinical practice may differ from the efficacy results observed in clinical trials. Nevertheless, the use of modelling to inform policy decisions in health care settings is increasing.48,54
Second, hemoglobin A1c, a surrogate outcome, was used to forecast the occurrence of long-term diabetes-related complications. The validity of using the hemoglobin A1c test to forecast clinical outcomes has been debated, particularly for cardiovascular outcomes in patients with type 2 diabetes.55–58 The benefits conferred may thus be overstated. However, because hemoglobin A1c is routinely used in clinical practice as an indicator of treatment success, it likely represents the most acceptable measure of efficacy for these analyses.
Third, as shown by the acceptability curves for cost-effectiveness, there is considerable uncertainty around the results, and the base-case results should be interpreted with caution. For instance, because the acceptability curves for the cost-effectiveness of insulin aspart and insulin lispro plateau at about 50% for type 2 diabetes, it is equally likely that regular human insulin will be the most cost-effective strategy, at a lower acquisition cost.
Fourth, the model was very sensitive to changes in effect size of hemoglobin A1c and decreases in utility scores for fear of hypoglycemia. Others have reported similar sensitivities to small changes in these model parameters.35,59,60 For example, the incremental cost per quality-adjusted life-year estimated by Grima and colleagues59 for insulin glargine in patients with type 1 diabetes increased from Can$20 799 to Can$87 132 when effect sizes of hemoglobin A1c were decreased from 0.40% to 0.20%.59 When fear of hypoglycemia was included in an evaluation by the National Institute of Clinical Excellence in London, England, the incremental cost per quality-adjusted life-year for insulin glargine compared with neutral protamine Hagedorn insulin was reduced from £32 000 to £3500 for type 1 diabetes and from £120 000 to £32 500 for type 2 diabetes.60
The Center for Outcomes Research Diabetes Model6 accommodates fear of hypoglycemia by applying a chronic decrement to health-related quality-of-life scores in the conventional-insulin arm only. No decrement is applied to utility scores in the insulin-analogue arm. Hypoglycemia has been reported in patients using insulin analogues,8,10 albeit less frequently than in patients prescribed conventional human insulin. The results for fear of hypoglycemia from our sensitivity analyses may therefore be biased in favour of insulin analogues. Further research is needed to better quantify the impact of fear of hypoglycemia on health-related quality of life.
Fifth, we did not include treatment effects for weight loss in our analyses.9 This limitation, however, should not be overstated. Weight loss with insulin analogues is modest — less than 1 kg on average, which is unlikely to be considered a clinically important difference.11
Finally, results from the current analysis are specific to a Canadian primary care setting. It is uncertain whether they can be extrapolated to other countries, where the costs of insulin agents may vary.61
Our analyses also have a number of strengths. First, the ability of the Center for Outcomes Research Diabetes Model6 to predict long-term diabetes-related complications has been validated against published clinical and epidemiologic studies.7 Second, as recommended by the Washington Panel on Cost Effectiveness in Health and Medicine,29,30 we obtained our estimated decrements to utility scores from a catalogue of EuroQol-5D scores for the United States population.29,30 Third, our economic analyses adhere to the guidelines for the economic evaluation of health technologies of the Canadian Agency for Drugs and Technologies in Health.12 Finally, we derived our clinical inputs for the model from methodologically sound meta-analyses8–10 that reported robust results.
Conclusion
We found that the cost-effectiveness of insulin analogues depended on the type of insulin analogue and whether the patients receiving the treatment had type 1 or type 2 diabetes. With the exception of rapid-acting insulin analogues in type 1 diabetes, routine use of insulin analogues, especially long-acting analogues in type 2 diabetes, is unlikely to represent an efficient use of finite health care resources. In a companion paper (see page 385 of this issue),10 we report findings from a meta-analysis of clinical outcomes, the results of which serve to clarify further the optimal place of insulin analogues relative to conventional insulins in the management of diabetes in the Canadian health care system.
Supplementary Material
Acknowledgments
The authors thank Melissa Severn and Michelle Fiander for developing and implementing the literature search strategies, Karen M. Lee, Doug Coyle and Scott Klarenbach for economic advice, Denis Bélanger for helpful comments on the manuscript, and the Canadian Optimal Medication Prescribing and Utilization Service Expert Review Committee for identifying daily dosing regimens.
Footnotes
Une version française de ce résumé est disponible à l'adresse www.cmaj.ca/cgi/content/full/180/4/400/DC1
Funding: This research was supported through a financial contribution from Health Canada to the Canadian Optimal Medication Prescribing and Utilization Service, a service of the Canadian Agency for Drugs and Technologies in Health.
This article has been peer reviewed.
Contributors: Chris Cameron was involved in the conception and design, acquisition of input data and interpretation of results provided by IMS Health. He also drafted the manuscript and approved the final version to be published. Heather Bennett was involved with the conception and design of the project. She revised drafts critically for important content and approved the final version to be published.
Competing interests: None declared.
Correspondence to: Chris Cameron, Canadian Optimal Medication Prescribing and Utilization Service, Canadian Agency for Drugs and Technologies in Health, 600–865 Carling Ave., Ottawa ON K1S 5S8; fax 613 226-5392; chrisc@cadth.ca
REFERENCES
- 1.Hirsch IB. Insulin analogues. N Engl J Med 2005;352:174-83. [DOI] [PubMed]
- 2.The Ministry of Health and Long-Term Care. Drugs funded by Ontario Drug Benefit (ODB) program. [E-Formulary] Toronto (ON): The Ministry; 2008. Available: www.health.gov.on.ca/english/providers/program/drugs/odbf_eformulary.html (accessed 2007 Feb. 13).
- 3.PPS pharma publication buyers guide. Ontario ed. Moncton (NB): Total Pricing Systems; 2007.
- 4.Cavallucci S. The top 200. What's making waves in prescription sales. Pharm Pract 2006;22(12):44-9. Available: www.pharmacygateway.ca/pdfs/2006/12/ppractice_top200_dec06.pdf (accessed 2007 Oct. 2).
- 5.Hauber A, Gale EAM. The market in diabetes. Diabetologia 2006;49:247-52. [DOI] [PubMed]
- 6.Palmer AJ, Roze S, Valentine WJ, et al. The CORE Diabetes Model: projecting long-term clinical outcomes, costs and cost-effectiveness of interventions in diabetes mellitus (types 1 and 2) to support clinical and reimbursement decision-making. Curr Med Res Opin 2004;20(Suppl 1):S5-26. [DOI] [PubMed]
- 7.Palmer AJ, Roze S, Valentine WJ, et al. Validation of the CORE Diabetes Model against epidemiological and clinical studies. Curr Med Res Opin 2004;20(Suppl 1): S27-40. [DOI] [PubMed]
- 8.Canadian Optimal Medical Prescribing and Utilization Service. Optimal Therapy Report: Rapid-acting insulin analogues for the treatment of diabetes mellitus: meta-analyses of clinical outcomes. Update of the CADTH Technical report No. 87. Ottawa (ON): Canadian Agency for Drugs and Technologies in Health; 2008. Available: http://cadth.ca/media/compus/reports/compus_Rapid-Acting-Insulin-Analogues-Report_Clinical=Outcomes.pdf (accessed 2008 Apr. 9).
- 9.Canadian Optimal Medical Prescribing and Utilization Service. Optimal Therapy Report: Rapid-acting insulin analogues for the treatment of diabetes mellitus: meta-analyses of clinical outcomes. Update of the CADTH Technical report No. 92. Ottawa (ON): Canadian Agency for Drugs and Technologies in Health; 2008. Available: http://cadth.ca/media/compus/reports/compus_Long-Acting-Insulin-Analogs-Report_Clinical-Outcomes.pdf (accessed 2008 Apr. 9).
- 10.Singh SR, Ahmad F, Lal A, et al. Efficacy and safety of insulin analogues for the management of diabetes mellitus: a meta-analysis. CMAJ 2009;180:385-97. [DOI] [PMC free article] [PubMed]
- 11.Canadian Optimal Medical Prescribing and Utilization Service. Optimal Therapy Report: An economic evaluation of insulin analogues for the treatment of patients with type 1 and type 2 diabetes mellitus in Canada. Ottawa (ON): Canadian Agency for Drugs and Technologies in Health; 2008. Available: http://cadth.ca/media/compus/reports/compus_Economic_IA_Report.pdf (accessed 2008 Apr. 11).
- 12.Guidelines for the economic evaluation of health technologies: Canada. 3rd ed. Ottawa (ON): Canadian Agency for Drugs and Technologies in Health; 2006. Available: www.cadth.ca/media/pdf/186_EconomicGuidelines_e.pdf (accessed 2007 Feb. 9).
- 13.O'Reilly D, Hopkins R, Blackhouse G, et al. Development of an Ontario Diabetes Economic Model (ODEM) and application to a multidisciplinary primary care diabetes management program. Hamilton (ON): Program for Assessment of Technology in Health (PATH); 2006. Available: www.path-hta.ca/diabetes.pdf (accessed 2007 Jul. 12).
- 14.Hart HE, Redekop WK, Berg M, et al. Factors that predicted change in health-related quality of life were identified in a cohort of diabetes mellitus type 1 patients. J Clin Epidemiol 2005;58:1158-64. [DOI] [PubMed]
- 15.Ray JA, Valentine WJ, Secnik K, et al. Review of the cost of diabetes complications in Australia, Canada, France, Germany, Italy and Spain. Curr Med Res Opin 2005;21:1617-29. [DOI] [PubMed]
- 16.Manns B, Tonelli M, Shrive F, et al. Sevelamer in patients with end-stage renal disease: a systematic review and economic evaluation. Ottawa (ON): Canadian Agency for Drugs and Technologies in Health; 2006. Available: www.cadth.ca/media/pdf/HTA_349_sevelamer_tr_e.pdf (accessed 2007 Jul. 20).
- 17.Manns B, Johnson JA, Taub K, et al. Quality of life in patients with end-stage renal disease over time: the impact of dialysis modality and other important determinants [working paper 02-05]. Edmonton (AB): Institute of Pharmaco-Economics; 2002 Available: www.ihe.ca/documents/2002-05paper.pdf (accessed 2007 Jul 23).
- 18.Health costing in Alberta: 2006 annual report. Edmonton (AB): Alberta Health and Wellness; 2006. Available: www.health.gov.ab.ca/resources/publications/Health_Costing_2006.pdf (accessed 2007 Feb. 14).
- 19.Caro J, Migliaccio-Walle K, Ishak KJ, et al. The morbidity and mortality following a diagnosis of peripheral arterial disease: long-term follow-up of a large database. BMC Cardiovasc Disord 2005;5:14. [DOI] [PMC free article] [PubMed]
- 20.O'Brien JA, Patrick AR, Caro JJ. Cost of managing complications resulting from type 2 diabetes mellitus in Canada. BMC Health Serv Res 2003;3:7. [DOI] [PMC free article] [PubMed]
- 21.The effect of intensive treatment of diabetes on the development and progression of long-term complications in insulin-dependent diabetes mellitus. The Diabetes Control and Complications Trial Research Group. N Engl J Med 1993;329:977-86. [DOI] [PubMed]
- 22.Nathan DM, Cleary PA, Backlund JY, et al. Intensive diabetes treatment and cardiovascular disease in patients with type 1 diabetes. N Engl J Med 2005;353:2643-53. [DOI] [PMC free article] [PubMed]
- 23.Ogden CL, Fryar CD, Carroll MD, et al. Mean body weight, height, and body mass index, United States 1960–2002. Hyattsville (MD): US Department of Health and Human Services, US Centers for Disease Control and Prevention, National Center for Health Statistics; 2004. Available: www.cdc.gov/nchs/data/ad/ad347.pdf (accessed 2007 July 10).
- 24.National Health and Nutrition Examination Survey 1999–2000. Hyattsville (MD): National Centre for Health Statistics; 2007. Available: www.cdc.gov/nchs/data/nhanes/spq-di.pdf (accessed 2008 Nov. 26).
- 25.Consumer price index. The Daily. Ottawa (ON). Statistics Canada; 2008. Available: www.statcan.ca/Daily/English/080219/d080219a.htm (accessed 2008 Jun. 20).
- 26.Drummond MF, Sculpher MJ, Torrance GW, et al. Methods for the economic evaluation of health care programmes. 3rd ed. Oxford (UK): Oxford University Press; 2005.
- 27.Berger ML, Bingefors K, Hedblom EC, et al., editors. Health care cost, quality, and outcomes: ISPOR book of terms. Lawrenceville (GA): International Society for Pharmacoeconomics and Outcomes Research; 2003.
- 28.EQ-5D: a standardised instrument for use as a measure of health outcome. Rotterdam (The Netherlands): Euroqol; 2007. Available: www.euroqol.org (accessed 2008 Nov. 27).
- 29.Sullivan PW, Ghushchyan V. Preference-based EQ-5D index scores for chronic conditions in the United States. Med Decis Making 2006;26:410-20. [DOI] [PMC free article] [PubMed]
- 30.Sullivan PW, Lawrence WF, Ghushchyan V. A national catalog of preference-based scores for chronic conditions in the United States. Med Care 2005;43:736-49. [DOI] [PubMed]
- 31.Feeny D. As good as it gets but good enough for which applications? Med Decis Making 2006;26:307-9. [DOI] [PubMed]
- 32.Coffey JT, Brandle M, Zhou H, et al. Valuing health-related quality of life in diabetes. Diabetes Care 2002;25:2238-43. [DOI] [PubMed]
- 33.Calculating the US population-based EQ-5D index score. Rockville (MD): Agency for Healthcare Research and Quality; 2005. Available: www.ahrq.gov/rice/EQ5Dscore.htm (accessed 2007 Oct. 10).
- 34.Understanding emergency department wait times: How long do people spend in emergency departments in Ontario? Ottawa (ON): Canadian Institute for Health Information; 2007. Available: www.cihi.ca/cihiweb/en/downloads/emergency_department_wait_times_e.pdf (accessed 2008 Jan. 18).
- 35.PHARMAC responds on long-acting insulin analogues. N Z Med J 2005;118:U1716. [PubMed]
- 36.Home PD, Hallgren P, Usadel KH, et al. Pre-meal insulin aspart compared with pre-meal soluble human insulin in type 1 diabetes. Diabetes Res Clin Pract 2006;71:131-9. [DOI] [PubMed]
- 37.Henderson JN, Allen KV, Deary IJ, et al. Hypoglycaemia in insulin-treated type 2 diabetes: frequency, symptoms and impaired awareness. Diabet Med 2003;20:1016-21. [DOI] [PubMed]
- 38.Ahern J, Tamborlane WV. Steps to reduce the risks of severe hypoglycemia. Diabetes Spectr 1997;10:39-41.
- 39.Hypoglycaemia. In: Diabetes network information. [Web site of NHS Dumfries & Galloway]. Available: www.dgdiabetes.scot.nhs.uk/icp/icptype1/hypos.shtml (accessed 2008 Jan. 18).
- 40.Haak T, Tiengo A, Draeger E, et al. Lower within-subject variability of fasting blood glucose and reduced weight gain with insulin detemir compared to NPH insulin in patients with type 2 diabetes. Diabetes Obes Metab 2005;7:56-64. [DOI] [PubMed]
- 41.Currie CJ, Morgan CL, Poole CD, et al. Multivariate models of health-related utility and the fear of hypoglycaemia in people with diabetes. Curr Med Res Opin 2006;22:1523-34. [DOI] [PubMed]
- 42.Davis RE, Morrissey M, Peters JR, et al. Impact of hypoglycaemia on quality of life and productivity in type 1 and type 2 diabetes. Curr Med Res Opin 2005;21:1477-83. [DOI] [PubMed]
- 43.Leiter LA, Yale JF, Chiasson JL, et al. Assessment of the impact of fear of hypoglycemic episodes on glycemic and hypoglycemia management. Can J Diabetes 2005;29:186-92.
- 44.Levy RA, Christensen T, Bavinton H, et al. Estimating health related quality of life from hypoglycemia elicited from non-diabetic respondents in Canada [abstract no. 1205-P]. American Diabetes Association Annual Meeting; 2007 Jun 22-26; Chicago.
- 45.Matza LS, Boye KS, Yurgin N, et al. Utilities and disutilities for type 2 diabetes treatment-related attributes. Qual Life Res 2007;16:1251-65. [DOI] [PubMed]
- 46.Briggs AH, Wonderling DE, Mooney CZ. Pulling cost-effectiveness analysis up by its bootstraps: a non-parametric approach to confidence interval estimation. Health Econ 1997;6:327-40. [DOI] [PubMed]
- 47.Briggs AH, Gray AM. Handling uncertainty in economic evaluations of healthcare interventions. BMJ 1999;319:635-8. [DOI] [PMC free article] [PubMed]
- 48.Briggs A, Claxton K, Sculpher M. Decision modelling for health economic evaluation [Handbooks in Health Economic Evaluation series]. Toronto (ON): Oxford University Press; 2006.
- 49.Laupacis A, Feeny D, Detsky AS, et al. How attractive does a new technology have to be to warrant adoption and utilization? Tentative guidelines for using clinical and economic evaluations. CMAJ 1992;146:473-81. [PMC free article] [PubMed]
- 50.Hirth RA, Chernew ME, Miller E, et al. Willingness to pay for a quality-adjusted life-year: in search of a standard. Med Decis Making 2000;20:332-42. [DOI] [PubMed]
- 51.Rawlins MD, Culyer AJ. National Institute for Clinical Excellence and its value judgments. BMJ 2004;329:224-7. [DOI] [PMC free article] [PubMed]
- 52.Ohinmaa A, Jacobs P, Simpson S, et al. The projection of prevalence and cost of diabetes in Canada: 2000 to 2016. Can J Diabetes 2004;28(2):1-8.
- 53.Wild S, Roglic G, Green A, et al. Global prevalence of diabetes: estimates for the year 2000 and projections for 2030. Diabetes Care 2004;27:1047-53. [DOI] [PubMed]
- 54.Briggs A, Sculpher M. An introduction to Markov modelling for economic evaluation. Pharmacoeconomics 1998;13:397-409. [DOI] [PubMed]
- 55.Lassere MN, Johnson KR, Boers M, et al. Definitions and validation criteria for biomarkers and surrogate endpoints: development and testing of a quantitative hierarchical levels of evidence schema. J Rheumatol 2007;34:607-15. [PubMed]
- 56.Ewart RM. The case against aggressive treatment of type 2 diabetes: critique of the UK prospective diabetes study. BMJ 2001;323:854-8. [DOI] [PMC free article] [PubMed]
- 57.Rosen CJ. The rosiglitazone story — lessons from an FDA Advisory Committee meeting. N Engl J Med 2007;357:844-6. [DOI] [PubMed]
- 58.Richter B, Bandeira-Echtler E, Bergherhoff K, et al. Rosiglitazone for type 2 diabetes mellitus. Cochrane Database Syst Rev 2007;(3)CD006063. [DOI] [PMC free article] [PubMed]
- 59.Grima DT, Thompson MF, Sauriol L. Modelling cost effectiveness of insulin glargine for the treatment of type 1 and 2 diabetes in Canada. Pharmacoeconomics 2007;25:253-66. [DOI] [PubMed]
- 60.Guidance on the use of long-acting insulin analogues for the treatment of diabetes-insuling glargine [technology appraisal guidance no 53]. London (UK): National Institute for Clinical Excellence (NICE); 2002. Available: www.nice.org.uk/download.aspx?o=TA053guidance (accessed 2006 Sep. 28).
- 61.Sculpher MJ, Pang FS, Manca A, et al. Generalisability in economic evaluation studies in healthcare: a review and case studies. Health Technol Assess 2004;8:iii-iv, 1-192. [DOI] [PubMed]
Associated Data
This section collects any data citations, data availability statements, or supplementary materials included in this article.