

Abstract
Evolutionary change in morphological features must depend on architectural reorganization of developmental gene regulatory networks (GRNs), just as true conservation of morphological features must imply retention of ancestral developmental GRN features. Key elements of the provisional GRN for embryonic endomesoderm development in the sea urchin are here compared with those operating in embryos of a distantly related echinoderm, a starfish. These animals diverged from their common ancestor 520-480 million years ago. Their endomesodermal fate maps are similar, except that sea urchins generate a skeletogenic cell lineage that produces a prominent skeleton lacking entirely in starfish larvae. A relevant set of regulatory genes was isolated from the starfish Asterina miniata, their expression patterns determined, and effects on the other genes of perturbing the expression of each were demonstrated. A three-gene feedback loop that is a fundamental feature of the sea urchin GRN for endoderm specification is found in almost identical form in the starfish: a detailed element of GRN architecture has been retained since the Cambrian Period in both echinoderm lineages. The significance of this retention is highlighted by the observation of numerous specific differences in the GRN connections as well. A regulatory gene used to drive skeletogenesis in the sea urchin is used entirely differently in the starfish, where it responds to endomesodermal inputs that do not affect it in the sea urchin embryo. Evolutionary changes in the GRNs since divergence are limited sharply to certain cis-regulatory elements, whereas others have persisted unaltered.
Evolution and development are both manifestations of the heritable genomic regulatory programs that determine how the morphological characters of each species are built. Regulatory control systems include large numbers of genes encoding DNA-sequence-specific transcription factors, as well as downstream genes, among the most important of which encode components of intercellular signaling systems. The role of the developmental control machinery is to organize the progressive spatial disposition of gene regulatory states as the embryo develops. Its form is that of a gene regulatory network (GRN), the architecture of which is determined by causal cis-regulatory interactions. The GRN specifies the cells where these states transiently exist and the batteries of downstream genes they will express. A syllogism leads to the evolutionary process by which morphological characters arise and diversify: the body plan of each taxon at each developmental stage consists of conserved plus novel morphological characters (with respect to its phylogenetic relatives), and morphological characters depend causally on the operations of developmental GRNs; therefore, evolutionary conservation and novelty in form must devolve from retained and novel features of GRN architecture (1, 2). However, until recently, comparative study of GRN architecture was a prescription that could not be followed, because developmental GRNs were not experimentally accessible. This situation is now beginning to change, and GRNs that underlie developmental processes in several different systems are being proposed (e.g., refs. 3-8). Here, elements of the embryonic GRN operating in the early starfish embryo were determined. These elements were compared with the equivalent portions of the provisional GRN for endomesoderm specification in the pregastrular sea urchin embryo (4, 5, 9-11), to attain a direct assessment of change and conservation at the GRN level since the divergence of these distantly related echinoderms.
The five extant echinoderm classes are the crinoids, the starfish (asteroids), the brittle stars (ophiuroids), the sea cucumbers (holothuroids), and the sea urchins (echinoids). The last four are all free-living, benthic animals, known collectively as the eleutherozoans (the crinoids, generally considered the most basal forms, are primitively sessile and stalked, although many modern species are mobile). Within the eleutherozoans, the starfish and ophiuroids are sister groups, more closely related to one another, as are the holothuroids and sea urchins (12, 13). The oldest fossils that can be restricted to an echinoid/holothuroid stem group, date to the Middle Ordovician Period, and the oldest asteroid-like forms to the Lower Ordovician Period (12, 14). The last common ancestor of sea urchins and starfish therefore, can have lived no later than the Lower Ordovician Period, and was perhaps even of Middle or Upper Cambrian Period vintage; i.e., it dates to somewhere in the range 520-480 million years ago (14-16). In terms of genomic divergence 500 million years is a very long time: for instance, in comparisons of starfish and sea urchin DNA sequence around orthologous gene regions, the exons are recognizable as patches of conserved sequence, but, in our experience, the cis-regulatory elements are never so, even when the genes are similarly regulated. On the other hand, at about one-tenth of this evolutionary distance in real time, interspecies sequence comparison can almost always be used to reveal cis-regulatory elements in the sea urchin Strongylocentrotus purpuratus (17, 18). Because there are no appropriate precedents to reference, it is a priori a fascinating question as to how conserved developmental regulatory linkages and GRN architecture across 500 million years of evolutionary divergence might be.
Specific subregions of the S. purpuratus endomesoderm GRN have been singled out for experimental comparison in the starfish Asterina miniata (to perceive the position of the genes studied in the context of the whole sea urchin GRN, see our current web site version, which can be accessed at http://sugp.caltech.edu/endomes). Central elements that control endoderm specification in the sea urchin were chosen on the a priori basis that this choice might provide a test of conservation of GRN architecture over these immense periods of time, because the process of endoderm formation is at least superficially similar in the two species (Fig. 1). The major difference between asteroid and echinoid larvae is that the latter produces a skeleton during embryogenesis, on which larval shape depends, whereas asteroid embryos and larvae entirely lack this structure. In the “modern” sea urchins or euechinoids, such as S. purpuratus, the skeletogenic cell lineage descends from micromeres segregated early in cleavage (Fig. 1). Their mesenchymal descendants generate skeletal rods of species-specific form late in embryogenesis. There is no micromere lineage in the asteroid embryos, nor any other skeletogenic cells in the embryo. The remainder of the endomesodermal fate map of echinoid and asteroid embryos is basically similar (Fig. 1).
Fig. 1.

Fate maps showing selected stages of starfish A. miniata (Left) and sea urchin S. purpuratus (Right) development. (i) Surface views from the vegetal (posterior) pole of a sixth cleavage S. purpuratus embryo (Right) and a blastula stage A. miniata embryo (Left). (ii-iv) Lateral optical sections; animal pole (Upper), vegetal pole (Lower), which are color-coded to display fate. Blastula (ii), gastrula (iii), and early larval stages from both taxa (iv). In iv, the oral side is to right and aboral to left in each drawing. Blue with pink stippling marks the endomesodermal veg2 lineage of S. purpuratus, which resolves into endodermal (blue) and mesodermal (pink) by seventh cleavage (i), and A. miniata before blastula stage (ii). The mesoderm lineage can be further subdivided into coelomic (purple) and other mesodermal (pink) cell types. The echinoid-specific, micromere-derived skeletogenic lineage is shown throughout in red.
In the sea urchin, the krox gene is activated during cleavage in endomesodermal founder cells (19), and during the blastula stage, it is locked into a reinforcing feedback loop with certain cis-regulatory elements of the otx gene (4, 5). The gatae gene is soon also engaged in this loop, requiring otx expression for function, and it, in turn, positively crossregulates otx. These GRN linkages are encoded directly in the cis-regulatory DNA. The significance of this three-gene circuit is that it drives development forward, generating a stable endomesodermal regulatory state, which is independent of the transient spatial cues that initiate krox activation and endomesoderm specification (2, 4). Furthermore, it ensures gatae expression in the future endoderm. The gatae gene is a major regulator of many other endodermal control genes (4, 5), among which are foxa and brachyury (bra), two additional genes included in the comparison with the starfish.
The tbrain (tbr) gene was also studied in A. miniata. In sea urchins, this gene is activated exclusively in the micromere-derived skeletogenic cells soon after this lineage is born (9, 20, 21). It is regulated by other micromere-specific control genes, e.g., pmar1 (9), and, in turn, it drives expression of downstream larval skeletogenic structural genes (5, 9). In contrast, the tbr ortholog from the starfish Asterina pectinifera is expressed across the entire vegetal plate, i.e., in the prospective mesoderm plus endoderm (22).
Materials and Methods
Cloning and Characterization of A. miniata Orthologs. A. miniata orthologs to the S. purpuratus krox, otx, bra, foxa, gatae, and tbr mRNAs were isolated. The cloning and spatial expression of the A. miniata krox, gatae, and otx transcripts have been published (23-25). Degenerate RT-PCR was used to obtain fragments of the A. miniata foxa and bra orthologs, which were then random-primed radiolabeled and hybridized to a late-gastrula arrayed cDNA library under high-stringency conditions (26). Sequences of the inserts from positive clones were overlapped to provide a contiguous sequence corresponding to foxa or bra. Clones corresponding to a related tbox gene, identified as the A. miniata ortholog of tbr, were also identified and collated from this library screen.
Phylogenetic analyses were carried out to ensure that the genes selected were indeed orthologous to those of the S. purpuratus GRN (see Supporting Materials and Methods, which is published as supporting information on the PNAS web site, and refs. 23-25). The localization of the respective gene products was determined by using whole-mount in situ hybridization (WMISH) as described in ref. 25 and detailed in Supporting Materials and Methods.
Perturbation of Gene Expression in the Starfish Embryo and Construction of the GRN for Endomesodermal Specification. Morpholino-substituted antisense oligonucleotide (MASO) technology (Gene Tools, Philomath, OR) was used to perturb the function of gatae, krox, foxa, and tbr by inhibiting translation of the endogenous protein (for details, see Supporting Materials and Methods). The targets of Otx were suppressed by using a dominant Engrailed (Eng) repressor strategy, as described (25). Effects of specific perturbations of gatae, otx, krox, and foxa genes on the level of transcripts of all of the genes of the comparison set were measured by quantitative PCR (QPCR; for details, see Supporting Materials and Methods). The measurements were parallel in all respects to those done earlier in determining the positions of those same genes in the sea urchin GRN (4, 5, 9). In assessing the results, it was conservatively assumed on the basis of the extensive sea urchin GRN data, that an effect on gene expression is biologically significant only if the experimental transcript level is >3-fold different from that of the control as a result of the perturbation.
Results
Spatial Patterns of Gene Expression in A. miniata. For krox, bra, otx, gatae and foxa, the spatial expression patterns turned out to be very similar to the respective patterns produced by their orthologs in S. purpuratus (see data in Supporting Materials and Methods, and Figs. 7-9, which are published as supporting information on the PNAS web site, and refs. 23-25).
In contrast, the tbr gene is expressed in a completely different way in A. miniata and S. purpuratus embryos. In sea urchin embryos, tbr is transcribed in the skeletogenic lineage alone (20, 21), whereas in A. miniata, as in A. pectinifera (22), tbr is expressed both in the coelomic mesoderm and the endoderm. Thus, at blastula stage, tbr transcripts are present in all of the cells of the vegetal plate, at early to mid-gastrula stage in the mesodermal bulb at the anterior end of the archenteron, and in the wall of the growing gut (see Fig. 10, which is published as supporting information on the PNAS web site).
Perturbations. The QPCR measurements of the effects of specific perturbations of otx, krox, gatae, or foxa on the level of transcripts of all of the genes of the comparison set (Fig. 2) indicate the intergenic requirements for normal regulatory gene expression. Quantitative results are summarized in Fig. 2 (for numerical details, see Table 1, which is published as supporting information on the PNAS web site). For normal levels of bra and otxβ-a transcripts to be produced, Gatae (Fig. 2C) and the Krox transcription factor (Fig. 2B) need to be present. Gatae is also required for normal foxa expression, and for the transcription of its own mRNA as well (Fig. 2C). On the other hand, expression of neither krox itself, nor gatae, nor foxa are strongly affected by lack of the Krox transcription factor (Fig. 2B). Introduction of the Otx-Eng obligate repressor causes >5-fold depression of transcript levels of all of these genes, i.e., of bra, of itself (i.e., otxβ-a), of krox, of gatae, and of foxa (Fig. 2 A). Note also that foxa acts to repress, not activate, all of its target genes, i.e., gatae, foxa, and bra, because, when translation of its mRNA is blocked, the amount of transcript of the target gene rises (Fig. 2D).
Fig. 2.

Quantitative effects on expression levels of A. miniata transcription factors after various specific perturbations of gene expression. Zygotes were injected with either mRNA encoding an Otx-Eng fusion (A; ref. 25) or MASOs that block the translation of krox (B), gatae (C), or foxa (D) mRNA. The abundances of various transcripts in the experimental embryos are compared with their levels in similarly injected controls of the same batch of eggs and are indicated as ΔCT (left ordinate), and as the corresponding fold change in transcript abundance (right ordinate). ΔCT gives the difference between control and experimental samples in the number of PCR cycles required to attain threshold. Significantly affected transcripts (ΔCT > 1.6, i.e., fold change of more than ≈3) are shown as filled bars. Stars indicate a significant difference with respect to S. purpuratus embryos (see text). All observations shown refer to 19-24 h blastulae except the two open bars in D, which display the later (28-32 h) effect of αfoxa MASO on bra and tbr expression. For individual measurements, see Table 1.
Starfish GRN Elements. Assembling the data on the patterns of expression of the six genes examined with the results of the perturbation analysis (Fig. 2), the regulatory linkages among these genes can be portrayed as in Fig. 3. Those linkages that are different in the two species are indicated as dashed lines within the GRN for the organism in which they were detected. For this comparison, it is irrelevant whether the linkages indicated are direct cis-regulatory interactions or are indirect (i.e., through another, unknown regulatory factor): the dashed lines indicate only that the response to a given perturbation (Fig. 2) is different in the two systems. There is, in any case, accumulating evidence from other cis-regulatory analyses on these same genes that the interactions in this region of the S. purpuratus GRN are likely to be direct. Fig. 3 shows that whereas linkages at the otx, foxa, and bra genes are exactly the same in the two species, the krox gene in the starfish lacks an autorepression element seen in the sea urchin, and the gatae control elements are significantly different in the two species. The most conspicuous difference in these GRNs concerns the regulation of tbr. Tbr expression is positively regulated by the endodermal activators otx and gatae in the starfish, but in the sea urchin, perturbation of these inputs has no effect at all on tbr expression (Figs. 3 and 4A). Furthermore, tbr expression is required for endomesoderm formation in the starfish: when the translation of tbr message is blocked in starfish embryos, the entire archenteron fails to develop (Fig. 4 B and C). In S. purpuratus, blockade of tbr expression with αtbr MASO has no effect on the level of key endodermal regulators, such as Gatae and Eve (see the QPCR web site, which can be accessed at http://sugp.caltech.edu/endomes). Neither in our hands does it interfere at all with archenteron formation, although it blocks skeletogenesis, which is contrary to a recent report from work completed on another species (20).
Fig. 3.

A diagram of inferred architecture of the GRNs in S. purpuratus (A) and A. miniata (B). Data for A. miniata depend on the observations summarized in Figs. 2 and 6; for data for S. purpuratus, see ref. 5. Short horizontal lines represent the cis-regulatory region(s) controlling expression of the gene that is named beneath. Inputs to each cis-regulatory region are either positive (arrow) or negative (bar). Connections between genes were determined through various perturbation assays, and, in some cases in S. purpuratus, have been verified by direct cis-regulatory analyses. The genes krox, otx, bra, foxa, and gatae are all expressed within the endomesoderm and are required for its correct specification. In S. purpuratus, the tbr gene, its downstream target genes, and its upstream regulators are all expressed in the micromere/skeletogenic lineage and are necessary for its normal specification. The tbr gene in A. miniata is expressed within the endomesoderm and is required for its correct specification. Dashed lines indicate a regulatory connection observed in A. miniata but not present in S. purpuratus, or vice versa. For instance, the krox gene is self-regulating only in S. purpuratus, and Otx regulates tbr only in A. miniata. The positive regulatory feedback loops among krox, otx, and gatae that are present in both taxa are bold. Thinner lines, emanating from foxa, represent regulatory connections that exist only in later development (28-32 h in A. miniata).
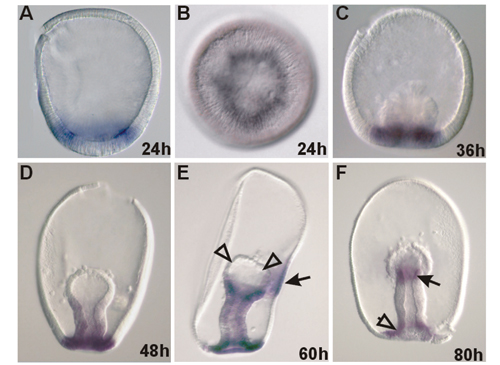
Fig. 4.

The gene tbr is regulated by other endomesodermal transcription factors in the starfish A. miniata, but not in the sea urchin S. purpuratus. (A) Comparison of the effects on tbr transcript abundance caused by perturbations of otx or gatae expression in sea urchins and starfish. Transcript levels consequent on perturbations are represented as in Fig. 2. Light gray and solid bars represent ΔCT (left ordinate) or fold change (right ordinate) in tbr expression after the indicated perturbation in sea urchins and starfish, respectively. The significance of the difference in ΔCT between sea urchin and starfish was determined by using a t test, and the resultant P values are provided. Error bars, ±SE. Sea urchin data can be accessed at http://sugp.caltech.edu/endomes. (B and C) Expression of tbr is required for endomesodermal specification in starfish. A. miniata (48 h) zygotes were injected with either 1 mM of a random sequence (control) MASO (B) or 600 μM αTbr MASO (C). The archenteron forms correctly in B but fails to develop when levels of Tbr are diminished in C.
The Architectural GRN Features Predict Specific Patterns of Gene Expression. Analyses of the expression patterns of some of the genes in the perturbed starfish embryos provide confirmation of the GRN linkages shown in Fig. 3, and also illustrate how gene expression and function have altered in consequence of GRN evolution. For example, an inference from the crossregulation between foxa and gatae (Fig. 3) is that the temporal expression pattern of both foxa and gatae should oscillate, and with similar periodicity. This result indeed turns out to be the case (Fig. 5). It can also be predicted that as foxa and gatae have the same inputs (they are both activated by otx and gatae and are repressed by foxa), they should both be expressed in the same way at this stage of development. This finding too, is true (Fig. 6 A and F). Furthermore, αfoxa MASO experiments demonstrate that the function of Foxa is to prevent both itself (Fig. 6F; compare with Fig. 6I) and gatae (Fig. 6A; compare with Fig. 6D) from being expressed in the central part of the vegetal plate, which is fated to become mesoderm. The measurements of Fig. 4A imply that tbr, which is activated by Gatae and Otx, but is not normally repressed by Foxa in 19-24 h blastulae, will be expressed across the entire vegetal plate. Again, this prediction is confirmed (Fig. 6 G and L). Fig. 6 includes several half-embryo experiments in which the perturbation reagents had been injected into one of the first two blastomeres, rather than into the zygote. The plane of bilateral symmetry of the embryo arises from the first cleavage plane in starfish, and, thus, the half-embryo that results from the uninjected blastomere provides an internal control. These experiments confirm visually the requirement of gatae for endomesoderm specification (Fig. 6C; compare with Fig. 6B), its autoregulation (Fig. 6E), and the control of tbr expression in the endomesoderm by the Otx and Gatae regulators (Fig. 6 J and K; compare with Fig. 6 G, H, and L).
Fig. 5.

The relative abundance of gatae and foxa transcripts in A. miniata embryos at various times from fertilization (dark gray squares represent data points for gatae, and light gray diamonds represent data points for foxa) were determined by using QPCR. Bars, ±SE.
Fig. 6.

Visualization of regulatory interactions in perturbed A. miniata embryos by using WMISH. Views are lateral (A-F, I, and L) or from vegetal pole (G, H, J, and K). Embryos (except C) are stained after WMISH to reveal the localization of the transcript indicated at the bottom on the right. Zygotes were injected with 600 μM αfoxa MASO (D and I), or one of the first two blastomeres was injected with 1 mM αgatae MASO (C, E, and K), or 0.4 pg/pl otx-eng mRNA (J), as indicated at the top on the right. (A and B) Control gatae WMISH patterns: A, normal blastula; B, normal gastrula. (C) Blastula grown from a zygote injected with an mRNA of an in-frame fusion corresponding to the 5′ gatae sequence (containing the gatae MASO target site) with GFP, followed by an injection of 1 mM αgatae MASO into one blastomere at the two-cell stage. The loss of GFP expression from the half-embryo that results from this injected blastomere demonstrates that the αgatae MASO effectively binds to its target sequence and blocks translation in vivo. Gastrulation fails to initiate in this half-embryo. Zygotes injected with both this mRNA fusion and 1 mM control (random sequence) MASO expressed GFP throughout (data not shown). (D) Effect of blocking Foxa translation on gatae expression at blastula stage (compare A). (E) Effect of blocking Gatae translation on expression of gatae gene at gastrula stage (compare left and right halves). (F) Normal foxa expression at blastula stage. (G and H) Normal tbr expression viewed from vegetal pole of blastula (G) or gastrula (H). (I) Effect of αfoxa MASO on foxa RNA expression at blastula stage (compare with F). (J) Effect of Otx-Eng fusion on tbr expression at blastula stage (compare with G). (K) Effect of αgatae MASO on tbr expression at gastrula stage (compare with H). (L) Normal tbr expression in gastrula, viewed laterally. Double-headed arrows connect the relevant control embryos provided for comparison with its perturbed partner; each such comparison confirms a regulatory connection, which was inferred from the QPCR data summarized in Figs. 2 and 5.
Discussion
Architectural Features of the GRN Conserved for 500 Million Years. The most remarkable homology between the starfish and sea urchin GRN elements of Fig. 3 is the presence of the identical three-gene reinforcing loop. The importance of this architectural feature evidently cannot be overstated, in that it has been conserved in two independently evolving lineages for a half a billion years. Its preservation points to the essential role of the gatae gene in both organisms. The consequences of the loop are first to set up a stabilizing positive-feedback relation between krox and otx genes, rendering the endodermal regulatory state independent of the transient initial inputs (2, 4), later to activate gatae, and use its product to further reinforce the stabilization circuitry. In S. purpuratus, the gatae gene is an essential, specific endodermal driver for many other regulatory genes (2, 4, 5), among which, as also shown here for the starfish, are the foxa and bra genes. Members of the gata family of transcriptional regulatory genes are specifically required for gut development across the bilaterians (6, 27, 28). Ensuring endodermal gatae expression may thus be one of the more important early functions of this ancient feature of the endomesodermal specification GRN.
Several other detailed features that eventuate from this stabilization circuitry have also survived since divergence from the common eleutherozoan ancestor. For example, krox expression is required for bra, but not foxa, in both the starfish and sea urchin. Similarly, in both systems, the Otx-Eng protein essentially eliminates expression of bra, gatae, krox, foxa, and of one form of otx transcript as well (Fig. 2). Another shared feature of the starfish and sea urchin GRNs is their common usage of the foxa gene as a spatial repressor.
This evidence for shared conserved GRN features goes far beyond the observations commonly used to support conserved evolutionary roles, namely, apparently similar patterns of gene expression and morphology of knockout phenotypes (which, for all these genes, not surprisingly, includes arrest or inhibition of gastrulation and gut development). Whereas these kinds of phenomenological observation are necessary first steps, they can provide only weak evidence for conservation of function, compared with the direct identification of GRN linkages. The criterion for true evolutionary homology in apparently similar processes is that they descend from a common ancestor that used the same process. GRN level analysis provides a means to test rigorously for such homologies. The sheer number of functional linkages shared between starfish and sea urchin GRNs essentially precludes convergence as an alternative explanation.
Architectural GRN Evolution. Several architectural features that act downstream of the krox-otx-gatae stabilization loop have evolved since the divergence of the free-living echinoderms. For example, the starfish krox gene does not autoregulate (Fig. 2B), while the sea urchin krox gene does; the starfish gatae gene does autoregulate (Fig. 2C), while the sea urchin gatae gene does not (5), and gatae in A. miniata is repressed by foxa (Fig. 2C), whereas this is not observed in S. purpuratus (5). These differences illustrate evolutionary change in the GRN termini, i.e., the predicted cis-regulatory elements. That such changes occur, while the three-gene feedback loop has survived exactly in both lineages, emphasizes the functional importance of that conservation.
The tbr gene is used in the starfish embryo in an entirely different way than in the sea urchin embryo. Instead of the skeletogenic functions executed by the tbr regulator in the micromere lineages of sea urchins (9, 20, 21), the tbr gene is required for archenteron formation in the starfish embryo, and its expression is under the control of endodermal regulators (otx and gatae), which do not affect it in the least in sea urchin embryos (Fig. 4). The use of tbr for endomesodermal specification in starfish embryogenesis is likely the pleisiomorphic state, because a skeletogenic micromere lineage in the embryo is a relatively recent echinoid invention (29), and tbr orthologs from a sea cucumber (30) and a hemichordate (31) are also expressed within the vegetal pole region that will develop endomesoderm. The genetic regulatory equipment used to produce the calcite biomineral endoskeleton of echinoderms, however, is likely very ancient. The production of an adult calcite skeleton is a phylotypic character of echinoderms, which is already evident in the earliest Lower Cambrian Period. It is not known whether tbr is used in adult skeletogenic regulatory circuits, but it is the case, that in sea urchins, at least some of the same skeletogenic differentiation proteins that are constituents of embryo spicules are also found in adult spines (32). In the embryo, some genes encoding such proteins require tbr expression for their activity (4, 9). Therefore, it is reasonable to imagine that in the recent evolution of the echinoid embryonic skeletal system, some aspects of the adult skeletogenic GRN were readdressed to the micromere lineage. Testable alternatives are that the tbr gene could have been (and could still be) part of this originally adult skeletogenic subsystem in starfish and sea urchins, or that it was added in as the link between the micromere specification system (9) and the skeletogenic differentiation subsystem.
Comparative GRN analysis provides incisive insights into the evolutionary processes that affect body plan at the DNA level. Discovery of developmental GRN architecture in properly chosen sets of animals could have as deep an effect on our knowledge of genomic evolutionary processes, as well as on our understanding of how genomes control development.
Supplementary Material
Acknowledgments
We thank members of the Davidson laboratory, whose extraordinary efforts in constructing the GRN for endomesoderm specification in sea urchins have provided the foundations for this comparative study; Drs. Andy Ransick and Takuya Minokawa, who provided their unpublished data on tbr expression in SpOtx-Eng-injected S. purpuratus embryos; Pei Yun Lee for allowing us to use unpublished data regarding the effect of Gatae on tbr expression in S. purpuratus; Pat Leahy and the staff at the Kerckhoff Marine Laboratory (Corona del Mar, CA) for maintaining starfish; the staff at the California Institute of Technology Beckman Institute Arraying Facility for preparing cDNA library filters; Miki Yun, who helped with sequencing and plasmid DNA preparation; and Dr. Paola Oliveri of the Davidson laboratory and Professor Ellen Rothenberg for very helpful comments on the manuscript. This work was supported by National Aeronautics and Space Administration/Ames Grant NAG2-1587 and National Center for Research Resources Grant RR-15044 and by the California Institute of Technology Beckman Institute Genomics Technology Facility (to E.H.D.).
Abbreviations: GRN, gene regulatory networks; QPCR, quantitative PCR; MASO, morpholino-substituted antisense oligonucleotide; Eng, Engrailed.
References
- 1.Davidson, E. H. (2001) Genomic Regulatory Systems: Development and Evolution (Academic, San Diego).
- 2.Davidson, E. H., McClay, D. R. & Hood, L. (2003) Proc. Natl. Acad. Sci. USA 100, 1475-1480. [DOI] [PMC free article] [PubMed] [Google Scholar]
- 3.Cripps, R. M. & Olson, E. N. (2002) Dev. Biol. 246, 14-28. [DOI] [PubMed] [Google Scholar]
- 4.Davidson, E. H., Rast, J. P., Oliveri, P., Ransick, A., Calestani, C., Yuh, C. H., Minokawa, T., Amore, G., Hinman, V., Arenas-Mena, C., et al. (2002) Science 295, 1669-1678. [DOI] [PubMed] [Google Scholar]
- 5.Davidson, E. H., Rast, J. P., Oliveri, P., Ransick, A., Calestani, C., Yuh, C. H., Minokawa, T., Amore, G., Hinman, V., Arenas-Mena, C., et al. (2002) Dev. Biol. 246, 162-190. [DOI] [PubMed] [Google Scholar]
- 6.Maduro, M. F. & Rothman, J. H. (2002) Dev. Biol. 246, 68-85. [DOI] [PubMed] [Google Scholar]
- 7.Nasiadka, A., Dietrich, B. H. & Krause, H. M. (2002) Adv. Dev. Biol. Biochem. 12, 155-204. [Google Scholar]
- 8.Stathopoulos, A. & Levine, M. (2002) Dev. Biol. 246, 57-67. [DOI] [PubMed] [Google Scholar]
- 9.Oliveri, P., Carrick, D. M. & Davidson, E. H. (2002) Dev. Biol. 246, 209-228. [DOI] [PubMed] [Google Scholar]
- 10.Oliveri, P., Davidson, E. H. & McClay, D. R. (2003) Dev. Biol. 258, 32-43. [DOI] [PubMed] [Google Scholar]
- 11.Rast, J. P., Cameron, R. A., Poustka, A. J. & Davidson, E. H. (2002) Dev. Biol. 246, 191-208. [DOI] [PubMed] [Google Scholar]
- 12.Smith, M. J., Arndt, A., Gorski, S. & Fajber, E. (1993) J. Mol. Evol. 36, 545-554. [DOI] [PubMed] [Google Scholar]
- 13.Littlewood, D. T. J., Smith, A. B., Clough, K. A. & Emson, R. H. (1997) Biol. J. Linn. Soc. 61, 409-438. [Google Scholar]
- 14.Smith, A. B. (1988) in Echinoderm Phylogeny and Evolutionary Biology, eds. Paul, C. R. C. & Smith, A. B. (Clarendon, Oxford), pp. 85-97.
- 15.Bowring, S. D. & Erwin, D. H. (1998) GSA Today 8, 1-8. [Google Scholar]
- 16.Sprinkle, J. & Kier, P. M. (1987) in Fossil Invertebrates, eds. Boardman, R. S., Cheetham, A. H. & Rowell, A. J. (Blackwell Scientific, Cambridge, MA), pp. 550-611.
- 17.Brown, C. T., Rust, A. G., Clarke, P. J. C., Pan, Z., Schilstra, M. J., De Buysscher, T., Griffin, G., Wold, B. J., Cameron, R. A., Davidson, E. H. & Bolouri, H. (2002) Dev. Biol. 246, 86-102. [DOI] [PubMed] [Google Scholar]
- 18.Yuh, C. H., Brown, C. T., Livi, C. B., Rowen, L., Clarke, P. J. C. & Davidson, E. H. (2002) Dev. Biol. 246, 148-161. [DOI] [PubMed] [Google Scholar]
- 19.Wang, W. Y., Wikramanayake, A. H., Gonzalez-Rimbau, M., Vlahou, A., Flytzanis, C. N. & Klein, W. H. (1996) Mech. Dev. 60, 185-195. [DOI] [PubMed] [Google Scholar]
- 20.Fuchikami, T., Mitsunaga-Nakatsubo, K., Amemiya, S., Hosomi, T., Watanabe, T., Kurokawa, D., Kataoka, M., Harada, Y., Satoh, N., Kusunoki, S., et al. (2002) Development (Cambridge, U.K.) 129, 5205-5216. [DOI] [PubMed] [Google Scholar]
- 21.Croce, J., Lhomond, G., Lozano, J. C. & Gache, C. (2001) Mech. Dev. 107, 159-162. [DOI] [PubMed] [Google Scholar]
- 22.Shoguchi, E., Satoh, N. & Maruyama, Y. K. (2000) Dev. Growth Differ. 42, 61-68. [DOI] [PubMed] [Google Scholar]
- 23.Hinman, V. F. & Davidson, E. H. (2003) Gene Expr. Patterns 3, 419-422. [DOI] [PubMed] [Google Scholar]
- 24.Hinman, V. F. & Davidson, E. H. (2003) Gene Expr. Patterns 3, 423-426. [DOI] [PubMed] [Google Scholar]
- 25.Hinman, V. F., Nguyen, A. & Davidson, E. H. (2003) Mech. Dev. 120, 1165-1176. [DOI] [PubMed] [Google Scholar]
- 26.Rast, J. P., Amore, G., Calestani, C., Livi, C. B., Ransick, A. & Davidson, E. H. (2000) Dev. Biol. 228, 270-286. [DOI] [PubMed] [Google Scholar]
- 27.Reuter, R. (1994) Development (Cambridge, U.K.) 120, 1123-1135. [DOI] [PubMed] [Google Scholar]
- 28.Patient, R. K. & McGhee, J. D. (2002) Curr. Opin. Genet. Dev. 12, 416-422. [DOI] [PubMed] [Google Scholar]
- 29.Wray, G. A. & McClay, D. R. (1988) Development (Cambridge, U.K.) 103, 305-315. [DOI] [PubMed] [Google Scholar]
- 30.Maruyama, Y. K. (2000) Zool. Sci. 17, 383-387. [DOI] [PubMed] [Google Scholar]
- 31.Tagawa, K., Humphreys, T. & Satoh, N. (2000) J. Exp. Zool. 288, 23-31. [DOI] [PubMed] [Google Scholar]
- 32.Richardson, W., Kitajima, T., Wilt, F. & Benson, S. (1989) Dev. Biol. 132, 266-269. [DOI] [PubMed] [Google Scholar]
Associated Data
This section collects any data citations, data availability statements, or supplementary materials included in this article.