Abstract
We have generated mice null for IFN-β and report the diverse consequences of IFN-β for both the innate and adaptive arms of immunity. Despite no abnormalities in the proportional balance of CD4 and CD8 T cell populations in the peripheral blood, thymus, and spleen of IFN-β-/- mice, activated lymph node and splenic T lymphocytes exhibit enhanced T cell proliferation and decreased tumor necrosis factor α production, relative to IFN-β+/+ mice. Notably, constitutive and induced expression of tumor necrosis factor α is reduced in the spleen and bone marrow (BM) macrophages, respectively, of IFN-β-/- mice. We also observe an altered splenic architecture in IFN-β-/- mice and a reduction in resident macrophages. We identify a potential defect in B cell maturation in IFN-β-/- mice, associated with a decrease in B220+ve/high/CD43-ve BM-derived cells and a reduction in BP-1, IgM, and CD23 expression. Circulating IgM-, Mac-1-, and Gr-1-positive cells are also substantially decreased in IFN-β-/- mice. The decrease in the numbers of circulating macrophages and granulocytes likely reflects defective maturation of primitive BM hematopoiesis in mice, shown by the reduction of colony-forming units, granulocyte-macrophage. We proceeded to evaluate the in vivo growth of malignant cells in the IFN-β-/- background and give evidence that Lewis lung carcinoma-specific tumor growth is more aggressive in IFN-β-/- mice. Taken altogether, our data suggest that, in addition to the direct growth-inhibitory effects on tumor cells, IFN-β is required during different stages of maturation in the development of the immune system.
The type I IFNs are a conserved family of secreted proteins that exhibit antiviral, growth-inhibitory, and immunomodulatory properties (1). There are 14 structural IFN-α genes and single IFN-β, IFN-ω, and IFN-κ genes within the human type I IFN locus, found on chromosome 9 (2, 3). The mouse locus on chromosome 4 has yet to be fully mapped; however, a single IFN-β gene and at least 12 IFN-α genes have been cloned (4-6). All of the type I IFNs bind to a common species-specific cell-surface receptor complex, composed of two transmembrane proteins, interferon receptor chains (IFNAR) 1 and 2 (7, 8). Although they mediate their diverse effects through the same receptor, differential regulation of gene expression mediated by the different IFN-α and -β subtypes has been reported (9). Indeed, there is accumulating evidence that IFN-β may interact differently with the extracellular region of the IFNAR complex, compared with IFN-α, and that this variable binding interaction may affect the conformation of the activated receptor complex, leading to differences in effector molecules recruited (10).
Activities of type I IFNs include direct antiproliferative effects on many tumor targets (11). In different comparative studies that focused on growth-inhibitory activities in melanoma cells, IFN-β exhibited a more marked growth-inhibitory activity than IFN-α2 (12, 13). Notably, using human and mouse IFN-β gene therapy in mouse models of human and mouse malignancies, studies revealed that IFN-β induces both direct antiproliferative and apoptotic effects, as well as systemic immunity against the tumor targets (14). Type I IFNs regulate MHC class I expression and enhancement of cytotoxic T lymphocyte activity and T helper cell functions. Additionally, type I IFNs will activate natural killer cells and induce macrophage activity (15). Viewed together, there is compelling evidence that type I IFNs influence many immune responses, and it remains unclear whether individual IFN-α subtypes or IFN-β differentially regulate these responses.
Valuable insights into the biology of the type I IFN system have been provided from studies with receptor knockout mice (16). However, because the IFN-α subtypes and IFN-β activate the same receptor complex, the distinctions amongst them in the context of biological activities cannot be evaluated in these receptor-void mice. Our approach to distinguish the biological effects of IFN-β from the IFN-α subtypes has been to generate a mouse null for IFN-β. IFN-β-/- mice are highly susceptible to vaccinia virus infection, in part because of a failure to mount an appropriate IFN-α response (17). Herein, we report on the further characterization of the IFN-β-/- mice, with reference to their involvement in the regulation and development of distinct immune compartments.
Materials and Methods
Animals and Cell Culture. IFN-β-/- (17) and IFN-β+/+ mice were bred and maintained in the Toronto General Hospital animal facility. All mice were maintained in a sterile, pathogen-free environment and treated according to the Animal Care Committee (ACC) guidelines of the Toronto General Research Institute. Lewis lung carcinoma (LLC-1) cells were maintained in 10% DMEM supplemented with 100 units/ml penicillin/100 μg/ml streptomycin (GIBCO/BRL, complete medium). To obtain primary bone marrow (BM)-derived macrophages (BMMs), cells were flushed from tibia and femurs in complete medium, allowed to adhere for 24 h, and cultured for 6 days with 10 ng/ml murine colony-stimulating factor, MCSF (R & D Systems).
Tumor Inoculation. Cultured LLC-1 cells were resuspended in PBS at a concentration of 107 per ml, and 100 μl was injected s.c. into the right flank of age-matched (7 weeks) IFN-β+/+ (n = 8) and IFN-β-/- (n = 9) mice. Tumor development was monitored daily and tumor volume was determined from orthogonal linear measurements made with calipers according to the formula w2 × l × 0.52 = mm3. Mice were killed 19 days after inoculation, when tumor size in a majority of mice had reached a size limit of 15 mm, according to ACC procedures.
Immunohistology. Naïve IFN-β+/+ and IFN-β-/- mice were killed, and selected tissues were harvested, fixed in 10% (vol/vol) formalin (Sigma), paraffin-embedded, sectioned at 4 μm, and processed for immunohistochemistry. Tissue sections were stained with rat anti-mouse CD3 (T cells) polyclonal antibody (A0452, DAKO) and rat anti-mouse B220 (B cells) (clone RA3-6B2, BD Pharmingen), rat anti-mouse Mac-3 (macrophages) (clone M3/84, BD Pharmingen), or goat anti-mouse tumor necrosis factor (TNF) α (AF-410, R & D Systems) monoclonal antibodies. For B220/CD3 double immunostaining, sections were incubated with rat anti-mouse B220, followed by biotinylated rabbit anti-rat IgG (Vector Laboratories), and then streptavidin horseradish peroxidase (HRP) complex (Signet Laboratories, Dedham, MA). Bound peroxidase activity was developed with 3,3′-diaminobenzidine (DAB) tetrahydrochloride (Sigma). After blocking, sections were stained with rabbit anti-human CD3 antibody followed by goat anti-rabbit IgG (Vector labs) and incubated with streptavidin-HRP as before. Bound peroxidase activity was visualized by using Ni-DAB (Vector Laboratories). For the analysis of splenic macrophages and TNF-α, sections were stained with rat anti-mouse Mac-3 and goat anti-mouse TNF-α antibodies, respectively, followed by biotin-IgG, and then streptavidin-HRP. Bound peroxidase activity was visualized with Nova red (Vector Laboratories).
Flow Cytometry. BM cells were harvested from femurs and tibia. Spleens and thymi were collected and single-cell suspensions were prepared by passing the tissues through a 70-μm nylon mesh. Peripheral blood (PB) was obtained from tail veins. All cells were treated with ACK (8.3 g/liter ammonium chloride/1 g/liter potassium bicarbonate/0.4 g/liter EDTA) to lyse red blood cells. Cell suspensions were washed in PBS and resuspended at 107 cells per ml in fluorescence-activated cell sorting buffer [2% (vol/vol) FCS/PBS] before immunostaining. Cells were labeled with rat anti-mouse antibodies for 30 min at 4°C, analyzed with a FACSCaliber flow cytometer, and quantitated with cellquest software (both from BD Biosciences). Monoclonal antibodies used were FITC-conjugated IgM, BP-1, CD23, CD43, NK1.1, Mac-1, Gr-1, CD3 and CD4, and phycoerythrin (PE)-conjugated B220 and CD8 (BD Pharmingen). BMM cells were stained with PE-conjugated Toll-like receptor (TLR) 4-MD2 along with Rat IgG2a isotype control (eBioscience, San Diego).
Intracellular Cytokine Analysis. Intracellular staining was used to determine cytokine production at the single-cell level in lymphocytes. Splenocytes were resuspended at 2 × 10⁶ per ml in 10% α-MEM containing soluble anti-CD3 (3 μg/ml, BD Pharmingen) and incubated for 48 h at 37°C and 5% CO2. Lymphocytes were extracted (Lympholyte-M, Cedarlane Laboratories), resuspended at 2 × 10⁶ per ml, and activated by phorbol myristic acid (PMA) (10 ng/ml) and ionomycin (0.5 μg/ml) for 4 h in the presence of 5 μg/ml brefeldin A (Sigma). Cells were harvested, fixed in 2% paraformaldehyde, washed, and resuspended in a permeabilization and FcR blocking buffer containing 0.25% saponin (Sigma), normal mouse serum (Sigma), 0.1% NaN3, and rat hybridoma clone 2.4G2 (anti-CD16/CD32; provided by R. Miller, Ontario Cancer Institute, Toronto). Permeabilized cells were incubated in the presence of saponin with monoclonal antibody (mouse anti-CD4 or -CD8) and isotype-matched controls or cytokine antibodies for 30 min. Antibodies used were Cy-chrome-conjugated anti-mouse CD4 and CD8 (BD Pharmingen), FITC anti-mouse IFN-γ and TNF-α, PE anti-mouse IL-2, and FITC rat IgG (eBioscience). Ten thousand events were analyzed within the lymphocyte gate, as determined by forward- and side-scatter profiles, on a FACSCalibur flow cytometer (BD Biosciences Immunocytometry Systems) and quantitated by using cellquest software.
BMM Analysis. Primary BMMs were seeded in 96-well plates (105 per well in 100 μl), incubated overnight and treated with lipopolysaccharide (LPS, Sigma). Murine rIFN-β (Biogen) was added at final doses of 10 or 100 units/ml at the time of LPS treatment.
Supernatants were harvested after 24 h and assayed for TNF-α in triplicate assays (Quantikine, R & D Systems).
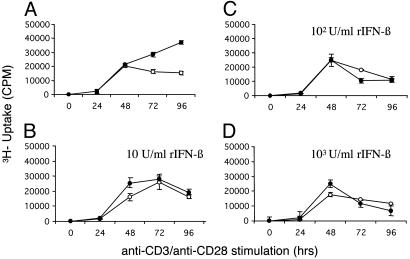
T Cell Proliferation Assay. A modified T cell proliferation assay was carried out (18). Lymph node cells (2 × 10⁵; superficial, cervical, facial, brachial, axillary, and inguinal) were incubated at 37°C and 5% CO2 in 200 μl of culture medium in individual wells of 96-well microtiter plates and stimulated with soluble anti-CD3 (3 μg/ml) and anti-CD28 (1 μg/ml) antibodies at 37°C for up to 96 h. Murine rIFN-β (Biogen) was added at final doses of 10, 102, or 103 units/ml at the time of stimulation. Cells were pulsed for 18 h with 1 μCi (1 Ci = 37 GBq) [methyl-3H]thymidine (specific activity 2.0 Ci/mmol, ICN) over the 96-h time period, and TCA-precipitable thymidine incorporation was measured by using a scintillation counter (LS1801, Beckman).
Hematopoietic Progenitor Cell Assays. BM mononuclear cells from IFN-β+/+ and IFN-β-/- mice were separated by Ficoll/Hypaque sedimentation and cultured in a methylcellulose mixture, as described (19), containing mouse hematopoietic growth factors (Methocult GF3434, StemCell Technologies, Vancouver). Colony-forming units, granulocyte-macrophage (CFU-GM), burst-forming units, erythroid (BFU-E), and mixed-lineage colonies [CFU, granulocyte, erythroid, macrophage, megakaryocyte (GEMM)] were scored on day 12 of culture by an inverted microscope.
Results
IFN-β-/- Mice Have Reduced Levels of Circulating Mature B and Myeloid Lineage Cells. Immunophenotyping of PB derived from IFN-β+/+ and IFN-β-/- mice was undertaken, specifically focusing on B cells (B220 and IgM), T cells (CD3, CD4, and CD8), and myeloid-lineage cells (Mac-1 and Gr-1) (Table 1). We consistently observe a decrease in the circulating levels of myeloid-lineage cells in PB derived from IFN-β-/- as compared with IFN-β+/+ mice. Specifically, Mac-1 positive-staining cells are reduced from circulating levels of 13.1 ± 0.8% in the PB of IFN-β+/+ mice to 7.3 ± 0.8% in the IFN-β-/- mice (P = 0.0001). Moreover, Gr-1-positive cells (neutrophils) are reduced from circulating levels of 22.9 ± 0.9% in the IFN-β+/+ mice to 14.6 ± 1.0% in the IFN-β-/- mice (P = 0.001). B and T cell profiles are essentially identical for IFN-β+/+ and IFN-β-/- mice, with the exception of circulating IgM-expressing cells, which are reduced from 7.05 ± 2.7 in IFN-β+/+ to 4.88 ± 1.2 in IFN-β-/- mice (P = 0.05).
Table 1. Cell-surface markers expressed on PB cells from IFN-β+/+ and IFN-β−/− mice.
| PB cells expressing cell-surface marker, %
|
||
|---|---|---|
| Antibody markers | IFN-β+/+ (n = 8) | IFN-β−/− (n = 9) |
| B220 | 8.80 ± 1.1 | 9.71 ± 1.2 |
| B220/lgM | 7.05 ± 2.7 | 4.88 ± 1.2* |
| CD3 | 33.1 ± 0.9 | 29.5 ± 2.8 |
| CD4 | 21.7 ± 1.4 | 17.0 ± 1.7 |
| CD8 | 10.0 ± 0.9 | 8.0 ± 0.3 |
| NK1.1 | 14.9 ± 2.7 | 11.3 ± 1.9 |
| Mac-1 | 13.1 ± 0.8 | 7.3 ± 0.8*** |
| Gr-1 | 22.9 ± 0.9 | 14.5 ± 1.0*** |
Tail-vein PB was collected from mice aged 7 weeks. The percent of PB cells expressing the different cell-surface markers was determined by flow cytometry after labeling with the indicated fluorochrome-conjugated Abs as described in Materials and Methods. Data represent means ± SEM (*, P ≤ 0.05; ***, P ≤ 0.001).
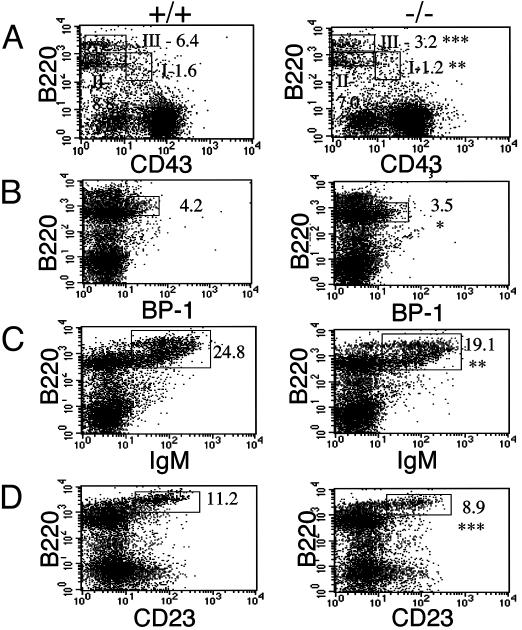
IFN-β Is Required for B Cell Maturation and Myelopoiesis in the BM. The various stages of B cell maturation are elaborated according to specific cell-surface markers: pro-B (B220+ve, CD43+ve), pre-B (B220+ve/low, CD43+/-ve, BP-1+ve, IgM-ve), immature (B220+ve/high, IgM+ve, CD23-ve), and mature (B220+ve/high, IgM+ve, CD23+ve). CD43 is expressed on early B cell precursors during lymphoid cell development and is rapidly lost as these cells transit through pre-B and B cell stages. The flow cytometry profiles in Fig. 1 represent BM cells simultaneously stained for B220 and one of the following: CD43, BP-1, IgM, or CD23. The B220/CD43 population can be further resolved into the subgroups B220+ve/CD43+ve, B220+ve/low/CD43-ve, and B220+ve/high/CD43-ve, corresponding to pro-B, pre-B, and mature B cells, respectively. These subsets are shown boxed in Fig. 1 A as I, II, and III, respectively. We observe a decrease in all fractions, I-III, in the IFN-β-/- compared with IFNβ+/+ cells. Specifically, the decrease is statistically significant in fractions I and III. As a consequence of this, we identify a down regulation in B220+ve/BP-1+ve cells (Fig. 1B). BP-1 is a marker restricted to the early B-lineage population. Although a majority of B220+ve/BP-1+ve cells are thought to be CD43-ve, a small percentage, 30%, have been shown to express CD43 (20). The profiles in Fig. 1 C and D reveal significant decreases in cell-surface expression of IgM and CD23 in the B220+ve population derived from the IFN-β-/- mice. Viewed together, these data suggest a defect at a very early stage in B cell maturation associated with the absence of IFN-β.
Fig. 1.
Defect in BM B cell maturation in IFN-β-/- mice. BM cells, harvested from IFN-β+/+ and IFN-β-/- mice, were depleted of RBC and analyzed by flow cytometry after labeling with the indicated Abs. (A) B220- and CD43-lineage cells. B220-positive cells are shown subdivided into fractions I (B220+ve/CD43+ve), II (B220+ve/low/CD43-ve), and III (B220+ve/high/CD43-ve). (B-D) B220 and BP-1, IgM, and CD23 lineages. Where indicated, numbers represent the gated cell population as a percentage of total cell population. Data represent the mean from groups of five mice. *, P < 0.05; **, P < 0.01; ***, P < 0.001. +/+, IFN-β+/+; -/-, IFN-β-/-.
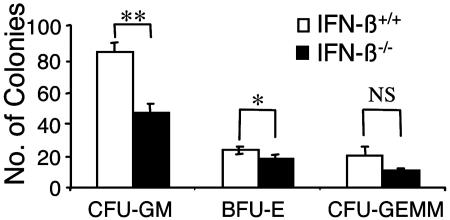
To determine whether the decreased numbers of circulating granulocytes and monocytes in the PB of IFN-β-/- mice result from defects in the growth/maturation of primitive hematopoietic progenitors, BM cells from IFN-β+/+ and IFN-β-/- mice were cultured in a clonogenic methylcellulose assay system (19). Colony formation for myeloid/monocytic (CFU-GM), burst-forming units, erythroid (BFU-E), and mixed-lineage [CFU, granulocyte, erythroid, macrophage, megakaryocyte (GEMM)] progenitors was assessed. We identified a substantial reduction in colony formation for CFU-GM progenitors from the BM of IFN-β-/- mice as compared with IFN-β+/+ mice (Fig. 2), strongly suggesting that the decreased numbers of Mac-1- and Gr-1-positive cells in the PB of these mice result from defective BM myelopoiesis.
Fig. 2.
Defective maturation of CFU-GM hematopoietic progenitors in the BM of IFN-β-/- mice. BM mononuclear cells from IFN-β+/+ and IFN-β-/- mice were plated in a methylcellulose assay system. The data are expressed as the mean total number of cfu ± SEM from three independent experiments. CFU-GM, burst-forming units (BFU-E), and mixed-lineage colonies (CFUGEMM). *, P = 0.049; **, P = 0.01.
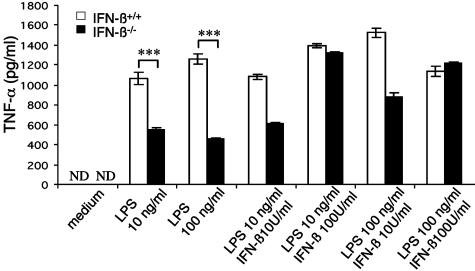
Impaired TNF-α Production in LPS Stimulated IFN-β-Deficient BMMs. Macrophages are a source of both constitutive and inducible IFN-β (21, 22). To examine macrophage function in the absence of IFN-β, IFN-β-/- BMMs were stimulated with LPS and assessed for production of TNF-α, a key indicator of macrophage activation. As shown in Fig. 3, TNF-α production was markedly reduced in IFN-β-/- BMMs compared with wild-type BMMs, when stimulated with either 10 or 100 ng/ml LPS. Notably, production of TNF-α was restored when IFN-β-/- BMMs were simultaneously treated with LPS and IFN-β. These results suggest that IFN-β is necessary for effective BMM activation.
Fig. 3.
Impaired LPS-induced TNF-α production from IFN-β-/- BMMs. BMMs from IFN-β+/+ and IFN-β-/- mice were cultured for 24 h after LPS stimulation (10 and 100 ng/ml), in the presence or absence of rIFN-β. Supernatants were assayed for TNF-α in triplicate by ELISA. Data are representative of the mean ± SEM of two independent assays. (IFN-β+/+ n = 5; IFN-β-/- n = 5). ND, not detected; ***, P ≤ 0.0001.
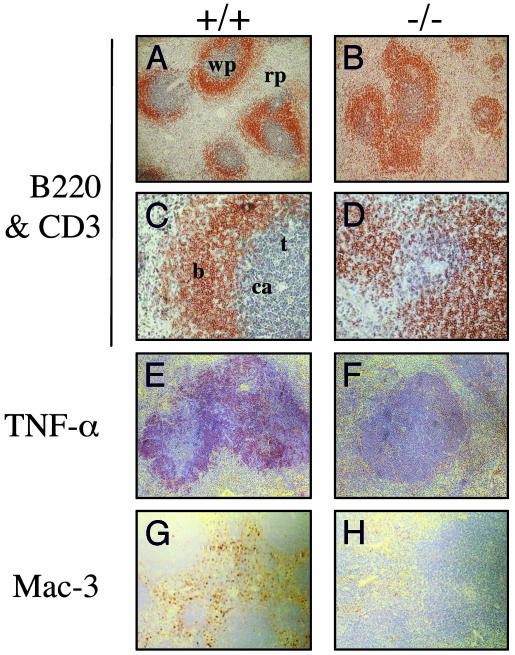
Histological Analysis of Tissues: Altered Splenic Architecture. The involvement of TNF-α in secondary lymphoid development has been widely documented (23, 24). Having identified a reduction in levels of inducible TNF-α in activated IFN-β-/- BMMs, we examined the splenic microarchitecture in IFN-β-/- mice. Splenic white pulp is partitioned into a central T cell-rich zone, designated periarteriolar lymphoid sheaths (PALS), surrounded by B cell-rich primary follicles. Separating the white and red pulp is the marginal zone, which also contains naïve B cells. Gross histological analyses of spleens from IFN-β+/+ and IFN-β-/- mice reveal no dramatic differences. However, closer scrutiny of the organization of primary B cell follicles and their spatial arrangement with respect to the PALS identifies a loss of defined follicles and a vague B/T cell interface in IFN-β-/- spleens (Fig. 4 A-D). This phenotype has been reported in TNF-α-deficient mice (25, 26). Indeed, on further investigation we detect reduced levels of splenic TNF-α expression in IFN-β-/- mice (Fig. 4 E and F). Additionally, we observe a decrease in red pulp splenic macrophages in the IFN-β-/- mice, identified as a reduction in Mac-3+ve-staining cells (Fig. 4 G and H).
Fig. 4.
Comparative analysis of splenic tissues from naïve IFN-β+/+ and IFN-β-/- mice. Paraffin-embedded spleen sections were stained with anti-B220 (brown) and anti-CD3 (blue) (A-D), anti-TNF-α (red) (E and F), or anti-Mac-3 (brown) (G and H) Abs. wp, white pulp; rp, red pulp; b, B cell follicles; t, PALS; ca, central arterioles. +/+, IFN-β+/+; -/-, IFN-β-/-. (Original magnification: A, B, and E-H, ×10; C and D, ×40.)
In Vitro Characteristics of Activated T Cells from IFN-β-/- Mice: Hyperproliferation and Low TNF-α Production. Consistent with the PB data, CD4 and CD8 profiles in thymus and spleen are essentially indistinguishable between the IFN-β+/+ and IFN-β-/- mice (see Supporting Methods and Fig. 8, which are published as supporting information on the PNAS web site). However, when lymph node cells are anti-CD3/anti-CD28 stimulated in time course studies, we consistently observe an enhanced proliferation of the IFN-β-/- lymph node T cells, compared with the IFN-β+/+ population (P = 0.002; Fig. 5A). In dose-response experiments, we show that IFN-β treatment attenuates this hyperproliferative response to anti-CD3/anti-CD28 stimulation (Fig. 5 B-D).
Fig. 5.
Enhanced T cell proliferation in the absence of IFN-β. Lymph node cells from IFN-β+/+ (○) and IFN-β-/- (•) mice were stimulated with murine recombinant anti-CD3 (3 μg/ml)/anti-CD28 (1 μg/ml), in the presence (B-D)or absence (A) of murine rIFN-β (10, 100, or 1,000 units/ml) then pulsed for 18 h with [methyl-3H]thymidine. [3H]Thymidine uptake was measured over 96 h. Data are representative of the mean ± SEM from three independent experiments (P = 0.002).
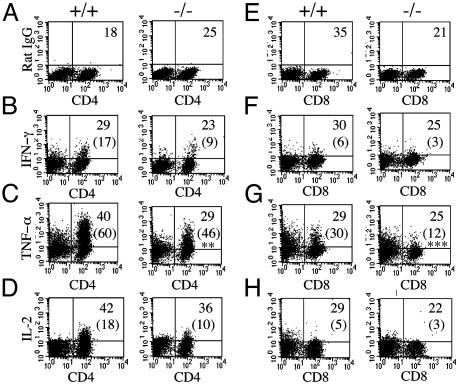
PMA and ionomycin broadly activate lymphocytes and may be used to assess the overall potential of various lymphocyte subpopulations to express selected cytokines. When splenic T lymphocytes are stimulated with PMA and ionomycin and cytokine expression profiles are elaborated in their CD4+ and CD8+ populations, intracellular levels of IFN-γ and IL-2 are indistinguishable among the IFN-β+/+ and IFN-β-/- mice (Fig. 6 B, F, D, and H). This analysis represents a typical T cell response to PMA and ionomycin. In contrast, we consistently observe a reduction in PMA and ionomycin-inducible TNF-α in both CD4+ and CD8+ splenic T cells derived from IFN-β-/- mice compared with inducible TNF-α in IFN-β+/+ CD4+ (P = 0.008) and CD8+ (P = 0.001) cells (Fig. 6 C and G). The absence of constitutive IFN-β expression implicated in normal cell growth regulation and a paucity of inducible TNF-α, which is also associated with negative cell growth regulation, might contribute to the enhanced proliferation we observed in IFN-β-/- T cells.
Fig. 6.
Reduced levels of TNF-α in activated IFN-β-/- T cells. Splenocytes were stimulated with mouse recombinant anti-CD3 for 48 h, followed by PMA and ionomycin for 4 h. Cells were then simultaneously labeled with cell-surface Abs for CD4 (A-D) or CD8 (E-H) and stained for either a nonspecific antibody with the same isotype (A and E) or intracellular cytokine antibodies as indicated. Values shown are the lymphocyte population as a percentage of total splenic population. Numbers in parentheses represent the percentage of either CD4- or CD8-positive cytokine-secreting cells. Statistical analysis was by Student's t test; **, P = 0.008; ***, P = 0.001. +/+, IFN-β+/+; -/-, IFN-β-/-. Data are representative from IFN-β+/+ (n = 5) and IFN-β-/- (n = 5) mice.
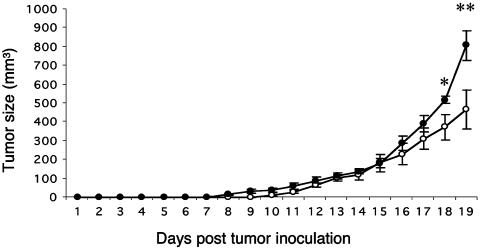
Aggressive Tumor Growth in IFN-β-/- Mice. Given the effects we observed in various immune compartments in the IFN-β-/- mice, the role of IFN-β in limiting tumor progression was assessed. IFN-β+/+ mice inoculated s.c. with the murine carcinoma line LLC-1 exhibited palpable signs of tumor growth (mean 10.8 mm3) on day 10 after inoculation (eight of eight). Notably, eight of the nine IFN-β-/- mice exhibited palpable tumors (mean 2.2 mm3) by day 7 (Fig. 7). Moreover, tumor size was significantly larger in the IFN-β-/- mice compared with the IFN-β+/+ mice when measured on days 18 and 19 after inoculation, prior to terminating the experiment: 518 ± 64 mm3 vs. 372 ± 133 mm3 and 807 ± 231 mm3 vs. 466 ± 166 mm3, respectively. Histological examination of tumors indicated no gross differences between IFN-β+/+ mice and IFN-β-/- mice and no differences in the extent of T cell (CD3+ve-staining cells) or macrophage (Mac-3+ve-staining cells) infiltration, which was minimal (data not shown).
Fig. 7.
Impaired anti-LLC-1 tumor response in IFN-β-/- mice. IFN-β+/+ (○) and IFN-β-/- (•) mice were inoculated s.c. with 106 LLC-1 cells and monitored daily for tumor growth, as indicated. Each point is representative of the average tumor size for the group ± SEM. *, P ≤ 0.05; **, P ≤ 0.01.
Discussion
We have generated mice with a null mutation in the IFN-β gene. Although these mice exhibit no overt phenotype, they are highly susceptible to vaccinia virus infection (17). We have undertaken an extensive immunophenotyping of these mice, and our data reveal abnormalities in discrete cell populations. Examination of BM-derived B cells revealed an abnormal shift in the B220+ve/CD43-ve population in IFN-β-/- compared with IFN-β+/+ mice, toward a more immature prepro-B cell phenotype. Earlier studies have shown that B cell repertoire selection can be modulated by IFN produced locally in the BM (28). Having observed reductions in the early prepro-B cell population and subsequent developmental stages, it remains unclear at which stage of B cell development IFN-β exerts its effects. However, departure from proliferation into a quiescent stage during variable region gene segment (VDJ) rearrangement is a critical step in B-lineage commitment, and our data suggest that constitutive IFN-β expression may be required for early B cell progenitors to arrest in G0/G1 prior to B-lineage commitment. Indeed, IFN-β has been shown to decrease c-Myc expression, an essential regulator of cell cycle progression, during hematopoietic differentiation (29-31). In agreement with the finding of a blockade in lineage progression of B cells in the BM, we observe a reduction in IgM-positive cells in the spleens (data not shown) and PB of IFN-β-/- mice compared with wild-type mice. We consistently detect decreases in Mac-1- and Gr-1-surface-marker-positive cells in the PB of IFN-β-/- mice. Interestingly, this result is in contrast to what is observed in mice null for interferon receptor chain (IFNAR) 1, where increases in Mac-1- and Gr-1-positive cells have been reported (16). Earlier studies have demonstrated that minute amounts of IFN-β are secreted constitutively (32, 33), serving to prime cells for subsequent IFN production, in an autocrine manner. The growth factor murine colony-stimulating factor promotes the endogenous production of IFN to augment the differentiation and maturation of macrophages exclusively (34, 35). We infer that in the absence of IFN-β, this growth-promoting mechanism is likely impaired, thereby affecting the absolute numbers of circulating monocytes.
Clearly, a lack of IFN-β also leads to decreased numbers of primitive myeloid hematopoietic progenitors in the BM of these mice. This defect in hematopoiesis appears to be specific for the myeloid/monocytic lineage, because the erythroid-lineage progenitors are not significantly affected. Perhaps the defect at the CFU-GM level of hierarchical maturation reflects defective expression of a growth-promoting, myeloid-specific cytokine(s), whose regulation depends on basal IFN-β production in the BM. Thus, despite the fact that type I IFNs suppress myelopoiesis when added exogenously to BM cultures at high concentrations (19, 36), it is likely that low levels of IFN-β, constitutively produced in the BM, exert a positive regulatory effect on myelopoiesis. However, the validity of such a hypothesis remains to be examined. Alternatively, the defect may reflect the lack of direct differentiation-inducing effects of the cytokine on progenitors. In support of the second possibility, there is evidence that IFN-β can cooperate with IL-1 and TNF-α to induce differentiation and that IFN-β is an autocrine differentiating factor (37). However, whether its positive regulatory effects depend on the production of these cytokines in the BM in vivo or on direct effects remains to be clarified.
Further examination of the IFN-β-/- BMMs revealed a marked reduction in the levels of TNF-α produced after LPS stimulation. LPS elicits a TNF-α response specifically via activation of the TLR4 (38). This TLR4 activation results in rapid induction of IFN-β gene expression (39), required for subsequent LPS-inducible gene expression (40). Notably, IFN-β and IFN-κ, but not IFN-α2, will regulate LPS-inducible TNF-α production in monocytes. Examination of TLR4 cell-surface expression on both IFN-β-/- and IFN-β+/+ BMMs revealed comparable receptor numbers (data not shown), suggesting that TLR4 expression was not limiting in the IFN-β-/- BMMs and cannot explain the defect in TNF-α production. Our data, therefore, provide further support for a role for IFN-β in LPS-inducible TNF-α production. Additionally, our results suggest a positive regulatory role for IFN-β in myelopoiesis that may involve BMM maturation. Accordingly, a diminished TNF-α response may reflect an accumulation of immature, nonresponsive BM monocytes.
We observe striking phenotypic similarities between IFN-β-/- mice and those reported for TNF-α-/- mice: (i) a conspicuous lack of organization of splenic white pulp and (ii) distinct similarities in B220 expression profiles (25, 26). Additionally, we provide evidence for reduced levels of constitutive and inducible TNF-α in IFN-β-/- splenocytes. Notably, TNF-α is required for stromal cell expression of chemokines involved in splenic recruitment of T and B cells (41). In the absence of direct evidence for an obligatory role for IFN-β in TNF-α production, accumulating data suggest that type I IFNs influence the regulation of gene expression for different TNF family members. Specifically, TNF-α-related apoptosis-inducing ligand (TRAIL) is IFN-β-inducible (42), as are a number of other TNF-α-related genes (E.N.F., unpublished data). Additionally, an X-linked IFN-inducible gene, X-linked inhibitor of apoptosis associated factor 1 (XAF-1), enhances TRAIL-induced apoptosis of melanoma cells (43). Melphalan-inducible up-regulation of TNF-α, observed in both spleens and tumors of tumor-bearing mice, is mediated by IFN-β and dependent on IFN receptor activation (44). Further supportive evidence that IFN-β regulates TNF-α production derives from the observation that IFN-β-/- mice have reduced levels of splenic macrophages compared with their IFN-β+/+ counterparts. TNF-α is a master regulator of leukocyte movement (45). Macrophage inflammatory protein (MIP) 3β (CCL 19), a chemokine critical for the trafficking of BM progenitors, is inducible by TNF-α. The restricted production of TNF-α in IFN-β-/- mice may limit the exit of progenitors, specifically the Mac-1- and Gr-1-positive cells in the IFN-β-/- mice.
Recently, Picaud et al. (46) provided evidence for enhanced tumor development in mice lacking a functional type I IFN receptor. Similarly, we have identified aggressive tumor progression in IFN-β-/- mice. A measurable tumor load was apparent as early as day 7 in IFN-β-/- mice. Furthermore, the average tumor size was larger in the IFN-β-/- mice compared with IFN-β+/+ mice. Tumor elimination involves different effector cells, including T and B lymphocytes, natural killer cells, macrophages, and granulocytes. Regardless of altered cytolytic/cytotoxic effector functions of these infiltrating T cells and macrophages, reductions in their absolute numbers effectively limits their ability to clear the tumor load. Moreover, in the absence of the direct antiproliferative effects of IFN-β in tumor cells, tumor progression might be expected to proceed more aggressively. The enhanced proliferative potential of lymph node T cells and restricted TNF-α response of splenic T cells to PMA and ionomycin, imply functional abnormalities in the T cells from IFN-β-/- mice. Certainly, the direct cytotoxic effects of TNF-α coupled with a critical role of TNF-α in CD8 T cell-mediated elimination of tumor cells (47) contribute significantly to tumor clearance. Thus, restricted TNF-α levels in the IFN-β-/- mice would allow for tumor progression.
Addition of IFN-β to anti-CD3/anti-CD28-stimulated T cells from IFN-β-/- mice restores the proliferative response to comparable levels seen with IFN-β+/+ cells. These data establish that the hyperproliferative response observed in IFN-β-/- cells is not a developmental defect and demonstrate the physiological relevance of endogenous IFN-β in T cell function. The failure to regulate a proliferative response to an activating stimulus has the potential to alter the kinetics of a progressive immune response involving different immune effector cell populations. An enhanced proliferative response in T cells may delay differentiation of associated effector functions. It is intriguing to speculate that, as with macrophages, IFN-β may function to regulate the expression of surface markers on T cells associated with trafficking to and infiltration of tumors. The implications are that subtle differences in both the innate and adaptive immune responses between mice null for IFN-β and their wild-type counterparts may account for the increased susceptibility to aggressive tumor progression in IFN-β-/- mice. Viewed altogether, these data suggest an interrelationship between IFN-β and TNF-α, critical for a variety of immunoregulatory functions.
Supplementary Material
Acknowledgments
We thank B. Rabinovich for technical assistance and G. Wu and L. Lu for advice and expertise. This work was supported by Canadian Institutes of Health Research Grant MOP 15094 (to E.N.F.), National Institutes of Health Grants CA77816 and CA94079 (to L.C.P.), and a Veterans Affairs Merit Review Grant (to L.C.P.).
This paper was submitted directly (Track II) to the PNAS office.
Abbreviations: BM, bone marrow; BMM, BM-derived macrophages; CFU-GM, colony-forming unit, granulocyte-macrophage; LLC, Lewis lung carcinoma; LPS, lipopolysaccharide; PB, peripheral blood; PMA, phorbol myristic acid; TLR, Toll-like receptor; TNF, tumor necrosis factor.
References
- 1.Stark, G. R., Kerr, I. M., Williams, B. R. G., Silverman, R. H. & Schreiber, R. D. (1998) Annu. Rev. Biochem. 67, 227-264. [DOI] [PubMed] [Google Scholar]
- 2.Diaz, M. O., Pomykala, H. M., Bohlander, S. K., Maltepe, E., Malik, K., Brownstein, B. & Olopade, O. I. (1994) Genomics 22, 540-552. [DOI] [PubMed] [Google Scholar]
- 3.LaFleur, D. W., Nardelli, B., Tsareva, T., Mather, D., Feng, P., Semenuk, M., Taylor, K., Buergin, M., Chinchilla, D., Roshke, V., et al. (2001) J. Biol. Chem. 276, 39765-39771. [DOI] [PubMed] [Google Scholar]
- 4.Kelley, K. A. & Pitha, P. M. (1985) Nucleic Acids Res. 13, 805-823. [DOI] [PMC free article] [PubMed] [Google Scholar]
- 5.Higashi, Y., Sokawa, Y., Watanabe, Y., Kawade, Y., Ohno, S., Takaoka, C. & Taniguchi, T. (1983) J. Biol. Chem. 258, 9522-9529. [PubMed] [Google Scholar]
- 6.Kelley, K. A., Kozak, C. A., Dandoy, F., Sor, F., Skup, D., Windass, J. D., DeMaeyer Guignard, J., Pitha, P. M. & DeMaeyer, E. (1983) Gene 26, 181-188. [DOI] [PubMed] [Google Scholar]
- 7.Uze, G., Lutfalla, G. & Gresser, I. (1990) Cell 60, 225-234. [DOI] [PubMed] [Google Scholar]
- 8.Novick, D., Cohen, B. & Rubinstein, M. (1994) Cell 77, 391-400. [DOI] [PubMed] [Google Scholar]
- 9.Der, S. D., Zhou, A., Williams, B. R. & Silverman, R. H. (1998) Proc. Natl. Acad. Sci. USA 95, 15623-15628. [DOI] [PMC free article] [PubMed] [Google Scholar]
- 10.Deonarain, R., Chan, D. C., Platanias, L. C. & Fish, E. N. (2002) Curr. Pharm. Des. 8, 2131-2137. [DOI] [PubMed] [Google Scholar]
- 11.Kalvakolanu, D. V. (2000) Histol. Histopathol. 15, 523-537. [DOI] [PubMed] [Google Scholar]
- 12.Johns, T. G., Mackay, I. R., Callister, K. A., Hertzog, P. J., Devenish, R. J. & Linnane, A. W. (1992) J. Natl. Cancer Inst. 84, 1185-1190. [DOI] [PubMed] [Google Scholar]
- 13.Chawla-Sarkar, M., Leaman, D. W. & Borden, E. C. (2001) Clin. Cancer Res. 7, 1821-1831. [PubMed] [Google Scholar]
- 14.Qin, X. Q., Beckham, C., Brown, J. L., Lukashev, M. & Barsoum, J. (2001) Mol. Ther. 4, 356-364. [DOI] [PubMed] [Google Scholar]
- 15.Brierley, M. M. & Fish, E. N. (2002) J. Interferon Cytokine Res. 22, 835-845. [DOI] [PubMed] [Google Scholar]
- 16.Hwang, S. Y., Hertzog, P. J., Holland, K. A., Sumarsono, S. H., Tymms, M. J., Hamilton, J. A., Whitty, G., Bertoncello, I. & Kola, I. (1995) Proc. Natl. Acad. Sci. USA 92, 11284-11288. [DOI] [PMC free article] [PubMed] [Google Scholar]
- 17.Deonarain, R., Alcami, A., Alexiou, M., Dallman, M. J., Gewert, D. R. & Porter, A. C. (2000) J. Virol. 74, 3404-3409. [DOI] [PMC free article] [PubMed] [Google Scholar]
- 18.Shi, F. D., Takeda, K., Akira, S., Sarvetnick, N. & Ljunggren, H. G. (2000) J. Immunol. 165, 3099-3104. [DOI] [PubMed] [Google Scholar]
- 19.Verma, A., Deb, D. K., Sassano, A., Uddin, S., Varga, J., Wickrema, A. & Platanias, L. C. (2002) J. Biol. Chem. 277, 7726-7735. [DOI] [PubMed] [Google Scholar]
- 20.Hardy, R. R., Carmack, C. E., Shinton, S. A., Kemp, J. D. & Hayakawa, K. (1991) J. Exp. Med. 173, 1213-1225. [DOI] [PMC free article] [PubMed] [Google Scholar]
- 21.Zhang, F., Lu, W. & Dong, Z. (2002) Clin. Cancer Res. 8, 2942-2951. [PubMed] [Google Scholar]
- 22.Varano, B., Fantuzzi, L., Puddu, P., Borghi, P., Belardelli, F. & Gessani, S. (2000) Virology 277, 270-277. [DOI] [PubMed] [Google Scholar]
- 23.Ruuls, S. R., Hoek, R. M., Ngo, V. N., McNeil, T., Lucian, L. A., Janatpour, M. J., Korner, H., Scheerens, H., Hessel, E. M., Cyster, J. G., et al. (2001) Immunity 15, 533-543. [DOI] [PubMed] [Google Scholar]
- 24.Ettinger, R. (2000) Curr. Top. Microbiol. Immunol. 251, 203-210. [DOI] [PubMed] [Google Scholar]
- 25.Pasparakis, M., Alexopoulou, L., Episkopou, V. & Kollias, G. (1996) J. Exp. Med. 184, 1397-1411. [DOI] [PMC free article] [PubMed] [Google Scholar]
- 26.Cook, M. C., Korner, H., Sean Riminton, D., Lemckert, F. A., Hasbold, J., Amesbury, M., Hodgkin, P. D., Cyster, J. G., Sedgwick, J. D. & Basten, A. (1998) J. Exp. Med. 188, 1503-1510. [DOI] [PMC free article] [PubMed] [Google Scholar]
- 27.Cox, D. R. (1972) J. R. Stat. Soc. B 34, 187-220. [Google Scholar]
- 28.Vasconcellos, R., Braun, D., Coutinho, A. & Demengeot, J. (1999) Int. Immunol. 11, 279-288. [DOI] [PubMed] [Google Scholar]
- 29.Resnitzky, D., Yarden, A., Zipori, D. & Kimchi, A. (1986) Cell 46, 31-40. [DOI] [PubMed] [Google Scholar]
- 30.Raveh, T., Hovanessian, A. G., Meurs, E. F., Sonenberg, N. & Kimchi, A. (1996) J. Biol. Chem. 271, 25479-25484. [DOI] [PubMed] [Google Scholar]
- 31.Radaeva, S., Jaruga, B., Hong, F., Kim, W.-H., Fan, S., Cai, H., Strom, S., Liu, Y., El-Assa, O. & Gao, B. (2002) Gastroenterology 122, 1020-1034. [DOI] [PubMed] [Google Scholar]
- 32.Moore, R. N., Larsen, H. S., Horohov, D. W. & Rouse, B. T. (1984) Science 223, 178-181. [DOI] [PubMed] [Google Scholar]
- 33.McCarty, M. F., Bielenberg, D., Donawho, C., Bucana, C. D. & Fidler, I. J. (2002) Clin. Exp. Metastasis 19, 609-615. [DOI] [PubMed] [Google Scholar]
- 34.Fantuzzi, L., Canini, I., Belardelli, F. & Gessani, S. (2001) Eur. Cytokine Network 12, 597-603. [PubMed] [Google Scholar]
- 35.Falk, L. A. & Vogel, S. N. (1990) J. Leukocyte Biol. 48, 43-49. [DOI] [PubMed] [Google Scholar]
- 36.Platanias, L. C., Uddin, S., Bruno, E., Korkmaz, M., Ahmad, S., Alsayed, Y., Van Den Berg, D., Druker, B. J., Wickrema, A. & Hoffman, R. (1999) Exp. Hematol. 27, 1315-1321. [DOI] [PubMed] [Google Scholar]
- 37.Onozaki, K., Urawa, H., Tamatani, T., Iwamura, Y., Hashimoto, T., Baba, T., Suzuki, H., Yamada, M., Yamamoto, S., Oppenheim, J. J., et al. (1988) J. Immunol. 140, 112-119. [PubMed] [Google Scholar]
- 38.Hoshino, K., Takeuchi, O., Kawai, T., Sanjo, H., Ogawa, T., Takeda, Y., Takeda, K. & Akira, S. (1999) J. Immunol. 162, 3749-3752. [PubMed] [Google Scholar]
- 39.Toshchakov, V., Jones, B. W., Perera, P. Y., Thomas, K., Cody, M. J., Zhang, S., Williams, B. R., Major, J., Hamilton, T. A., Fenton, M. J. & Vogel, S. N. (2002) Nat. Immunol. 3, 392-398. [DOI] [PubMed] [Google Scholar]
- 40.Nardelli, B., Zaritskaya, L., Semenuk, M., Cho, Y. H., LaFleur, D. W., Shah, D., Ullrich, S., Girolomoni, G., Albanesi, C. & Moore, P. A. (2002) J. Immunol. 169, 4822-4830. [DOI] [PubMed] [Google Scholar]
- 41.Ngo, V. N., Korner, H., Gunn, M. D., Schmidt, K. N., Sean Riminton, D., Cooper, M. D., Browning, J. L., Sedgwick, J. D. & Cyster, J. G. (1999) J. Exp. Med. 189, 403-412. [DOI] [PMC free article] [PubMed] [Google Scholar]
- 42.Sato, K., Hida, S., Takayanagi, H., Yokochi, T., Kayagaki, N., Takeda, K., Yagita, H., Okumura, K., Tanaka, N., Taniguchi, T. & Ogasawara, K. (2001) Eur. J. Immunol. 31, 3138-3146. [DOI] [PubMed] [Google Scholar]
- 43.Leaman, D. W., Chawla-Sarkar, M., Vyas, K., Reheman, M., Tamai, K., Toji, S. & Borden, E. C. (2002) J. Biol. Chem. 277, 28504-28511. [DOI] [PubMed] [Google Scholar]
- 44.Jovasevic, V. M. & Mokyr, M. B. (2001) J. Immunol. 167, 4895-4901. [DOI] [PubMed] [Google Scholar]
- 45.Sedgwick, J. D., Riminton, D. S., Cyster, J. G. & Korner, H. (2000) Immunol. Today 21, 110-113. [DOI] [PubMed] [Google Scholar]
- 46.Picaud, S., Bardot, B., De Maeyer, E. & Seif, I. (2002) J. Interferon Cytokine Res. 22, 457-462. [DOI] [PubMed] [Google Scholar]
- 47.Prevost-Blondel, A., Roth, E., Rosenthal, F. M. & Pircher, H. (2000) J. Immunol. 164, 3645-3651. [DOI] [PubMed] [Google Scholar]
Associated Data
This section collects any data citations, data availability statements, or supplementary materials included in this article.


