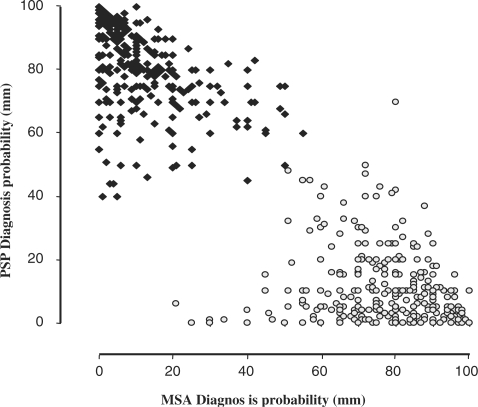
Fig. 4.
Convergent validity of NNIPPS Diagnostic Criteria with Investigators’ Diagnostic Probability (VAS). At the inclusion visit, following patients’ assignment to strata using the NNIPPS diagnostic criteria, investigators were asked to evaluate the probability of each diagnosis (PSP, MSA), using a 100 mm VAS. All 760 patients are plotted on the graph according to the probability score on each VAS (PSP-vertical axis, MSA-horizontal axis). Solid diamonds represent patients included in the PSP stratum; White circles represent patients included in the MSA stratum. Convergent validity of the NNIPPS inclusion criteria with the investigators’ assessment of diagnostic probability was tested with the point-biserial correlation. MSA, rpb = 0.93 (P < 0.0001), PSP, rpb = 0.95, (P < 0.0001).

